

INTRODUCTION
The question of how to succeed in regulating the behaviour of others has attracted considerable interest in linguistic, pragmatic and psychological research (e.g. Grice, Reference Grice, Cole and Morgan1975; Thomas, Reference Thomas1995; cf. Ervin-Tripp, Guo & Lampert, Reference Ervin-Tripp, Guo and Lampert1990). Choosing requests formulated indirectly as questions or hints have, for example, been described by speech act theorists as ‘costly and risky’ because they dissimulate the communicative intent and thereby fail to elicit the expected response (Thomas, Reference Thomas1995: 119). However, cross-cultural studies have found the choice of regulatory expressions to depend not only on alternatives within different linguistic systems (Kasper, Reference Kasper1990) but also on socio-cultural rules (Brown & Levinson, Reference Brown and Levinson1987) and on specific features in the situational context (Ervin-Tripp et al., Reference Ervin-Tripp, Guo and Lampert1990; Blum-Kulka, Reference Blum-Kulka1990). In most cultures, people would agree upon the adequacy of giving direct orders in situations of unidirectional communication where urgent compliance is important (e.g. medical surgery), but in everyday conversation, imperative directness might be felt by the addressee as face threatening or ‘impolite’ and thus be potentially ineffective, at least in Western societies (Brown & Levinson, Reference Brown and Levinson1987). A number of socio-cultural and situational mechanisms such as ‘social tactics’, ‘persuasive tactics’ and ‘social indices’ have been distinguished as being involved in the choice of direct or indirect expressions in conversation (Ervin-Tripp, Reference Ervin-Tripp1976; Ervin-Tripp et al., Reference Ervin-Tripp, Guo and Lampert1990; Blum-Kulka, Reference Blum-Kulka1990). Furthermore, social factors such as age and gender, and social or power relation and distance between the parties may interplay with such situational factors as the formality or rituality of the situation (Brown & Levinson, Reference Brown and Levinson1987). In formal situations, where a speaker lacks the special right to give orders or when the addressee is unfamiliar or is of a higher status, demanding speech acts such as direct requests would thus be considered as too coercive (Brown & Levinson, Reference Brown and Levinson1987).
In family discourse, however, where behavioural regulation serves socialization purposes and where the parties involved differ in age and power but relate closely to each other through family bonds and affection, a special case of directness has been observed. Blum-Kulka (Reference Blum-Kulka1990; Reference Blum-Kulka1997) even suggests an alternative ‘politeness scale’ (1990: 265), where direct requests phrased as imperatives, whether mitigated or not, are to be considered a neutral or ‘unmarked’ case (Blum-Kulka, Reference Blum-Kulka1997). In a study of socialization in a family context focusing on control acts in dinner talk with children aged 4–17 years, she found that more than two-thirds of all control acts used by parents within these families consisted of these types of direct requests (i.e. ‘neutral’ or ‘solidarity’ (mitigated) directives, according to the new terminology in Blum-Kulka, (Reference Blum-Kulka1997) ). A recent study of dinner talk involving twenty Swedish families with children aged 4–17 years furthermore suggests the use of direct requests to be predominant and most obvious in utterances specifically concerning the dinner activity, whereas other, non-immediate, topics within dinner conversation (school, sports, etc.) favour more indirect expressions (Brumark, Reference Brumark2006a). Indirectness was also regularly used ironically, and even aggressively, by the parents, especially when correcting the children's behaviour, which might raise doubts about family dinners as optimal for socializing the socio-cultural rules of politeness.
The present study of a smaller sample, from the same corpus of Swedish families referred to above, also examines direct and indirect dinner talk in relation to the outcome as compliant or non-compliant in parents and children aged 6–14 years. Relatively few linguistic–pragmatic studies have focused on the use and outcome of direct and indirect regulation by parents as well as by children in the current age range (cf. Blum-Kulka, Reference Blum-Kulka1997; De Geer, Tulviste, Mizera & Tryggvason, Reference De Geer, Tulviste, Mizera and Tryggvason2002).
Parents' direct and indirect regulation
As pointed out above, a preference for direct communication at the dinner table has been observed among parents as a group (Blum-Kulka, Reference Blum-Kulka1997). Actually, parents' use of direct expressions may have other reasons than choices within the impolite–polite dimensions, due to situational concerns or to family bonds, namely from the ambition of scaffolding and adapting their talk to their children's age.
Studies in developmental psychology and language acquisition provide evidence of caregivers' adaptive use of imperative and interrogative requests which match the development of the children's own grammatical forms, with requests ranging from imperative expressions to requests phrased as questions and declaratives (Bellinger, Reference Bellinger1979). Furthermore, caregiver adaptation has been found to support children's comprehension of and response to indirect requests, which would then encourage their acquisition of indirect (‘polite’) forms (Cross, Reference Cross, Snow and Ferguson1977; Bellinger, Reference Bellinger1979; Becker, Reference Becker1988; cf. the ‘fine tuning hypothesis’ introduced by Murray, Reference Murray1990). Similar adaptations to preschool children and younger school children (aged 4–10 years) appear in an earlier study mentioned above, where data suggest parental use of direct and indirect expressions to vary not only with different kinds of dinner talk or the number of siblings present at the table but also – and especially – with the age of the children (Brumark, Reference Brumark2006a).
Children's direct and indirect regulation
Developmental studies of children's acquisition of ‘polite’ forms further suggest that the ability to adapt the use of direct and indirect forms would be acquired quite early during the preschool years. Even children aged 2–5 years have been observed to produce – and respond to – indirect forms correctly, not only grammatically but also pragmatically, using politeness markers in a differentiated manner according to the requirements of the situation (Ervin-Tripp & Gordon, Reference Ervin-Tripp, Gordon and Schieffelbush1986). Thus, children would, for example, increase the use of deference markers from around three years of age when addressing unfamiliar or prestigious adults, or when running the risk of refusal (Ervin-Tripp et al., Reference Ervin-Tripp, Guo and Lampert1990). Furthermore, five-year-olds have been observed to use directness in ‘low-cost requests’ when they expect compliance. However, as Bellinger (Reference Bellinger1979) points out, the question remains as to whether children's performance reflects their pragmatic strategies in specific situations rather than their actual linguistic skills (cf. Becker, Reference Becker1988; Bellinger, Reference Bellinger1979; Snow, Perlmann, Gleason & Hooshyar, Reference Snow, Perlmann, Gleason and Hooshyar1990). Previous research on the development of ‘politeness’ also reports that children acquire and use indirect polite forms up to a certain age, after which they successively drop these forms. According to Ervin-Tripp et al. (Reference Ervin-Tripp, Guo and Lampert1990), this development may be explained in two ways: either older children realize politeness is not successful or younger children learn social indices prior to social and persuasive tactics.
Parents' compliance with children's direct and indirect behaviour regulation
According to two earlier studies of socialization in a family context, about one-half of the children's requests do seem to be complied with (Ervin-Tripp et al., Reference Ervin-Tripp, Guo and Lampert1990; Blum-Kulka, Reference Blum-Kulka1997). In her study of dinner talk in Jewish-American, Israeli and American-Israeli families, Blum-Kulka (Reference Blum-Kulka1997) found children's requests to amount to one-third of all requests in the families and to be complied with in 40–60 percent of all cases of parental regulation. Ervin-Tripp et al. (Reference Ervin-Tripp, Guo and Lampert1990) also observed adult compliance in one-half of the children's requests, but discovered differences in compliance depending on the degree of directness. Neutral directness was complied with in three-quarters of all requests, compared to compliance with only one-half of all indirect requests. Furthermore, one-third of all indirect requests produced refusal compared to only 15 percent of direct requests. Indirect expressions thus ‘reduced success and increased refusals for most listeners’ (Ervin-Tripp et al., Reference Ervin-Tripp, Guo and Lampert1990: 322).
Children's compliance with parents' direct and indirect behaviour regulation
Children's compliance with parental commands has been most extensively studied in research within developmental psychology, sometimes by using questionnaires to ask parents about non-compliance in their children's behaviour (Kalb & Loeber, Reference Kalb and Loeber2003). On the one hand, parents report non-compliance as a problem to a varying extent during the children's preschool years (Kuczynski, Kochanska, Radke-Yarrow and Girnius-Brown, Reference Kuczynski, Kochanska, Radke-Yarrow and Girnius-Brown1987). However, as children reach school age (5–7 years), their manifestations of non-compliance seem to decrease and change, which corresponds to the parents altering their ‘disciplining techniques’ (Kuczynski et al., Reference Kuczynski, Kochanska, Radke-Yarrow and Girnius-Brown1987). On the other hand, 20–40 percent of non-compliance has been regarded by observational studies as natural behaviour in healthy children, and up to 50 percent of non-compliant responses to parents' control acts have been described ‘as falling within reasonable bounds for 10- to 11-year-old boys’ (Patterson & Forgatch, Reference Patterson and Forgatch1987, cited in Kuczynski & Hildebrandt, Reference Kuczynski, Hildebrandt, Grusec and Kuczynski1997). Non-compliance has also been related to parenting styles in general and parents' different commanding strategies in particular. Young children have, for example, been found to comply more easily with direct than with indirect commands (Kuczynski et al., Reference Kuczynski, Kochanska, Radke-Yarrow and Girnius-Brown1987), a finding that concurs with linguistic and developmental studies of children's responses to requests, referred to above. As children grow older, non-compliance may develop into negotiation in order to achieve a compromise or another solution which is more acceptable to both parties (Brumark, Reference Brumark2008).
Aim and assumptions
The aim of the present study is thus to explore the use of direct and indirect behaviour regulation and the outcome of either compliance or non-compliance during dinner conversation in ten Swedish families, five with two children aged 6–7 and 10–11 years (referred to as family group 1), and five with two children aged 10–11 and 13–14 years (referred to as family group 2). The children thus form three age groups, 6–7 years, 10–11 years and 13–14 years. Those aged 10–11 are further divided into two groups depending on the age of their siblings. Drawing on previous research on direct requests in parent–child interaction, especially within dinner talk (Blum-Kulka, Reference Blum-Kulka1990; Reference Blum-Kulka1997), three main research questions based on the assumption of directness as the preferred mode of behaviour regulation at the family dinner table will be addressed.
Since the main issue of the current study is to find out to what extent directness and indirectness produces compliance in the ten Swedish families, the first question is whether the family members also in this smaller sample use direct rather than indirect requests. In the earlier study focusing exclusively on regulatory expressions used in twenty families with younger and older children, regulation at the dinner table was found to be fairly direct. However, mitigation appeared less frequently in these Swedish families (Brumark, Reference Brumark2006a) compared to those in Blum-Kulka (Reference Blum-Kulka1997). The present study is therefore based on the system of ‘cross-linguistically valid directness distinctions’ in Blum-Kulka, House & Kasper (Reference Blum-Kulka, House and Kasper1989), where mitigation is regarded as separate from but optionally combined with the direct mode as well as with the conventionally indirect and the non-conventional indirect mode, rather than on the ‘new scale’ where ‘neutral’ directness includes mitigated requests as a special category (Blum-Kulka, Reference Blum-Kulka1997: 152). In accordance with these ‘cross-linguistically valid directness distinctions’, direct regulation refers to direct requests, orders, naming of desired objects, and expressions of need and want (the ‘direct mode’ in Blum-Kulka et al., Reference Blum-Kulka, House and Kasper1989; cf. Grice, Reference Grice, Cole and Morgan1975). Indirect regulation includes indirect requests, formulated as interrogatives, and hints (the ‘conventional and non-conventional indirect mode’ in Blum-Kulka et al., Reference Blum-Kulka, House and Kasper1989). Mitigation, whether appearing in direct or in indirect requests, was, however, not considered. In order to facilitate further cross-linguistic comparisons with the Swedish data, a thorough inventory of all direct and indirect requests coded will be given.
The second question addressed is related to the outcome, i.e. whether parents and children are more likely to comply with direct than with indirect regulatory talk. Compliance is defined according to Kuczynski & Hildebrandt (Reference Kuczynski, Hildebrandt, Grusec and Kuczynski1997) as a response within 15 seconds after the request by performing the requested action or, in the case of requests for action to be taken in the future, by verbal affirmation that the action will be performed. Given the findings of neutral directness in Blum-Kulka, direct requests at the family dinner table could be expected to favour compliance in both parents and children. The question is therefore to what extent parents and children comply with each other's direct and indirect regulatory talk.
The third question to be addressed is whether the tendency to use and comply with direct or indirect regulation in the two family groups may be related to the age of the children (6–7, 10–11 and 13–14 years). Previous research suggests that the children's age would affect the tendency toward both direct regulation and compliance (Brumark, Reference Brumark2006a). Blum-Kulka (Reference Blum-Kulka1997) did not find any relation between parents' use of directness and the children's age, but findings in developmental psychology suggest that compliance patterns in children would change with age (Kuczynski & Hildebrandt, Reference Kuczynski, Hildebrandt, Grusec and Kuczynski1997; Kalb & Loeber, Reference Kalb and Loeber2003). The question is whether parents and children in the family group containing younger siblings (6–7 years) tend to use direct requests and comply more often with them than is the case among parents and children in the family group of older children (13–14 years). However, the impact exerted by age differences is also assumed to interfere with the possible influence on regulatory behaviour exerted by the presence of younger or older siblings (cf. Oshima-Takane & Robbins, Reference Oshima-Takane and Robbins2003). The question is thus whether differences relating to the presence of younger or older siblings might be revealed among the children aged 10–11 years and their parents in the mutual use of and response to direct requests.
METHODS
Participants, recordings and transcription
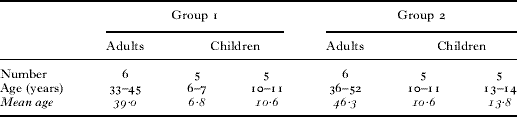
Ten urban middle-class families including nine mothers, three fathers and twenty children of ages from 6 to 14 years participated in the study (Table 1). As mentioned in the Introduction, the families were divided into two groups depending on the age of the children. Each family had one child aged 10–11 (M 10 ; 6, SD 0 ; 20) years but in five families there was one younger sibling aged 6–7 years (M 6 ; 8 years) and in five families, there was one older sibling aged 13–14 years (M 13 ; 8 years). The children formed three age groups, 6–7 years, 10–11 years and 13–14 years. The reason for focusing on these age spans is the relative lack of research on regulatory talk within the interaction between parents and their preadolescent and adolescent children. There are also some contradictory findings regarding non-compliance, especially in preadolescents (Kuczynski & Hildebrandt, Reference Kuczynski, Hildebrandt, Grusec and Kuczynski1997; Kalb & Loeber, Reference Kalb and Loeber2003). Furthermore, the children aged 10–11 years in the two family groups were focused on in order to reveal influences derived from their birth order and/or the presence of younger or older siblings at the dinner table. Earlier findings suggest that younger siblings in families with two children, irrespective of age, receive more regulatory attention from their parents than older ones (e.g. Brumark, Reference Brumark2006a). On the other hand, the ten- to eleven-year-olds might function as ‘constants’ in comparisons between groups in the case of no relevant differences between them, and would thus allow for collapsing the age groups within each family group. The gender of the children was, however, not considered in this study, due to the size of the subgroups and due to the findings in Blum-Kulka (Reference Blum-Kulka1997) which indicated that this parameter (similar to age) did not seem to influence the use of direct or indirect requests.
Demographic data: number and age of family members
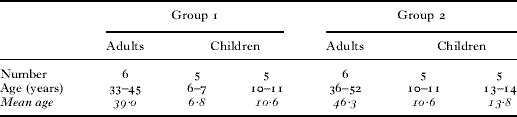
All families consisted of two parents, although one mother and seven fathers were absent from the family dinners for different reasons, such as work, travel or illness. Thus, four single parents and one couple in each group participated in the study. Table 1 shows the number, gender and age of all participants during the family dinners.
The dinner table conversations were videotaped in their entirety, usually in the family kitchen while the researcher was absent or waiting elsewhere in the house. The ten recordings (average duration 16·8 minutes) were transcribed in their entirety, and five minutes from each transcript were compared to the video-recordings by two researchers familiar with the actual transcription methods. The inter-observer reliability resulting from the comparison of these transcripts amounted to 0·85, according to Cohen's kappa.
Segmentation and coding
Since the focus was on the verbal and non-verbal regulation of behaviour, and non-verbal as well as verbal responses in the context of family dinner interaction, the units of turn and utterance were considered to be the most appropriate for the segmentation of the verbal utterances and the non-verbal expressions which were identified here.
A turn was defined as a verbal utterance and/or non-verbal expression (e.g. distal signals such as pointing or head shaking and/or tactile signals such as a positive/negative touch; cf. Koenig, Ciccetti & Rogosh, Reference Koenig, Ciccetti and Rogosh2000) by which one participant provokes or provides responses within the conversation (cf. Sacks, Schegloff & Jefferson, Reference Sacks, Schegloff and Jefferson1974). An utterance was defined as a part of a turn corresponding to one prosodic clause and connected to one or more syntactic clauses (see, for instance, Brumark, Reference Brumark1989). Most often one turn corresponded to one utterance, but could occasionally consist of more than one utterance, as in the following example, where the mother's answer consists of one turn but two utterances:
(1)
CHILD: Papper
‘Paper!’
MOTHER: Vill du ha papper?
‘Do you want paper?’ (3 s)
Jag ska gå å hämta lite då.
‘I will go and get some then.’
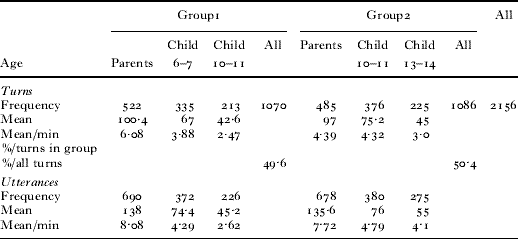
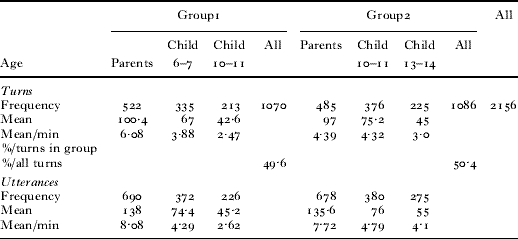
Table 2 shows frequencies, means, mean frequencies per minute and relative frequencies of utterance and turns, as well as the ratio between turn and utterance.
Frequencies, mean frequencies per minute of turns and utterances, and relative frequencies of turns/utterances (turn/utterance ratio) across group
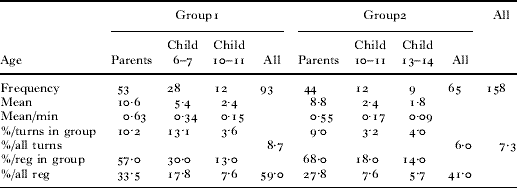
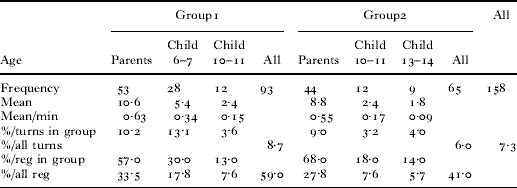
All verbal and non-verbal behaviours of all participants, identified and segmented as turns, were analysed as to whether they were part of regulatory interactions or not. Those turns of both parents and children which were considered to be involved in regulatory interactions were then coded into two main kinds: regulatory turns/utterances by which behaviour may be regulated, here termed regulators (see Hellspong, Reference Hellspong1988; Brumark, Reference Brumark1989) to avoid confusion with similar terms (e.g. ‘requests’ including for instance ‘permission directives’ in Ervin-Tripp (Reference Ervin-Tripp1976) or ‘control acts’ in Ervin-Tripp et al. (Reference Ervin-Tripp, Guo and Lampert1990) and Blum-Kulka (Reference Blum-Kulka1987; Reference Blum-Kulka1997)), and verbal or non-verbal responses to regulation, here termed outcome (thus including cases of no response). These regulators, which direct and control non-verbal and verbal acts, actions and activities during the dinner may be accomplished in a number of different ways, as being non-verbal (see above regarding non-verbal behaviours considered as turns) and/or verbal acts, i.e. verbal utterances. Non-verbal acts – head-shakings, touch, etc. – accompanying or emphasizing verbally phrased regulators were not coded as separate non-verbal regulators. Table 3 shows frequencies, means, mean frequencies per minute and relative frequencies of regulators as well as the ratio between turn and regulator.
Frequencies and relative frequencies of regulators (Reg), and relative frequencies of regulators/turns (turn/regulator ratios) across group
The regulators were then coded into two dimensions, direct or indirect, depending on their estimated directness/indirectness according to the ‘cross-linguistically valid directness distinctions’ established in Blum-Kulka et al. (Reference Blum-Kulka, House and Kasper1989) (between the ‘direct mode’ on the one hand, and the ‘conventional’ and ‘non-conventional mode’ on the other).
direct regulation in the present study refers to direct requests (i.e. the ‘direct mode’ in Blum-Kulka et al. (Reference Blum-Kulka, House and Kasper1989); cf. Brumark, Reference Brumark2006a), expressed in Swedish:
(i) by the explicit or implicit naming of the requested action, e.g. phrasing:
(a) the action verb in the imperative mode, e.g. Sluta!, Sitt ner!, Ge mig X! (‘Stop (it)!’, ‘Sit down!’, ‘Give me X!’);
(b) the action verb in the present tense, e.g. Du är där! (‘You are there!’ in a directive tone of voice, meaning ‘You have to stay where you are!’);
(c) the modal verb in the present or past tense and the action verb in the infinitive, negated or not, e.g. Du måste X!, Du kan X nu!, Du bör X!, Du får X! or Så får du inte göra!, indicating the actual action to be stopped (‘You have to X’, ‘You can X now’, ‘You should X’, ‘You may do X!’, ‘You shouldn't do that!’); or:
(ii) by explicit declaratives or performatives which mark the wish for the addressee to do X, e.g. Jag vill att du X!, Jag tycker att du ska X!, sometimes mitigated as in Jag föreslår att du X (‘I want you to X’, ‘I think you should X’, etc.);
(iii) by expressions of needs, wants and wishes for objects (cf. requests for ‘goods’ in Blum-Kulka, Reference Blum-Kulka1997; cf. ‘need statements’ in Ervin-Tripp, Reference Ervin-Tripp1976), e.g. Jag vill ha Y! or only Y!, followed by pointing to the desired object (‘I want Y!’, ‘Y!’), or simply:
(iv) by directive ellipses such as Mjölk! (‘Milk!’, meaning ‘Give me the milk!’) or Här! (‘Here!’ meaning ‘Here you are!’).
Non-direct (indirect) regulation includes indirect requests (cf. the ‘conventional mode’ in Blum-Kulka et al., Reference Blum-Kulka, House and Kasper1989) expressed in Swedish;
(i) by interrogatives (cf. ‘conventional mode’ in Blum-Kulka, Reference Blum-Kulka1997; cf. ‘question directives’ and ‘imbedded imperatives’ in Ervin-Tripp, Reference Ervin-Tripp1976) which, at least in theory, gives the addressee the option to refuse to perform the expected action by:
(a) naming the expected action, e.g. Kan du X?, Skulle du kunna X?, Vill du vara snäll att X? (‘Can you X?’, ‘Could you X?’, ‘Could you please X?’);
(b) focusing on the wanted action and the object, e.g. Kan du ge mig Y?, Kan jag få Y? (‘Can you pass Y?’, ‘May I have Y?’);
(ii) by certain declaratives focusing on the wanted object, expressing a need like Jag ska be att få Y (approximately, ‘I'm going to ask if I may have Y.’), or:
(iii) by hints (the ‘non-conventional mode’ in Blum-Kulka et al., Reference Blum-Kulka, House and Kasper1989), e.g. a father's trying to stop his son's leaning over the table by the ironic comment Om du visste vad söt du ser ut när du sitter så där! (‘If you knew how cute you look sitting like that!’).
Utterances which are not coded as regulatory include ‘Do you want Y?’ etc., intended to request information about a possible wish of the addressee. The request in the following example, however, was coded as regulatory:
(2)
MOTHER: Hade du några läxor?
‘Do you have any homework?’
CHILD: Nej.
‘No’
Since the mother's request obviously has the function of prompting the child to do his homework, it was analyzed as a behavioural regulator rather than a request for information. Such indirect requests occurred frequently and regularly seemed to be considered by the children as provocations to be resisted.
Since retries repeating regulatory utterances were few, and generally rephrased, they were coded as separate instances of regulation, as in example (3).
(3)
MOTHER: Du måste sitta ner!
‘You must sit down!’
CHILD: (stands up)
MOTHER: Nej, du måste sitta ner!
‘No, you must sit down at the table!’
CHILD: (sits down)
The outcome, i.e. the expected (or supposedly expected) verbal or non-verbal immediate effect (within 15 s) of the regulatory utterances (Kuczynski & Hildebrandt, Reference Kuczynski, Hildebrandt, Grusec and Kuczynski1997; cf. Blum-Kulka, Reference Blum-Kulka1997; De Geer et al., Reference De Geer, Tulviste, Mizera and Tryggvason2002) could be:
compliance, manifested as performance of the action asked for or confirmation of a performance in the future by a verbal response (‘Yes, I'll do X’), or:
non-compliance, manifested as negotiation, e.g. arguing about the action asked for (‘Why do I have to do X’, ‘I've no time to do X’), ignorance, e.g. leaving the regulator unnoticed, or resistance, e.g. refusing to perform the action asked for (‘No, I don't want to do X’).
For actions to be performed in the future there needed to be verbal proof (within 15 s) of the addressee's intent to accomplish them in the actual conversation, e.g. by an affirmative, such as Ja, jag ska (‘Yes I will do that.’). The inter-observer accordance between two observers amounted to 0·80 for directness/indirectness and to 0·85 for compliance/non-compliance, according to Cohen's kappa.
Analyses of data
As a preliminary step, frequencies, means and relative frequencies were calculated for all coded turns/utterances from all participants during the dinners. Second, the frequencies, means and relative frequencies of all direct/indirect regulators issued by parents and children and directed at each other, as well as the frequencies and relative frequencies of all coded instances of compliance/non-compliance as responses to their direct and indirect regulation, were calculated. Regulation between the children rarely occurred at the dinner table and was not further considered. Third, based on the calculations of frequencies, means and relative frequencies, comparisons were carried out according to the main research questions: (i) between direct and indirect regulation in the parents' and children's dinner talk directed at each other; (ii) between parents' and children's compliance and non-compliance with each other's direct and indirect regulation; and (iii) between family groups of younger and older children as well as between age groups within specific family groups with regard to use of and compliance with direct and indirect regulation. In addition, the ten children aged 10–11, five in each family group, were focused on and a comparison was made in order to discover if the presence of younger or older siblings might influence the use of and compliance with direct and indirect regulators. Finally, analyses according to fisher exact (used on small populations) were performed to check the significance of differences between groups. Further, correlations (the phi-coefficient) were tested to reveal the interrelations between the regulators which were used, and the compliance or non-compliance of parents and children in the two family groups.
RESULTS
Basic data on turns and regulatory turns
Basic calculations of frequencies of turns and utterances, displayed in Table 2, show roughly the same number of turns in the two family groups during the dinners (1070 in group 1 and 1086 in group 2, i.e. a total 2156) and roughly the same pattern for the distribution of turns between family members. Out of the total number of turns, the total share of regulatory turns amounted to 7·3% (which concurs with the proportion in an earlier study of a larger sample of the same corpus; see Brumark, Reference Brumark2006a).
Table 3 indicates the frequencies and relative frequencies of all regulatory turns of all family members as well as turn/regulator ratios. Despite a difference between the groups regarding the percentages of regulators (59% of the total amount in group 1 compared to 41% in group 2), the distribution of regulatory turns between family members was found to be fairly equal (e.g. around 30% among parents and the same proportion, 7·6%, among the ten- to eleven-year-old children). This tendency, however, does not apply to the youngest and the oldest children (6–7 years and 13–14 years, respectively): the youngest children produced between three and four times more regulators than the oldest ones. A look at the percentages of the children's shares of regulatory turns within each family group furthermore reveals equal amounts between the oldest children in the two groups (aged 10–11 and 13–14 years respectively), a slightly higher proportion among the ten- to eleven-year-olds in group 2 (with siblings aged 13–14 years) and twice as many regulators among the youngest children (6–7 years with siblings aged 10–11 years).
The similarities between the ten- to eleven-year-olds with regard to frequencies and shares of regulatory turns, as well as the small amount of data in each group, motivated collapsing the age groups within the family groups. Thus, age groups were considered only when relevant and significant differences were discovered.
To what extent do parents and children use direct and indirect regulation?
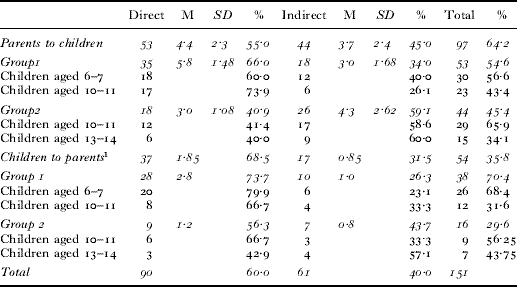
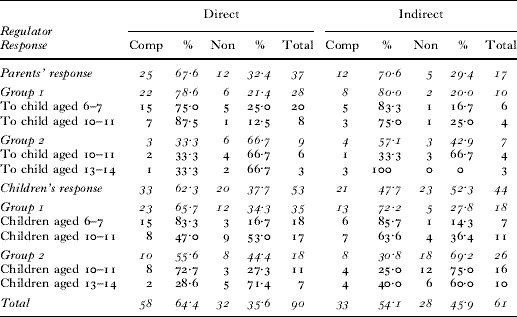
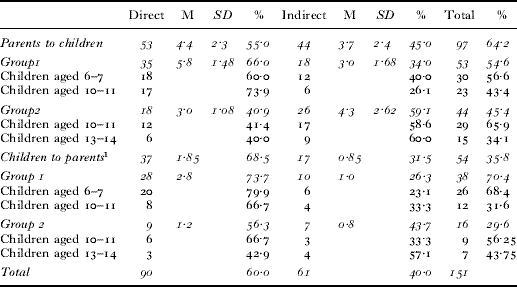
The first research question addressed was whether parents and children tend to be direct or indirect in regulating each other's behaviour at the dinner table. Lines in italics, ‘Parents to children’ and ‘Children to parents’, in Table 4 indicate the frequencies, means and percentages of parents' and children's direct and indirect regulators when they address each other. Since only regulatory turns from parents to children and from children to parents were accounted for, three direct and four indirect turns made by children to siblings were omitted from the children's shares (cf. Tables 2 and 3). An analysis of all remaining regulatory turns made by the parents to their children and by the children to their parents revealed directness in 90 (60%) and indirectness in 61 (40%) instances of regulation (see ‘Total’ at the bottom of Table 4). Altogether, parents and children were significantly more direct than indirect in their regulatory utterances at the dinner table (Fisher exact: p<0·03).
Frequencies, means and percentages of parents' and children's direct and indirect regulators addressing children and parents across group
1 Standard deviations were not calculated, due to small numbers.
Parents' direct and indirect regulation
A calculation of parents' regulatory turns addressed to their children resulted in 53 direct and 44 indirect regulators, or 55% and 45% (see ‘Parents to children’ in Table 4), respectively, suggesting a smaller share of directness than observed in the parents of Blum-Kulka's study, where between 60% and 80% direct parental control acts were found (see Blum-Kulka, Reference Blum-Kulka1997). Thus, the results of parental regulation of the present study gives only some support to Blum-Kulka's conclusion that parents' dinner talk would show ‘a very high preference for the direct mode’ (Blum-Kulka, Reference Blum-Kulka1997: 148). This disagreement only partly stems from differences between coding systems and differences regarding language and culture (see further Discussion).
Children's direct and indirect regulation
The children in general tended to be more direct than indirect in regulating their parents' behaviour. Comparing the relative frequencies of children's direct and indirect regulation in both groups suggests that the share of direct regulators would cover two thirds (68·5%) of the total amount (see ‘Children to parents’ in Table 4).
To what extent do parents and children comply with each other's direct and indirect regulation?
The second research question addressed concerns the compliance or non-compliance of parents and children to each other's direct and indirect behaviour regulation. Lines in italics, ‘Parents' response’ and ‘Children's response’ in Table 5 show the frequencies and relative frequencies of parents' responses as representing either compliance or non-compliance to their children's direct/indirect regulators and of children's responses to their parents' direct/indirect regulators.
Frequencies and relative frequencies of parents' and children's response as compliance (Comp) and non-compliance (Non) to children's and parents' direct and indirect regulators across group
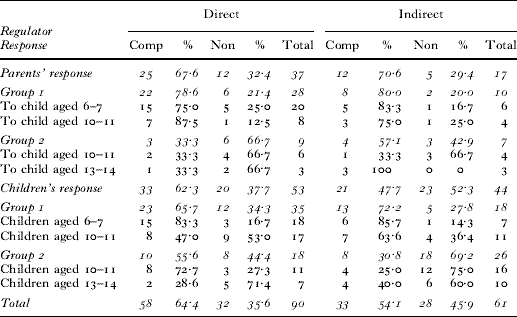
Accounting for the compliance or non-compliance of all direct and indirect regulators occurring during the family dinners produces inverse proportions: compliance appeared in 64·4% of the direct regulators compared to 54·1% of the indirect regulators, whereas non-compliance occurred in 35·6% of the direct and 45·9% of the indirect regulators (see ‘Total’ in italics at bottom of Table 5). Altogether, parents and children complied significantly more often as a response to direct rather than to indirect regulation at the dinner table (Fisher exact: p<0·01).
Parents' compliance with their children's direct and indirect regulation
Previous research suggests that parents would comply with their children's regulatory utterances in between 40% and 60% of the cases (Blum-Kulka, Reference Blum-Kulka1997). In the present study (of a smaller sample), approximately 70% of children's regulators were complied with, irrespective of whether they were direct or indirect. Analyses of parents' responses further show a general tendency of parental compliance with indirect child regulation (see ‘Parents' response’ in Table 5). Compliance appeared as a response to children's indirect regulation in about two-thirds of all cases (70·6%), which is comparable to the parents' compliance in Blum-Kulka (Reference Blum-Kulka1997).
Children's compliance with their parents' direct and indirect regulation
Altogether, the children also comply in about two-thirds of all cases of parental regulation, but when they are divided in family groups and age groups they show scattered patterns of compliance (see the third research question below and italicized line ‘Children's response’ in Table 5).
To what extent do family groups and age groups differ in their use of and compliance with direct and indirect regulation?
The third research question addressed the differences in the use of compliance with direct and indirect regulation between family groups and age groups. Raw scores and relative frequencies for children of different ages within the family groups are presented in Table 5, but age groups were considered only when relevant and significant differences were discovered.
Parents' and children's direct and indirect regulation related to groups
Table 4 indicates the frequencies, means and percentages of parents' and children's direct and indirect regulators appearing in addresses to each other in family groups 1 (with children aged 6–7 and 10–11 years) and 2 (with children aged 10–11 and 13–14 years).
Parents' direct and indirect regulation related to family group and age group
The analysis of parental regulatory turns addressed to children of different ages revealed, as expected, clear differences regarding direct and indirect regulators between family group 1 with children aged 6–7 and 10–11 years and family group 2 with children 10–11 and 13–14 years (Table 4). Whereas 35 of the parental regulators in group 1 with younger siblings were direct (between 60% and 74%, or 66·0% altogether; M=5·8, SD=1·48) and 18 were indirect (between 26% and 40%, or 34·0% altogether; M=3·0, SD=1·68), those of the parents of group 2 with older siblings show opposite proportions between direct and indirect regulators, e.g. 18 direct regulators (40·9%, M=3·0, SD=1·08) and 26 indirect regulators (59·1%, M=4·8, SD=2·62).
Furthermore, the proportions of parental regulatory turns correlated positively with the children's ages (the phi-coefficient: r=−0·25), i.e. the children in group 1, aged 6–7 and 10–11 years received more direct regulation than those in group 2, aged 10–11 and 13–14, and the differences between the groups turned out to be significant (Fisher exact: p<0·05). The conclusion to be drawn from these results would be that parents adapt their use of direct and indirect regulation to their children's age (cf. Brumark, Reference Brumark2006a; Blum-Kulka, Reference Blum-Kulka1997). Since the children aged 10 years in group 1 were more often addressed by direct regulators than those of the same age in group 2, the parents also seemed to adapt their regulation to the younger siblings when addressing their older children.
Children's direct and indirect regulation related to family groups and age groups
Comparisons between the children in the two family groups furthermore suggest variations regarding directness and indirectness, but the differences between the family groups did not reach significance according to Fisher exact (p<0·1). The children aged 10–11 years show similar proportions of direct and indirect regulators (66·7% and 33·3%, respectively) despite differences between the family groups regarding the amount of regulatory turns (see Table 4). Consequently, their contribution does not alter the shares of direct and indirect regulation of children in the two family groups.
Parents' and children's compliance and non-compliance related to groups
Table 5 shows the frequencies and percentages of parents' and children's responses to each other's direct and indirect regulators in family group 1 and 2.
Parents' compliance and non-compliance related to family and age groups
Significant differences were found between the family groups (with younger or older siblings) regarding parents' compliance with their children's direct regulation (Fisher exact: p<0·05). In group 1, with children aged 6–7 and 10–11 years, parents were more inclined to respond by compliance with their children's direct regulators than was the case in group 2, with children aged 10–11 and 13–14 years (78·6% compared to 33·3% of all direct child regulators; see ‘Parents’ response' in Table 5).
The family groups were also compared with regard to the correlation between children's direct or indirect regulators and parental compliance. A positive, though not significant, correlation was found between children's directness and compliance in family group 1 (with younger siblings). In family group 2, however, the ten- to eleven-year-old children's indirect regulation and the older siblings' direct regulation negatively correlated with parents' compliance (r=−0·25). Thus parents tended to refuse to comply with the older children's direct regulation and with the ten- to eleven-year-old siblings' indirect regulation.
Children's compliance and non-compliance related to family and age groups
Comparisons between family groups also suggest that the children in group 1 would comply more often with parents' direct regulators than those in group 2 (see ‘Children's response’ in Table 5), but this finding did not reach significance. On the other hand, indirectness in parental regulation triggered compliance in group 1 (with children aged 6–7 and 10–11 years) but non-compliance in group 2 (with children aged 10–11 and 13–14 years; see Table 5). Two-thirds of the parents' indirect regulators in group 1 were complied with, compared to one-third in group 2 (see Table 5). In group 2 (with children aged 10–11 and 13–14), child responses also correlated negatively with parental indirectness (r=−0·25). The differences between the family groups were significant (Fisher exact: p<0·05), but the five teenagers' negotiation was to a great extent responsible for this non-compliance pattern (see Table 5)!
Actually, negotiation triggered by non-compliance (or hesitation to comply) appeared equally distributed in both family groups (eight in group 1 and nine in group 2). In group 1 with younger children, negotiation arose in respect to conflicts related to the dinner activity, particularly to the children's table manners. In group 2, lengthy negotiations rather concerned homework to be done or other matters related to school or spare time (see examples (4) below and (7) and (8) in Discussion).
As for the children aged 10–11, those in group 1 refused to comply with more than one-half of their parents' direct regulators, whereas those in group 2, which included older siblings, were significantly more non-compliant with indirect regulators than with direct ones (see Table 5), that is, their compliance related negatively to parental indirectness (Fisher exact: p=0·01; r=−0·47). Example (4) illustrates a fairly common situation where a mother in group 2 (with teenage siblings) tries by using an indirect request to elicit talk from her ten-year-old daughter, who in turn finds her mother's suggestion as provocative and refuses:
(4)
MOTHER: Jaha, vad brukar vi prata om på måndagar? Din fiol va?
‘Okay, what do we talk about on Mondays? Your violin, don't we?’
CHILD: Nää!
‘No!’
These findings concur with the amounts of non-compliance for this age group (50%) claimed by Patterson & Forgatch (Reference Patterson and Forgatch1987; cited in Kuczynski & Hildebrandt, Reference Kuczynski, Hildebrandt, Grusec and Kuczynski1997). Furthermore, the ten- to eleven-year-olds in group 1 complied less with parental directness than their younger siblings, and those in group 2 complied less with parental indirectness than their older siblings, but the differences were too small to be significant. That is, there was no significant influence of birth order on preadolescents' compliance in this sample.
DISCUSSION
Before proceeding to the discussion, the most important findings will be summarized. Despite a small sample of recordings and few instances of certain variables, some conclusions could nevertheless be drawn from the findings. First, the two family groups were fairly equal with regard to number of turns during the dinners as well as the distribution of turns between family members. They differed, however, because of a larger amount of regulation appearing in the family group with younger children.
Second, dinner talk was found to be predominantly direct, which supports the findings in Blum-Kulka (Reference Blum-Kulka1997) and Brumark (Reference Brumark2006a). But this general conclusion has to be modified by distinguishing between the two family and age groups and between parents and children. The parents showed a predilection for direct communication at the dinner table, but they used directness differently depending on the age of the children: the younger children were addressed by direct regulators in two-thirds of all cases, whereas the opposite tendency could be seen in families with older children. The children also tended to be direct when regulating their parents' behaviour, but the younger children used three times as many direct regulators as the older ones. This latter finding did not, however, reach significance.
Third, compliance appeared in two-thirds of all direct regulators made by parents and children, but almost one-half of all parental indirect regulators were not complied with. However, once again there were differences between the family and age groups: whereas the younger children were successful in getting compliance in around 75% of their regulators irrespective of whether they used direct or indirect regulation, the older children (aged 10–11 and 13–14 years) received positive responses only in somewhat more than one-half of their indirect and in one-third of their direct regulators. There were, however, considerable differences between the siblings within family group 2. The variations in parental compliance were, furthermore, reflected in the children's response to parental regulation. All in all, parental regulation brought compliance in somewhat more than half of the cases, but whereas the children of group 1 (aged 6–7 and 10–11 years) complied in about 70% of cases with direct as well as indirect parental regulation, the children of group 2 (aged 10–11 and 13–14 years) showed less compliance with direct regulators and much less with indirect parental regulators. Actually, the teenagers in group 2 were those who were most often reluctant to comply with parental control and those most likely to engage in negotiation about the reasons why and when to accomplish tasks ordered by their parents. Nevertheless, these differences between family groups were significant, and the results also support findings in developmental and psychological research with regard to pre-adolescents' responsiveness to parents' directives (see Ervin-Tripp et al., Reference Ervin-Tripp, Guo and Lampert1990; Blum-Kulka, Reference Blum-Kulka1997; Kuczynski & Hildebrandt, Reference Kuczynski, Hildebrandt, Grusec and Kuczynski1997).
Finally, the children aged 10–11 in group 1 were more non-compliant with parental directness than their younger siblings, and those in group 2, which included older siblings, were more non-compliant with indirect regulation than their older siblings. These findings concur with the non-compliance patterns found for this age group in previous studies (see Kuczynski & Hildebrandt, Reference Kuczynski, Hildebrandt, Grusec and Kuczynski1997). The ten- to eleven-year-olds' readiness to comply with parental regulation also seemed affected by the presence of their older siblings, who triggered them to test the limits of parental authority, but significance could not be obtained for this sample (cf. Brumark, Reference Brumark2008).
Thus, the main results of the present study suggest that behaviour regulation between parents and children tends to be direct and also is most often successful if it is direct. This concurs in most respects with the findings from previous research. These conclusions, however, presume that the main distinctions between directness and indirectness would be similarly significant in the studies compared irrespective of linguistic and cultural differences. As mentioned in the Introduction and further developed in Methods, the present study of Swedish dinner conversations was based on a coding system where these main dimensions, direct and indirect, are claimed to be cross-linguistically and culturally valid (according to the Cross-Cultural Speech Act Realization Patterns; see further Blum-Kulka et al., Reference Blum-Kulka, House and Kasper1989). However, there are some cultural variations within these dimensions, especially regarding the use of and reactions to hints (e.g. among American and Jewish speakers; see further Blum-Kulka, Reference Blum-Kulka1987). Comparisons between Swedish data and the examples presented in Ervin-Tripp's extensive study of ‘directives’ collected from different contexts (Ervin Tripp, Reference Ervin-Tripp1976) show major similarities with regard to linguistic realizations but also suggest some differences regarding use in certain contexts (e.g. in cases of age and rank differences, where US English seems to vary more in formality). Minor differences also appear between the studies regarding the terminologies (e.g. ‘imbedded imperatives’ in Ervin-Tripp (Reference Ervin-Tripp1976), coded as indirect requests in the present study), but these variations generally do not have any bearing on the main dimensions within the coding systems. What may differ is the interpretation of data, as in Blum-Kulka's study of Jewish-American, Israeli and American-Israeli families, where the special kinds of mitigating solidarity markers provide reasons for regarding non-aggravated direct requests in family discourse as being ‘neutral’ (Blum-Kulka, Reference Blum-Kulka1997).
Bearing these variations in mind, the results from the present study may nevertheless be compared to those in, for example, Blum-Kulka (Reference Blum-Kulka1997), despite linguistic and cultural differences. There are a number of possible explanations for this general preference for direct regulation and for the relative inefficiency of indirect regulation in family dinner talk. As pointed out by Blum-Kulka (Reference Blum-Kulka1997), the tendency to use direct requests at the dinner table most probably stems from the special context of the family dinner (cf. Ervin-Tripp, Reference Ervin-Tripp1976). Family meals in Western society are generally characterized by three types of talk (not separated in the present study): social conversations, instances of pedagogic comments and highly routinized activity-related (or ‘instrumental’) talk, where direct requests which regulate the physical activity are not felt as face-threatening but instead are tolerated and promptly responded to (see further Brumark, Reference Brumark2006a). The large amount of compliance with younger children's direct regulators may in several situations be a result of emergency reactions, for example when some kind of assistance is called for (c.f. Blum-Kulka, Reference Blum-Kulka1997), as in example (5) below (cf. example (1) in Methods).
(5)
CHILD: Mamma, skär! Du ska skära den!
‘Mummy, cut it! You must cut it!’
MOTHER: Oj, kan vi inte skära den i halver?
‘Oh, can't we cut it in two halves?’
Så här da. Va?
‘Like this. Okay?’
Ervin-Tripp et al. (Reference Ervin-Tripp, Guo and Lampert1990) also found that mothers seemed to comply more often with young children expressing distress or anger. Young children's urgent needs related to the activity thus generally receive a prompt response, sometimes dictated by pure instinct of preservation on the part of their parents, though sometimes including pedagogical comments on the behaviour.
For these same reasons, indirectness may be ‘costly and risky’ (as Thomas (Reference Thomas1995) puts it), especially within dinner talk. The results of the present study indicate that the children in family group 2, especially the ten- to eleven-year-olds, generally were less successful in receiving compliance from their parents and often responded with non-compliance to indirect parental regulation. According to pragmatic theory, the reason for using indirect requests may be the ambition to reduce imposition on the addressee, especially in case of a high risk of refusal (Levinson, Reference Levinson1987; Ervin-Tripp et al., Reference Ervin-Tripp, Guo and Lampert1990). At the family dinner table, the opposite seemed to be the case; that is, conventional indirectness was used in ‘low cost’ requests where compliance is either given or of less importance. Direct regulation, on the other hand, appeared in such joint activities within family life as meals that have to be carried out, sometimes against the children's intentions.
Refusal as a result of parental indirectness may also be explained by the special kinds of indirect expressions currently appearing in family discourse. Even though parents' direct regulation may sometimes be perceived as provocative in situations where indirectness would be felt to be more friendly, there are certain types of ‘aggravated’ parental indirectness which appear during the meals. Hints, for example, especially if accompanied by contradicting non-verbal expressions, may announce highly face-threatening irritation or even anger, as in example (6), where a father tries to stop his son's leaning over the dinner table:
(6)
FATHER: Om du visste vad söt du ser ut när du sitter så där!
‘If you knew how cute you look sitting like that!’
Such indirectness, which approaches irony or sarcasm, appears quite often in parent–child communication at the dinner table and regularly results in protests (Brumark, Reference Brumark2006b).
However, dinner conversations also serve important functions of socio-cultural and pragmatic socialization, at least in many Western cultures (Blum-Kulka, Reference Blum-Kulka1997). Family meals have even been indicated as one of the most important contexts of early development (Snow et al., Reference Snow, Perlmann, Gleason and Hooshyar1990). The findings of parental compliance with direct requests from younger children in group 1 and with indirect requests from teenagers in family group 2 of the present study are in accord with previous research, and might be regarded as parental adaptation to their children's age. On the other hand, parental non-observance of ‘polite’ regulation of ten- to eleven-year-olds in group 2 reflects the children's failed obedience to parental indirectness in this group, and conflicts with culturally conditioned rules of politeness. These observations of parents' and children's neglect of polite requests at the table may lead to the conclusion that family dinner talk is naturally direct and does not serve as an optimal context for pragmatic socialization of politeness rule systems (cf. Snow et al., Reference Snow, Perlmann, Gleason and Hooshyar1990).
One important reason for the amount of non-compliance among the children in family group 2 in the present study must, however, be noticed, namely the definition of compliance (obedience within 15 s) and the coding of negotiation as non-compliance, even in the few cases where negotiation eventually leads to compromises.
Furthermore, the parents' different strategies for handling their children's negotiation often determined any development toward compromise, continued conflict or one party's capitulation (cf. Brumark, Reference Brumark2008). In the following example, extracted from one of the recordings from group 1, the seven-year-old child has accepted selected parts of food she has never tasted before but she refuses to taste something else:
(7)
MOTHER: Ska du inte ha mer?
‘Don't you want any more?’
CHILD: (refuses)
Ja vet inte hur de smakar.
‘I don't know how it tastes.’
MOTHER: Nä de e ju klokt.
‘No that's wise.’
The mother's initiating indirect request probably constitutes the most common one to appear during family dinners. Despite the mother's apparent ambition to make the child eat and taste new dishes, she nevertheless seems to appreciate the child's hesitation – perhaps as a sign of growing autonomy – and accepts her reluctance to eat unfamiliar food.
This is, however, not the case for the child's refusal in example (8), where the father does not listen to any motivations from the ten-year-old child (although the second one would be quite reasonable from a health perspective). On the contrary, he tries by virtue of parental authority and direct prompts to make the child eat what is served:
(8)
FATHER: Ät hamburgaren!
‘Eat the hamburger!’
CHILD: Nej!
‘No!’
FATHER: Jo!
‘Yes!’
CHILD: Ja vill inte!
‘I don't want to!’
FATHER: Jamen du ska!
‘But you have to!’
CHILD: Nej ja gillar inte sånt! Ja gillar bara kött.
‘No, I don't like them! I only like steak.’
The child's non-compliance elicits a confrontation of standpoints that take the parties even further apart (cf. Brumark, Reference Brumark2008). While the mother–child dyad in example (7) shows a converging development through mutually constructed strategies, the father–child dyad instead diverges into their held positions throughout the sequence. Eventually, however, the conflict dissolves by the father's capitulation and promise that the mother will serve meatballs the next day. Example (8) represents a typical kind of negotiation, or rather conflict, triggered by fathers' direct regulators (cf. Brumark, Reference Brumark2006b). However, non-compliance and even rough conflicts may also be regarded as ways of furthering cooperation and the construction of mutually accepted terms of family life from a long-term perspective.