

INTRODUCTION
The extraordinary expansion of the US penal system has stimulated much research regarding mass incarceration’s causes and consequences. From the 1980s through the mid-2000s, criminal justice rhetoric, policy, and case outcomes shifted in a decidedly punitive direction across the country (Mauer Reference Mauer2006; Western Reference Western2006; Travis, Western and Redburn Reference Travis, Western and Redburn2014; Pew Charitable Trusts 2016; Kang-Brown et al. Reference Kang-Brown, Hinds, Heiss and Lu2018). The result was the creation of the largest incarcerated population the world has ever known (Gramlich Reference Gramlich2018). Developments since the mid-2000s have been more mixed. US incarceration rates peaked in 2007 and have fallen modestly since that time. In 2016, the US incarceration rate reached its lowest level in twenty years, though it was still remarkably high by international standards (Gramlich Reference Gramlich2018). This decline has been attributed to a number of factors, including the widespread adoption of state sentencing reforms aimed at reducing prison populations (Subramania and Moreno Reference Subramanian and Moreno2014; Beckett, Reosti, and Knaphus Reference Beckett, Reosti and Knaphus2016; Gramlich Reference Gramlich2018).
While recent developments have been applauded by reformers, research also reveals a more sobering pattern: the decline in imprisonment has been much smaller than the drop in crime rates. In fact, the index crime rate (which includes relatively serious crimes that are typically defined as felonies) fell more than twice as much as the imprisonment rate from 2007 to 2016 (24.3 versus 11.1 percent).Footnote 1 This gap between the magnitude of the crime drop and the (comparatively small) decline in incarceration does not appear to stem from a time lag between the commission of crimes and prison entry but, rather, from the intensification of the penal system’s response to crime and arrest (see also Beckett et al. Reference Beckett2018). In particular, the share of arrests that result in imprisonment has continued to climb since the mid-2000s (Beckett et al. Reference Beckett2018).
The fact that imprisonment is an increasingly common postarrest outcome is puzzling given the ubiquity of state legislative efforts to reduce prison populations. Recent studies identify one dynamic that may help to explain this paradox—namely, the increased use of prisons and jails in nonurban areas (Subramanian, Henrichson and Kang-Brown Reference Subramanian, Henrichson and Kang-Brown2015; Kang-Brown et al. Reference Kang-Brown, Hinds, Heiss and Lu2018; Oliver Reference Oliver2018). Growing reliance on confinement by rural and suburban authorities is substantively consequential, as it may help explain the persistence of mass incarceration and the intensification of the penal response to crime.
Evidence of variation in the use of prisons across urban and nonurban locales located in the same states is also theoretically significant as it may appear to suggest that the (informal) discretion of (local) frontline criminal justice actors, especially prosecutors, is more important than formal (state) sentencing law. Discussions of the role and importance of formal law and informal discretion play a prominent role in socio-legal analyses of punishment. On the one hand, the literature underscores the import of informal discretion and provides important insights regarding how local conditions shape its exercise (Lynch Reference Lynch1998, Reference Lynch2011, Reference Lynch2016; Johnson, Ulmer, and Kramer Reference Johnson, Ulmer and Kramer2008; Campbell and Schoenfeld Reference Campbell and Schoenfeld2013; Sutton Reference Sutton2013; Chen Reference Chen2014; Lynch and Omori Reference Lynch and Omori2014; Verma Reference Verma2016). This emphasis on discretion is consistent with sociolegal scholars claim that formal law’s institutional effects are powerfully shaped by the “street-level bureaucrats” who influence law’s meaning and effects though their everyday decision-making (Lipsky Reference Lipsky1980; Silbey and Sarat Reference Silbey and Sarat1987; Maynard-Moody and Musheno Reference Maynard-Moody and Musheno2003; Halliday et al. Reference Halliday, Burns, Hutton, McNeill and Tata2009). At the same time, studies show that the nature and effects of legal discretion can only be understood in relation to the legal rules that shape, limit, magnify, and/or constrain it (Sutton Reference Sutton2013; Lynch Reference Lynch2016; Verma Reference Verma2016; Beckett Reference Beckett2018). This suggests that the exercise of discretion and criminal sentencing law are best understood as dynamically interrelated rather than separate and distinct.
This latter framework suggests that any differences in the use of prison that may exist across rural, suburban, and urban areas are likely to be conditioned by state policy environments, which include the type of sentencing framework (that is, determinate versus indeterminate) that exists as well as the existence and nature of tough sentencing laws such as mandatory sentencing laws, weapons enhancements, and truth-in-sentencing (TIS) laws. Yet the idea that formal sentencing law and informal discretion are both consequential and dynamically interconnected has been (indirectly) challenged in recent years (Pfaff Reference Pfaff2017). Moreover, while many existing studies do highlight the interaction between formal law and informal discretion, most such studies examine how legal actors operating in the same system use legal tools in divergent ways (Sutton Reference Sutton2013; Chen Reference Chen2014; Lynch Reference Lynch2016). By contrast, the qualitative portion of this article employs a comparative case study approach that examines how sentencing laws create “statutory hammers” that empower zealous legal actors but can also how sentence maximums impose meaningful constraints that limit the incarcerative impact of the actions of those zealous actors (Lynch Reference Lynch2016).
This article has three main sections. First, we show that an exclusive focus on incarceration rates as a measure of punitiveness is misleading when crime rates are falling. Analysis of alternative measures of penal intensity that include information about crime trends shows that the penal response to crime has continued to intensify in recent years despite the widespread enactment of decarcerative statutory reforms. Next, we explore how the distribution of imprisonment in twenty-first-century America varies across urban, suburban, and rural counties. A number of studies show that jail and prison populations in rural areas have grown notably in recent years. The research presented here deepens our understanding of this trend by taking the distribution of crime into account, identifying where in the criminal justice process and for which types of offenses geographic differences exist and assessing whether contemporary patterns mark a break with the recent past. To accomplish these ends, we employ a decomposition-inspired analytic strategy often used to identify the drivers of the prison build-up (Blumstein and Beck Reference Blumstein and Beck1999; Western Reference Western2006; Raphael and Stoll Reference Raphael and Stoll2013; Travis, Western, and Redburn Reference Travis, Western and Redburn2014). The results not only deepen our empirical understanding of recent developments but also show that the increase in penal intensity we document is the result of heightened penalty in nonurban areas.
Our second section analyzes whether and how geographic differences in penal intensity are shaped by state policy environments. This portion of the analysis has two dimensions, one quantitative and one qualitative. To begin, we assess the degree to which penal intensity in rural, suburban, and urban counties varies across more and less punitive states. These findings show that, while penal intensity is greatest in rural counties, the state policy environment also has a pronounced effect on penal severity across rural, suburban, and urban counties. That is, while rural counties send more arrestees to prison than urban counties do, rural counties in highly punitive states send a notably greater share of their arrestees to prison than rural counties in states with lower incarceration rates. Finally, we provide two qualitative case studies of one highly punitive state (Kentucky) and one less punitive state (Washington) in order to deepen our understanding of how formal sentencing laws matter. These comparative case studies illuminate how state sentencing law can both enhance and constrain the power to punish and how they work in tandem with local dynamics to shape penal outcomes.
INCREASING PENAL SEVERITY IN THE “REFORM ERA”
US criminal justice developments since mass incarceration’s peak in 2007 have been difficult to interpret. While incarceration rates remain quite high by both historical and comparative standards, they have fallen by roughly 15 percent to reach their lowest level in twenty years (Gramlich Reference Gramlich2018). Although some commentators (for example, Gelb and Denny Reference Gelb and Denny2018) have treated the decline in the incarceration rate since 2007 as evidence that recently enacted statutory reforms are achieving their intended effects, reliance on incarceration rates alone as a measure of reform efficacy ignores the fact that crime rates have been plummeting for decades. In this context, comparatively small declines in incarceration rates may mask increases in the intensity of the criminal justice response to crime. More sophisticated measures of penal intensity therefore take crime rates into account when comparing variation in the use of punishment across place and time (Pew Charitable Trusts 2016).
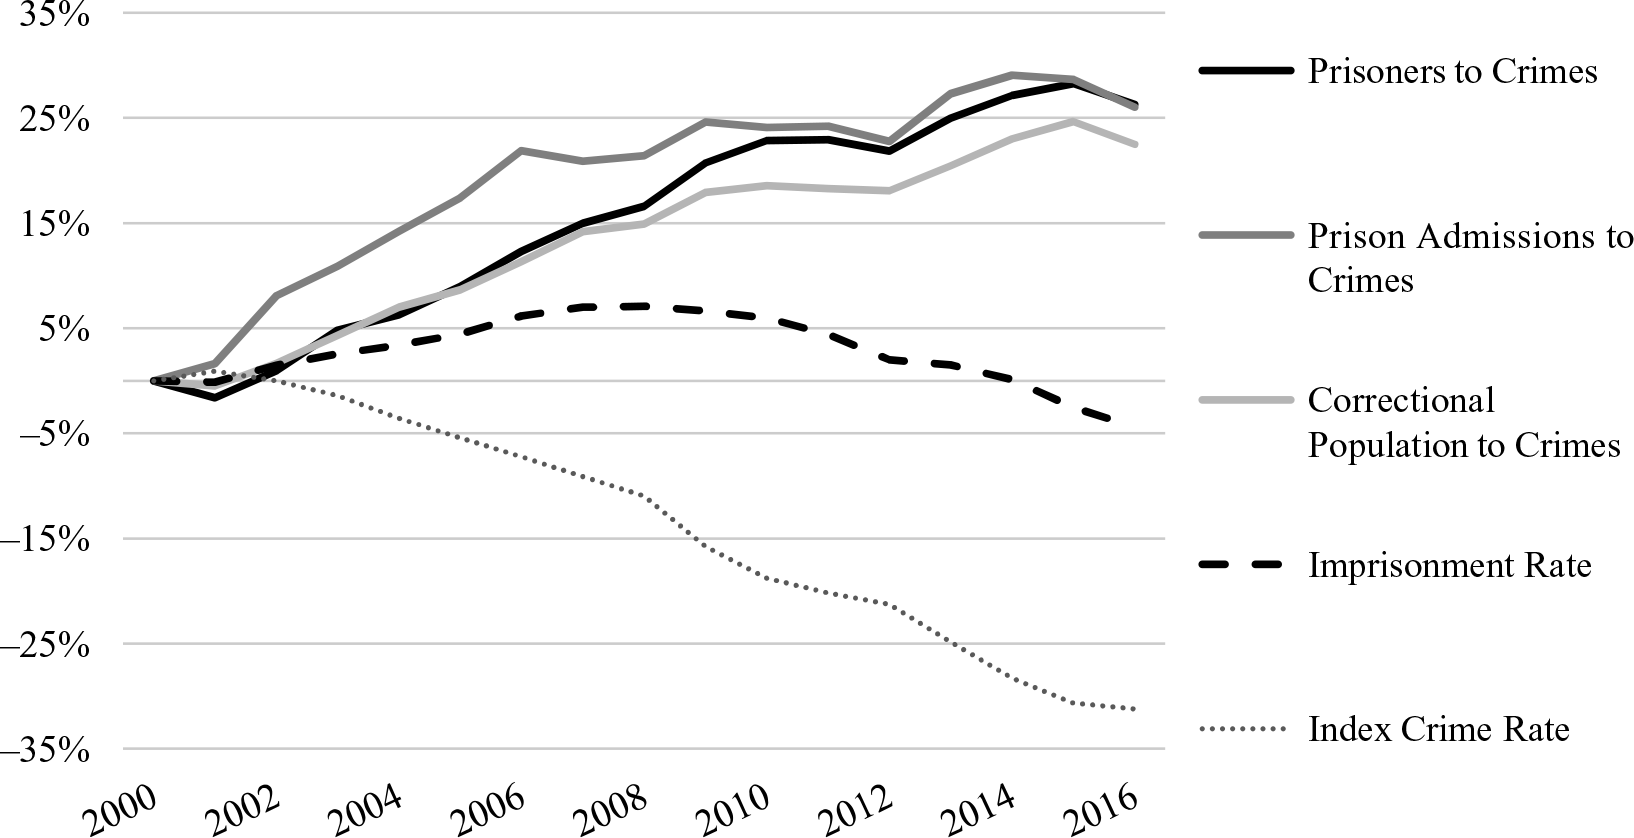
Toward this end, Figure 1 compares the cumulative change in the imprisonment rate since 2000 with three alternative measures of trends in penal intensity, all of which include information about crime. The first measure compares the number of prisoners to the number of index crimes (that is, felonies) known to the police. The second compares the number of new court commitments to prison to the number of index crimes. The third compares the number of people under any form of correctional supervision (including prison, jail, probation, or parole) to the number of index crimes. As Figure 1 makes evident, these alternative measures indicate that the penal response to crime continued to intensify notably after 2007, when incarceration rates peaked, through 2016. The focus on (modestly falling) incarceration rates since 2007 obscures this fact.
Change in U.S. Crime and Punishment Rates, 2000–2016.
Note: Here, prisoners include all new court commitments involving confinement sentences of one year or more under the custody of state and federal departments of correction. Crimes include the eight, Part I “index” crimes that are most likely to trigger a prison sentence.
Source: Authors’ analysis of Bureau of Justice Statistics, National Prisoner Statistics program data accessed through BJS’s Corrections Statistical Analysis Tool; Bureau of Justice Statistics, Correctional Populations in the United States 2015 and 2016, Table 1; and Federal Bureau of Investigations’ Uniform Crime Reports.

As noted previously, recent research shows that jails have expanded far more rapidly in small- and medium-sized counties than in large urban counties. In fact, a plurality of jail inmates (44 percent) is now incarcerated in small counties (Kang-Brown et al. Reference Kang-Brown, Hinds, Heiss and Lu2018; Subramanian, Henrichson and Kang-Brown Reference Subramanian, Henrichson and Kang-Brown2015). Similarly, it appears that prison admissions fell in large counties, but rose in small counties, in recent years (Keller and Pearce Reference Keller and Pearce2016; Kang-Brown et al. Reference Kang-Brown, Hinds, Heiss and Lu2018; Oliver Reference Oliver2018). These findings suggest that the impact of the embrace of the reform cause by many urban prosecutors may have been offset by the heightened commitment to the use of prisons in nonurban areas.
While these studies are suggestive, much remains unknown about the nature and extent of geographic variation in penal practices. For example, it is unclear whether this variation is new, if it persists once the distribution of crime is taken into account, and, if so, which kinds of offenses are treated differently across urban and nonurban areas. While some have speculated that geographic variation in the use of prisons stems mainly from a differential response to drug offenses in particular (Keller and Pearce Reference Keller and Pearce2016), ours is the first study of which we are aware to shed empirical light on this question. This study will also illuminate whether any differences in the use of prison stem from differences in the intensity/efficacy of policing or from postarrest decision-making processes.
The analyses presented here thus shed significant empirical light on the geography of punishment in twenty-first-century America. Our analysis also has important theoretical implications. Taken alone, evidence of substate variation in the use of prisons might be interpreted to mean that informal changes in institutional practice, and especially in the exercise of prosecutorial discretion, are more impactful than formal (state) law. This argument regarding the relative importance of informal discretion (and especially prosecutorial discretion) vis-à-vis statutory law has been most strongly advanced by John Pfaff (Reference Pfaff2017), who contends that shifts in sentencing policy did not cause an increase in time served and, therefore, did not contribute to mass incarceration. Instead, Pfaff argues, “the only thing that really grew over time was the rate at which prosecutors filed felony charges against arrestees” (72). Efforts to enact sentencing reform, he therefore claims, are misguided and will not have an appreciable impact on the scale of punishment in the United States. Implicit in Pfaff’s argument is the idea that the exercise of discretion and sentencing law is separate and distinct rather than interrelated.
This emphasis on informal decision-making over and above formal law is in some ways consistent with sociolegal scholarship, which shows that the exercise of legal discretion helps explain why “law in action” often bears little resemblance to “law in the books.” Indeed, research shows that discretion is ubiquitous throughout the criminal justice process. Scholars have long noted, for example, that prosecutorial discretion is enormously consequential: prosecutors significantly impact criminal justice outcomes by altering their charging practices or modifying their standards for plea bargains (Davis Reference Davis2008; Stuntz Reference Stuntz2011; Lynch Reference Lynch2016; Pfaff Reference Pfaff2017). Similarly, in states with indeterminate sentencing systems, parole boards exercise substantial discretion that notably impacts the amount of time inmates spend in prison (Gottshalk Reference Gottschalk2015; Ghandnoosh Reference Ghandnoosh2017).
In short, the often substantial gap between the “law on the books” and the “law in action” in the criminal legal context results in large part from the exercise of discretion by criminal justice actors (Lipsky Reference Lipsky1980; Silbey and Sarat Reference Silbey and Sarat1987; Halliday et al. Reference Halliday, Burns, Hutton, McNeill and Tata2009). Moreover, local norms and organizational practices powerfully shape discretionary decision-making and, hence, case outcomes (Johnson, Ulmer, and Kramer Reference Johnson, Ulmer and Kramer2008; Lynch and Omori Reference Lynch and Omori2014; Lynch Reference Lynch2016; Verma Reference Verma2016; Ulmer and Johnson Reference Ulmer and Johnson2017). For example, studies examining geographic variation in the implementation of California’s three-strikes law show that prosecutors align their actions with their local political and cultural climate (Bowers Reference Bowers2001; Zimring, Hawkins and Kamin Reference Zimring, Hawkins and Kamin2001; Sutton Reference Sutton2013; Chen Reference Chen2014), thereby mitigating the intended effects of that law in some counties. Similarly, Anjuli Verma’s (Reference Verma2016) analysis of local responses to the Brown v. Plata (2011) US Supreme Court decision (which mandated sizable reductions in the California state prison population) shows that the impact of formal law is mediated by a host of local factors and conditions, which in turn impact the degree to which Brown has resulted in decarceration in counties across the state.
While it is thus clear that the exercise of legal discretion is quite consequential in the criminal legal system and elsewhere, studies also indicate that local practices are powerfully influenced by the nature of the legal tools that are available to variously situated institutional actors. Mona Lynch’s (Reference Lynch2016) recent analysis of the prosecution of drug cases in the federal courts, for example, shows that, although the federal Sentencing Reform Act (1984) and other tough drug-sentencing laws were intended to prevent the arbitrary exercise of judicial discretion, these laws mainly shifted discretionary power to prosecutors, whose leverage in plea negotiations expanded dramatically and whose charging decisions acquired important implications for sentencing outcomes (see also Bazelon Reference Bazelon2019). This redistribution of the power to punish, in turn, had a number of important effects on prosecutorial filing practices, the power of the federal law enforcement apparatus, the capacity of federal defendants to assert their rights, the conviction rate, and sentencing outcomes across jurisdictions.
Research on California’s three-strikes law similarly shows that, although the impact of formal legal change varies across locales, such changes shift the balance of power in the courtroom and empower zealous legal actors. In California, for example, state courts sent more than eighty thousand second strikers and seventy-five hundred third strikers to prison between 1994 and 2004 (Brown and Jolivette Reference Brown and Jolivette2005). By the end of 2004, strikers made up more than one-quarter—26 percent—of the California prison population, and the fact that they were sentenced under the three-strikes law often added many years, and often decades, to their sentences (Brown and Jolivette Reference Brown and Jolivette2005). Although there is significant geographic variation in the invocation of the three-strikes law (Bowers Reference Bowers2001; Sutton Reference Sutton2013; Chen Reference Chen2014), it is clear that its enactment enhanced the scope and severity of punishment in California. Many prosecutors in other jurisdictions also have availed themselves of available “statutory hammers” where they exist (Lynch Reference Lynch2016). For example, the number of prisoners serving life-without-parole (LWOP) sentences has skyrocketed as states expanded their LWOP statutes and prosecutors increasingly seek such sentences (Nellis Reference Nellis2017; Mauer and Nellis Reference Mauer and Nellis2018).
In short, studies show that although some prosecutors in some jurisdictions tend to avoid triggering tough sentences, many others eagerly use “statutory hammers” where they are available (Lynch Reference Lynch2016). Moreover, harsh sentencing laws have important indirect effects, such as enhancing prosecutorial power and leverage, even if the majority of defendants do not receive the maximum allowable sentence (Lynch Reference Lynch2016). The research on TIS laws illustrates this point well: the mere existence of these laws increases sentences even when defendants plead guilty to lesser crimes that are not subject to TIS laws (Owens Reference Owens2011). Similarly, John Sutton (Reference Sutton2013) finds that California’s three-strikes law generally enhanced felony sentences, especially in conservative counties and for black defendants. Lynch’s analysis of courtroom dynamics illuminates why this is the case: even if prosecutors refrain from charging defendants under harsh sentencing statutes, the existence of those statutes enhances prosecutorial power in plea negotiations, which yields longer average sentences.
In short, while sociolegal scholars rightly emphasize the importance of informal discretion, studies also indicate that sentencing law profoundly influences the distribution of power in the courtroom and, often, the intensity of the penal response to crime. While prosecutors, judges, and other legal actors may respond differently to legal changes across localities, the creation of “statutory hammers” not only provides powerful tools to zealous prosecutors and judges, but also alters the balance of power and influences outcomes even when local legal cultures are characterized by some restraint (Lynch Reference Lynch2016). In other jurisdictions, prosecutors and judges readily invoke tough sentencing laws to impose the harshest penalties possible.
This literature generally examines how sentencing laws—especially “statutory hammers”—are employed differently by diverse actors within a single system and suggests that law and the informal exercise of discretion are best understood as dynamically interconnected rather than as separate and distinct. Our comparative case studies of a more and less punitive state enable us to analyze how both statutory hammers as well as statutory maximums shape the distribution of the power to punish and penal outcomes.
DATA AND METHODS
The quantitative analysis presented below is designed to compare criminal case processing outcomes in rural, suburban, and urban counties across the states. We also sought to assess whether geographic variation in penal intensity is a relatively new development, whether it varies by offense type, and where in the criminal justice process differences exist. To accomplish these goals, we constructed and analyzed an original county-level dataset, which also informed the selection of our cases for the qualitative component of the study.
Data
Our analyses identify local variation in admissions to state prisons, where the majority of US inmates reside.Footnote 2 The starting point for our analyses was the “iron law of prison populations” (Clear and Austin Reference Clear and Austin2009), which holds that imprisonment rates are a function of two factors: prison admissions and the amount of time people spend in prison. Because many felony convictions result in a sentence of probation or jail time rather than a prison admission, the proportion of felony arrests that result in a prison sentence is widely treated as an indicator of penal intensity. Given our interest in local, county-level differences in the use of prisons, we focused on prison admissions over which county officials have influence—that is, admissions stemming from the commission of felony offenses or violations of probation sentences. Admissions stemming from technical parole violations are determined by state correctional authorities and are therefore not included in our analyses (see also Blumstein and Beck Reference Blumstein and Beck1999; Raphael and Stoll Reference Raphael and Stoll2013; Travis, Western, and Redburn Reference Travis, Western and Redburn2014). We included prison admissions involving persons sentenced to twelve months or more of confinement time, most, but not all, of whom serve these sentences in state prison.Footnote 3
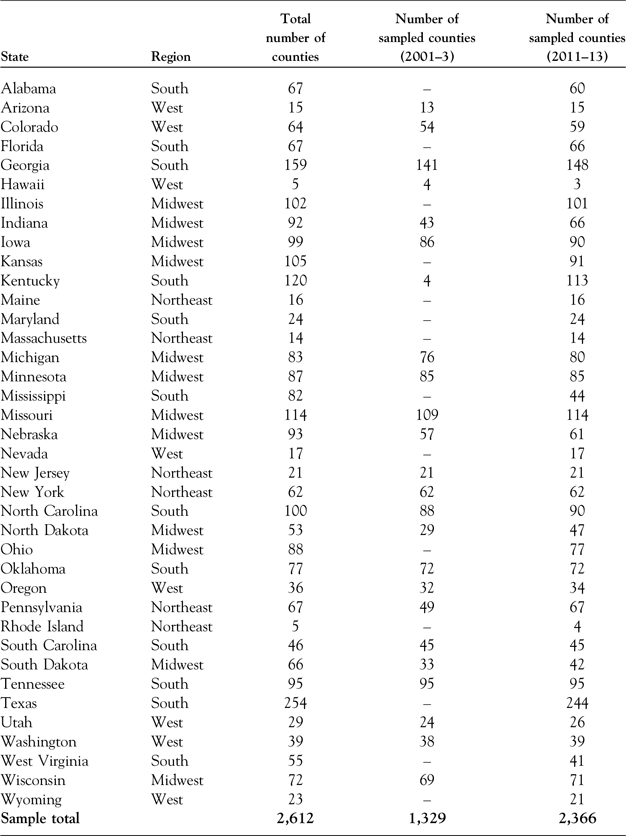
Data pertaining to prison admissions were taken from the National Corrections Reporting Program (NCRP). The NCRP provides individual-level, administrative data collected by the Bureau of Justice Statistics that include offense type, length of sentence imposed, county of sentencing, type of admission, and type of release. The collection began in 1983 and is available through the Inter-University Consortium for Political and Social Research at the University of Michigan. The NCRP data are available for counties in thirty-eight states from 2011 to 2013 but for notably fewer states in 2014. In order to ensure a larger and more inclusive sample, we used average prison admission rates from 2011 to 2013 as a window onto recent dynamics. We also analyzed the NCRP data from 2001 to 2003 in order to ascertain whether the patterns observed in the most recent period mark a break with the recent past. For these earlier years, the NCRP data are available for counties in twenty-one states (see Appendix 1).
We used the detailed categorization scheme from the Center for Disease Control and Prevention’s National Center for Health Statistics (NCHS) to identify urban, suburban, and rural counties (Ingram and Franco Reference Ingram and Franco2014). The NCHS’s categorization scheme includes total population and density measures as well as information about counties’ metropolitan/nonmetropolitan status, the size of the surrounding metropolitan or micropolitan statistical area and demographic and socioeconomic information. Although large, central metropolitan (that is, urban) counties and large, fringe metropolitan (suburban) counties may have similar population sizes, the social characteristics of these counties differ significantly (4). We therefore included large, central metropolitan counties in our urban category and classified large fringe, medium, and small metropolitan counties as suburban. Micropolitan and noncore (that is, rural) counties have smaller population centers and are neither economically nor socially connected to larger metropolitan areas.
Crime and arrest data are taken from the Federal Bureau of Investigation’s Uniform Crime Reports (UCR) for 2000–2 and 2010–12 in order to create a one-year lag vis-à-vis prison admissions.Footnote 4 These data are aggregated by the National Archive of Criminal Justice Data to the county level. UCR data identify eight Part I “index crimes” that are felony offenses. We included these comparatively serious index crimes, all of which have the potential to trigger prison admission. We also analyzed data for all drug arrests other than marijuana possession (because marijuana possession arrests rarely result in prison admission)Footnote 5 as well as weapons violations, which can also trigger felony charges. Crime rates were calculated as the number of crimes known to the police per one hundred thousand residents.
The majority of counties now report data to the UCR. For example, in 2012, the law enforcement agencies participating in the UCR program represented more than 270 million US inhabitants, which is 85.4 percent of the total population. To ensure the quality and reliability of UCR data, counties with fully imputed data, and/or where the difference in sampled populations between offense and arrest data was greater than 10 percent, were dropped from the analysis. Our sample for the more recent time period includes 2,366 counties (84 percent of all US counties): 50 urban, 837 suburban, and 1,479 rural. The thirty-eight states in which these counties are located are regionally diverse and highly varied in terms of population size and density. Our sample for the earlier time period includes 1,329 counties—26 urban, 449 suburban, and 854 rural—in twenty-four states, which is a total of 42.3 percent of all US counties. For both time periods, the sample includes counties in states located in all regions, of varying sizes and levels of urbanization and with quite different population demographics.Footnote 6 The states and number of counties included in each sample are listed in Appendix 2.
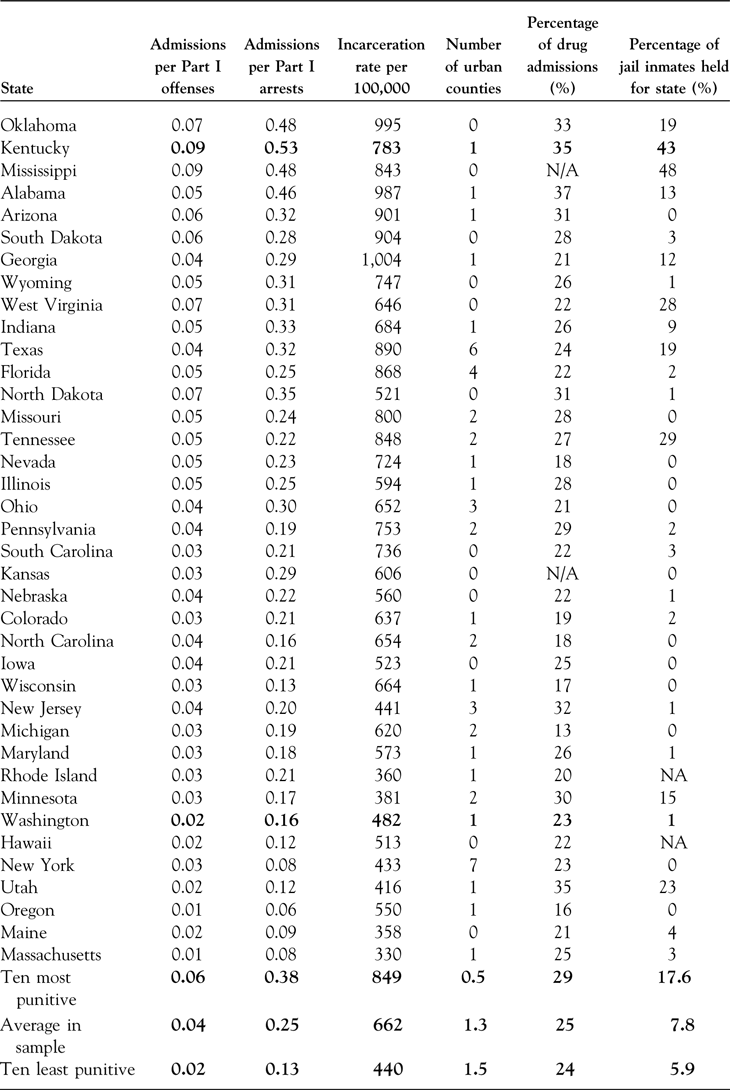
To identify the ten most and least punitive states in our sample for the latter time period, we analyzed the data described above as well as state incarceration rates, then ranked each state by each of three measures of penal intensity: the punishment rate (that is, the ratio of prison admissions to Part I offenses known to the police); the ratio of prison admissions to Part I and drug arrests; and the state incarceration rate. We then combined each state’s rankings and identified the ten most and ten least punitive states of the thirty-eight states included in the sample. Table 1 provides detailed information about these measures and other relevant characteristics for each of the states included in this sample.
Indicators of penal intensity and other state characteristics, 2011–13

Sources: Admissions ratios are based on the authors’ analysis of NCRP and UCR data. Urban counties in states included in the sample were identified using the NCHS categories described in the data and methods section. Incarceration rate data were taken from Wagner and Walch Reference Wagner and Walch2016. Information regarding the share of jail inmates who were under state jurisdiction but housed in local jails in 2013 was taken from Aiken Reference Aiken2017, Table 2.
Notes: The states are listed in the order of their ranking on our combined punitiveness index, with the most punitive states shown at the top. Prison admissions involving inmates with confinement sentences of twelve or more months stemming from new convictions/court commitments and from probation violations are included. Crime and arrest data include the eight Part I “index” crimes that are most likely to trigger a prison sentence. NA in the “percent of jail inmates held for state prisons” column indicates that the state has a combined state jail/prison system.
We then selected one state from each of the most and least punitive states for further exploration. Selection of these states was guided by a number of factors, including the reliability and availability of the NCRP and UCR data across each of the three years examined; the availability of secondary sources about criminal justice developments in that state; the presence of at least one large urban county in the state; and the existence of geographic differences in penal intensity that mirrored the national pattern. Using these criteria, we selected Kentucky and Washington, which are bolded in Table 1, for comparison.
Analytic Strategy and Methods
To assess geographic differences in penal intensity, we compared several case processing outcomes across rural, suburban, and urban counties. Specifically, we calculated the punishment rate—the ratio of prison admissions to index crimes—to generate a broad measure of the strength of the penal response to crime. We also calculated two more specific outcomes to identify where in the decision-making process geographic differences exist: arrest-to-crime ratios and prison admission-to-arrest ratios (Blumstein and Beck Reference Blumstein and Beck1999; Western Reference Western2006; Raphael and Stoll Reference Raphael and Stoll2013; Travis, Western, and Redburn Reference Travis, Western and Redburn2014). Comparatively high arrest-to-crime ratios indicate that a larger share of reported felony crimes result in an arrest. Relatively high prison admission-to-arrest ratios indicate that felony arrests are comparatively likely to trigger prison admission.
To identify and develop our case studies, we conducted comprehensive database searches to identify a wide range of relevant documents, including technical reports, newspaper accounts, law review articles, memoranda, and more. We also accessed data from the Vera Institute of Justice’s Incarceration Trends project and data tool,Footnote 7 which enabled us to document trends in both jail and prison populations at the county level within each state. In the case of Kentucky, we relied on recent work by the Vera Institute of Justice and affiliated scholars to understand recent developments in rural counties. In the case of Washington, we were able to access memoranda and reports that shed light on developments in the state’s only urban jurisdiction, King County. While these states are not necessarily typical of others in the most and least punitive categories, they provide an opportunity to develop a narrative account of changes in penal practice and incarceration trends, to qualitatively explore how and why urban and non-urban counties have responded differently to those developments, and to analyze how those responses are shaped by the larger statutory environment.
FINDINGS
Penal Intensity in Urban, Suburban, and Rural Counties
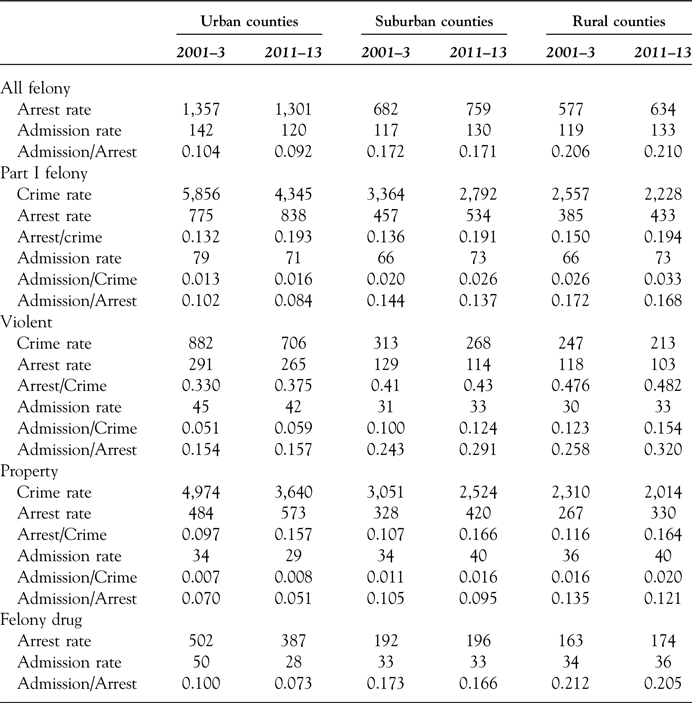
Table 2 provides detailed information about crime and punishment rates across urban, suburban, and rural counties for each offense category. Table 2 also includes data from 2001–3 in order to assess whether geographic variation in penal intensity in 2011–13 marks a change from the recent past. Unsurprisingly, crime and arrest rates are notably higher in urban counties than in suburban and rural counties. These differences are not small. For example, the average urban violent crime rate is more than twice as high as the violent crime rate in suburban counties and more than triple the violent crime rate in rural counties. Differences in property crime rates are similar in direction but somewhat smaller in magnitude; drug arrest rates are also far higher in urban versus non-urban counties. Although crime rates are notably higher in urban counties than in non-urban ones, prison admission rates are now higher in the latter. This finding reflects the fact that the punishment rate—the ratio of prison admissions to crimes—is substantially higher in suburban and especially rural counties.
Change in crime rate and criminal justice case processing outcomes in urban, suburban, and rural US counties, 2001–3 and 2011–13

Sources: Authors’ analysis of NCRP and UCR data.
Note: Part I crimes include the eight “index” crimes that are most likely to trigger a prison sentence. Drug arrests include arrests for all narcotics violations other than marijuana possession. Felony arrests include arrests for Part I crimes as well as for drug law violations (other than marijuana possession) and weapons violations. Prison admissions include admissions of inmates with confinement sentences of twelve or more months stemming from new convictions and those resulting from probation violations. Rates shown here are means for counties included in the urban, suburban, and rural categories; ratios are internal to the table.
In the more recent period, this geographic differences in the use of prisons stems entirely from variation in the likelihood of imprisonment given arrest rather than in differences in the efficacy of policing. In fact, the ratio of felony arrests-to-index crimes was nearly identical across rural, suburban, and urban counties in 2011–13.Footnote 8 Interestingly, greater penal intensity in non-urban counties does not stem solely from divergent responses to drug law violations, as some have speculated (Keller and Pearce Reference Keller and Pearce2016). Instead, the detailed findings shown in Table 2 indicate that the admission-to-arrest ratio is notably higher in non-urban counties for all offense types. For example, in the recent time period, the rural admission-to-arrest ratio is two times higher for violent crimes, 2.4 times higher for property crimes, and 2.8 times higher for drug offenses than those found in large urban counties. Differences in the use of prisons across counties thus appear to be widespread rather than offense specific.
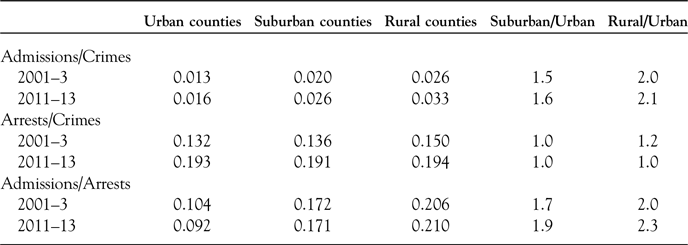
Table 3 shows that differences in the use of prisons across urban and non-urban counties have grown in recent years. For example, in the early 2000s, the admission-to-arrest ratio in rural counties was 1.9 times higher than in urban counties. In the later period, the admission-to-arrest ratio was 2.3 times higher in rural counties than in urban ones. The difference between the admission-to-arrest ratios observed in urban and suburban counties also increased during this time. The growth of these geographic differences stems mainly from decline in the admission-to-arrest in urban counties and a small increase in this ratio in rural counties.
Summary comparison of punishment rate (admission to crime), arrest-to-crime ratio, and admission-to-crime ratio by county type, 2001–3 and 2011–13

Sources: Authors’ analysis of NCRP and UCR data.
Note: The punishment rate is measured as the ratio of the number of prison admissions involving inmates with confinement sentences of twelve or more months stemming from new convictions/court commitments and or probation violations to the number of Part I “index” crimes. Arrests in the arrest-to-crime ratio include only arrests for Part I crimes in order to ensure comparability. Arrests in the admission-to-arrest ratio also include drug arrests (other than marijuana possession) and weapons arrests.
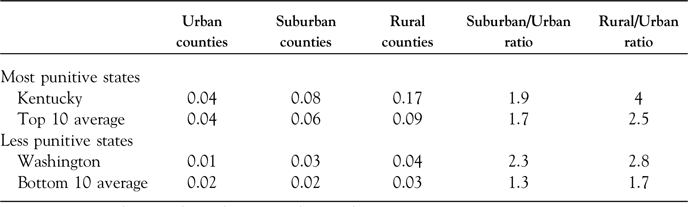
Taken alone, this evidence of variation in the use of prisons across urban and non-urban counties might be interpreted to mean that informal discretion on the part of local actors is more consequential than state sentencing law. However, when punishment rates in urban and nonurban counties located in more and less punitive states are compared, the findings indicate that penal outcomes are associated with both the state policy environment and the urbanness of the county (see Table 4). Overall, the punishment rate in urban counties located in more punitive states is, on average, twice as high as the punishment rate in urban counties in less punitive states. Similarly, the average punishment rates found in suburban and rural counties in more punitive states are three times higher than those found in less punitive states.
Punishment rates (prison admission-to-crime ratio) in urban, suburban, and rural counties in most and less punitive states, 2011–13

Sources: Authors’ analysis of NCRP and UCR data.
Notes: Prison admissions involving inmates with confinement sentences of twelve or more months stemming from new convictions/court commitments and from probation violations are included here. Crimes include the eight, Part I “index” crimes that are most likely to trigger a prison sentence. The geography of punishment in Maryland is excluded from the calculation of the averages in the ten least punitive states because it is an outlier.
In sum, while rural counties are more punitive than urban counties in all but four of the thirty-eight states in our sample, the use of prisons across rural, suburban, and urban counties also varies a great deal.Footnote 9 In fact, urban counties located in more punitive states boast higher punishment rates than rural counties in less punitive states. These findings suggest that both county type and state policy environments have an important impact on the use of prisons across the United States. In the following section, we draw on two qualitative case studies to illuminate how local conditions and state policy environments interact to shape the use of prisons across urban and nonurban counties.
COMPARATIVE CASE STUDIES
As noted in the data and methods section, our two case studies were selected from the ten most and least punitive states in our thirty-eight-state sample. Table 1 shows that these two groups of states differ not only in terms of penal intensity but also with respect to their urbanness, the share of prison admissions that are triggered by drug offenses, and the proportion of people in local jails being held for state correctional authorities due to capacity constraints in state prisons. In the ten most punitive states, an average of 18 percent of all of those confined in jails are serving more than one year of confinement and are being held for state authorities; in the ten least punitive states, just 6 percent of all jail inmates are being held for state authorities. As we will discuss below, this latter metric is relevant because some rural counties now see the jailing of state prisoners as an important source of revenue. This dynamic, and many others that also help explain rising incarceration levels in Kentucky, is explored below.
Kentucky
The embrace of tough sentencing laws began early in Kentucky in 1974, when the state legislature enacted the Persistent Offender Felony Act (1974). Like other “persistent offender” statutes, this law notably enhanced the sentences of defendants who had been convicted of two or more felonies (Wilson Reference Wilson1985). Subsequent analysis in 1985 found that the most serious offense of three-fourths (74 percent) of those sentenced under the Persistent Felony Offender Act was a property crime. This statutory hammer thus included, and was not limited to, cases involving violence. Interestingly, 61 percent of those who had been sentenced under this tough statutory provision were convicted in two of Kentucky’s largest counties (Jefferson and Fayette counties) out of a total of 120 counties (iv).Footnote 10 In the 1970s, then, it was urban prosecutors in Kentucky who were more inclined to employ this new “statutory hammer” and people convicted of property as well as violent crimes who felt its weight.
The use of the Persistent Felony Offender Act subsequently accelerated, and analysts have since concluded that Kentucky’s repeat offender law is among the broadest and most severe in the country, contributing importantly to the dramatic expansion of the prison population in recent decades (Robinson 2015). In 1998, the Kentucky legislature enacted the Parole for Violent Offenders Act (1998), a TIS law that requires defendants convicted under forty-three different statutes to serve a mandatory minimum of 85 percent of their maximum sentence. (Previously, prisoners convicted under these statutes became eligible for parole after serving 50 percent of their sentence or twelve years (Kentucky Department of Public Advocacy 2017). The legislature also enacted a number of other strict sentencing laws, including, for example, a “drug free school zone” provision that enhanced sentences for those convicted of selling drugs within one thousand yards of a school and a range of weapons enhancements (Pew Public Safety Performance Project 2011). More generally, the Kentucky state legislature enacted a myriad of statutes that identified new crimes and expanded penalties. Because the new legislation was layered onto, rather than integrated into, the existing penal code, overlapping layers were created (Robinson 2015). These overlapping statutes enhanced prosecutorial power and encouraged overcharging:
When a criminal code has many overlapping offenses, it creates discretion and power in prosecutors to decide for themselves which of the different offenses will be charged and punished, or whether they should all be. Again, this undermines the proper allocation of the criminalization authority of the legislature and invites unjustified disparity in similar cases depending upon a defendant’s good or bad luck in the prosecutor that they draw. It also invites over-punishment where overlapping offenses punish the same harm or evil. (176)
These statutory changes and associated shifts in informal practice—rather than crime trends—clearly fueled the expansion of prison and jail populations in Kentucky (Kentucky Criminal Justice Council 2003; Pew Public Safety Performance Project 2011). Between 1985 and 2015, total and violent crime rates fell by 19 and 28 percent, respectively. By contrast, the imprisonment rate grew by 271 percent (Kentucky Department of Public Advocacy 2017, 14), and the jail incarceration rate (not including people held in jail for state authorities) roughly doubled (Prison Policy Initiative, n.d.). If people who were sentenced to more than one year in state prison but were confined in local jails are included in the jail count, the data show that the jail incarceration rate increased more than fivefold.Footnote 11
While penal expansion began to slow in the 2000s in some states, prison and jail populations continued to explode in Kentucky. In fact, in the decade ending in 2009, Kentucky had one of the fastest-growing prison populations in the country, increasing by 45 percent compared to a national increase of 13 percent (Pew Public Safety Performance Project 2011). Alarmed by this trend and associated fiscal costs, the Kentucky General Assembly established the Task Force on the Penal Code and Controlled Substances Act (2010), which requested and received the technical assistance from the Pew Center on the States (Pew Public Safety Performance Project 2011). According to the analysis of the Pew Center on the States, a number of recent trends fueled the continued growth of prison and jail populations, including rising arrests and case filings, many of which involved drug offenses (3). The share of felony convictions that resulted in a confinement sentence of one year or more also remained high (59 percent in Kentucky versus 41 percent nationally) (4). Long sentences and an increase in the re-incarceration of technical parole violators also fueled the growth of Kentucky’s prison population throughout this period (4).
Based on the recommendations of the task force, the Kentucky State legislature enacted the Public Safety and Offender Accountability Act (2011) in an attempt to reverse rising incarceration rates. Toward this end, the act seeks to better distinguish between drug trafficking and possession and to reduce maximum penalties for the latter, prevents some drug possession convictions from triggering the Persistent Felony Offender Act, and revises the drug-free school zone sentencing provision to cover offenses that occurred within one thousand feet (rather than one thousand yards) of a school building.
These (quite modest) changes to the sentencing framework are mainly limited to drug offenses, especially drug possession, but were nonetheless projected to have a notable impact on the correctional population in Kentucky. Specifically, the Office of State Budget Director estimates that the reforms will reduce the prison population by three thousand people and produce savings of $422 million over ten years. Recent developments cast doubt on the accuracy of these predictions. Throughout the 2010s, Kentucky prison and jail populations have continued to grow steadily.Footnote 12 In fact, according to the Vera Institute of Justice, the total incarceration rate per one hundred thousand Kentucky residents aged fifteen to sixty-four increased from 972 in 2000 to 1,409 in 2015. If incarceration rates continue to grow as they have since 2000, the entire state population will be incarcerated in 113 years (Kang-Brown et al. Reference Kang-Brown, Hinds, Heiss and Lu2018).
However, this incarceration boom is not evenly distributed across the state. Our data show that the punishment rate is more than four times higher in rural counties than in large urban areas in Kentucky (see Table 4). Moreover, the rural punishment rate nearly doubled between 2001–3 and 2011–13. It thus appears that penal expansion in Kentucky is driven mainly by rural (and suburban) counties. A number of factors help explain the continued expansion of incarcerated populations, particularly in rural areas, despite the enactment of statutory reforms in 2011. First, as noted previously, those reforms overwhelmingly focused on drug offenses and, specifically, on drug possession. This is unsurprising as mainstream reform advocates who form bipartisan coalitions tend to limit the case for reform to people convicted of nonviolent crimes, especially drug offenses (Beckett, Reosti, and Knaphus Reference Beckett, Reosti and Knaphus2016; Seeds Reference Seeds2016) or to “non, non, nons,” which stands for nonserious, nonrepeat, and nonviolent offenders (Gottshalk Reference Gottschalk2015). While recent statutory reforms did modestly reduce penalties for drug possession, they did not do so for drug sales in most cases. Because far more prisoners are locked up for selling, rather than possessing, drugs, reforms aimed solely at the latter have little impact on the rates of imprisonment.Footnote 13
Perhaps it is unsurprising then that the share of people under the correctional authority of the Kentucky Department of Corrections whose most serious offense was a drug charge continued to increase through 2017. Moreover, it appears that the schism between rural and urban Kentucky’s response to drug arrests may be growing (Wolfson Reference Wolfson2016). Probation officers in rural counties regularly send probationers who are unable to comply with the requirements of abstinence-oriented treatment programs back to prison. Moreover, prosecutors in rural counties generally do not utilize the deferred prosecution option authorized by the 2011 reform and request—and often obtain—sentences for drug offenses that would be considered “extremely harsh and not just” in urban Louisville (Wolfson Reference Wolfson2016).
In short, the vast majority of statutory hammers still exist in Kentucky and are eagerly used by legal actors, particularly those located in nonurban areas. Recent work by researchers at the Vera Institute of Justice identifies an important dynamic that helps explain why these statutory hammers are so widely used, especially in rural Kentucky (Norton and Schept, Reference Norton and Scheptn.d.). According to this account, the decline of coal-related jobs and revenues began after 1990 but dropped precipitously after 2010. In fact, Eastern Kentucky lost 73 percent of its coal jobs between 2011 and 2018; declining coal production has also meant a loss of coal revenues for rural counties. In this context, the number of people sentenced to more than one year in state prison who are being held in county jails continued to rise.
While the policies that allow state authorities to house prisoners in county jails are not new, it appears that economic devastation has intensified the incentive for rural Kentucky counties to construct and fill jails with state prisoners in order to collect state subsidies. As of 2016, the average daily cost of incarceration in a Kentucky state prison was $66.82 per day; the state pays counties less than half of that amount—$31.34—to hold state prisoners in county jails. In many rural counties, particularly those devastated by the decline of coal, the jail incarceration rate has grown exponentially. For example, in Harlan County in southeastern Kentucky, the jail incarceration rate increased by 1,500 percent between 1978 and 2015, from seventy to 1,120 per one hundred thousand residents. As Jack Norton and Judah Schept (Reference Norton and Scheptn.d.) conclude, “despite the disturbing implications of this growth rate, federal and county-level policymakers continue to promote incarceration as economic development, more deeply aligning county and state officials with ever-increasing incarceration.” The modest statutory reforms enacted by Kentucky state legislators in 2011 did not meaningfully reduce the available statutory hammers or alter the financial situation and incentive structure that appears to be fueling prison/jail expansion in rural Kentucky. It is important to note, however, that not all rural counties have an economic incentive to be tough on crime in order to recoup state subsidies for jailing state prisoners. In Washington State, for example, where state prisons are less crowded, just 1 percent of the jailed are being held for state authorities (see Table 1). Even in states in which few or no state prisoners are held in local jails, rural counties tend to be characterized by higher punishment rates than those found in urban counties, and the punishment rate in such counties has increased notably in most cases.
In sum, most of the statutory hammers created by the Kentucky legislature in previous decades remain on the books and are eagerly utilized by legal actors who are motivated—and incentivized—to do so. While some reforms have been enacted, none make a significant dent in the power of prosecutors and judges to seek and impose long sentences in cases involving violent, property, or drug distribution offenses where they are motivated to do so.
Washington State
Although quite high by international standards, Washington’s incarceration rate is among the lowest in the United States (see Table 1).Footnote 14 Washington’s comparatively low incarceration rate is often attributed to its adoption of a determinate sentencing framework in 1984 (Boerner and Lieb Reference Boerner and Lieb2001). However, the predictability and proportionality this framework was intended to create were undermined by the creation of a number of statutory hammers in the 1990s. While use of these statutory hammers helps explain both overall prison growth and the proliferation of long and life sentences in Washington, these tools pertain mainly to serious, violent crimes. Unlike Kentucky, Washington has not enhanced (or has repealed enhancements of) sentences for most property and drug crimes. The result has been a steady rise in the prison population, driven not only by the imposition of long and life sentences in cases involving violence but also, unlike Kentucky, by comparatively low levels of incarceration for property and drug offenders.
The policy structure that governs criminal sentencing in Washington State underwent dramatic revision in the 1980s. The Sentencing Reform Act (1984) deemphasized rehabilitation as a penal goal and, instead, elevated “just desserts” and incapacitation as the primary goals of sentencing policy (Boerner and Lieb Reference Boerner and Lieb2001). Consistent with this demotion of rehabilitation, the legislature largely abolished parole. While this legislation did not initially increase sentence length, the legislature subsequently enacted a myriad of statutes (some of which originated as ballot initiatives) that did just that.
In the early years, some of these changes did pertain to drug offenses. In 1987 and 1989, for example, the legislature restricted access to the Drug Offender Sentencing Alternative program and increased the offense seriousness of a number of drug violations, thereby increasing the sentences imposed on people convicted of these offenses (Boerner Reference Boerner1993). Other legislative reforms resulted in the imposition of longer prison terms, particularly for those convicted of multiple and/or serious offenses or who possessed a weapon at the time of their crime. In 1993, for example, Washington became the first state in the nation to adopt a “three-strikes” law under which courts must sentence “persistent offenders” to life in prison without the possibility of parole (Columbia Legal Services, n.d.). However, Washington’s “three-strikes” law is limited to cases involving multiple violent offenses. In 1995, Washington voters approved Initiative 159, paving the way for the Hard Time for Armed Crime Act, which requires that people convicted of a felony committed while armed receive a sentence enhancement. And, in 2003, the state legislature passed Engrossed Substitute Senate Bill 5990 (2003), which reduced the capacity of most prisoners, especially those who were convicted of violent crimes, to reduce their sentence by earning good time credits in prison (Drake, Barniski, and Aos Reference Drake, Barnoski and Aos2009). The cumulative effect of these changes was the creation of a system in which many more defendants convicted of violent crimes receive long and life sentences but relatively few such prisoners have the opportunity to earn time off of their sentence or demonstrate evidence of their maturation to a parole board.
As was true in many other states, a dramatic rise in drug arrests and felony drug filings also fueled the growth of the prison population in the 1980s and 1990s. Between 1985 and 2006, the number of drug arrests in the state increased more than fourfold (from 5,346 to 29,580).Footnote 15 However, reform of the drug-sentencing grid (pertaining to both possession and delivery cases) in the early 2000s removed many previously existing “statutory hammers” that enabled legal actors to throw the book at people arrested on drug charges (Boerner Reference Boerner2012). Penalties for property offenses are also notably less severe than in Kentucky, and the sentencing system places meaningful constraints on the capacity of judges to exceed recommended sentencing ranges. In Washington, standard sentencing range for a person convicted of burglary in the first degree who has no prior convictions is fifteen to twenty months; the maximum sentence in cases involving defendants with the most extensive criminal histories is 116 months (just over ten years) (Washington State Caseload Forecast Council 2018). By contrast, the minimum sentence for this offense in Kentucky is ten years, while the maximum is fifty years.Footnote 16
In short, in Washington, the available statutory hammers are mainly limited to people convicted of multiple serious and/or violent offenses; sentences for people convicted of drug and property crimes are comparatively moderate and constrained by the sentencing guidelines. These statutory differences help to explain the fact that comparatively few Washington prisoners are behind bars as a result of a drug or property crime conviction.Footnote 17 At the same time, the state did experience an influx of people convicted of drug law violations in previous decades, as a result of aggressive drug law enforcement and the increase in penalties in effect between the late 1980s and early 2000s. In the 1980s and 1990s, the number of narcotics arrests in urban King County rose dramatically from 1,177 to 7,457, a roughly sixfold increase. This expansion of the urban drug war was supported and enabled by then Prosecuting Attorney Norm Maleng, who implemented a comprehensive drug program in 1986, secured significant additional resources for a Special Drug Unit in the prosecutor’s office, and pushed for changes to the state’s drug sentencing grid that notably increased penalties for drug offenses for more than a decade (Boland and Healey Reference Boland and Healey1993).
Largely as a result of Maleng’s initiatives, Washington State’s war on drugs was initially a disproportionately urban affair. For example, the share of the state’s drug arrests that took place in King County increased from 22 percent in 1985 to 34 percent in the year 2000. The practices adopted by the prosecutor’s office exacerbated the effect of this aggressive law enforcement approach. In 2001, “King County was the outlier, convicting a far higher percentage of drug offenders of dealing offenses, who thus received prison sentences, than did the other counties (Boerner Reference Boerner2012, 202).
King County remained an outlier a decade later but in the opposite direction (Boerner Reference Boerner2012). This is because the number of drug arrests declined significantly after 2006, and while the number of drug arrests in other Washington counties has also fallen a bit, the drop has been far steeper in King County. In 2000, more than one-third (33.9 percent) of the state’s drug arrests emanated in King County; in 2015, that figure was 15.8 percent. Felony drug convictions declined even more dramatically than arrests in King County, and, on a per capita basis, they are now far lower than anywhere else in the state (Boerner Reference Boerner2012, Table 6).
This dramatic shift in drug enforcement policy in King County reflects a series of decisions made by Prosecuting Attorney Dan Satterberg, who assumed office in the early 2000s and faced unprecedented budget cuts in 2008:
Satterberg managed the reduction in prosecutorial resources not by across-the-board cuts but by reordering his priorities. Many less serious drug cases that earlier would have been prosecuted as felonies were classified as “expedited crimes,” which resulted in a gross misdemeanor conviction or were diverted to drug court. This combination of an evolution in drug sentencing policy and resource constraints reduced felony drug convictions from 1,427 in 2007 to 373 in fiscal year 2010. (205–6)
Shortly thereafter, Satterberg and other officials announced the creation of the Law Enforcement Assisted Diversion (LEAD) program (205–6). LEAD’s creation was a result of pressure on local officials from community members concerned about aggressive law enforcement practices and stunningly high levels of racial disparity in Seattle’s drug arrests (Beckett Reference Beckett2016). In response to the severity and persistence of these unusually high levels of racial disparity, attorneys at the Racial Disparity Project mounted a selective enforcement challenge on behalf of a group of nineteen criminal defendants in 2003, all of whom were Black and/or Latinx (Beckett Reference Beckett2016).
Eventually, litigation fatigue and the persistence of significant public concern about Seattle’s still-active drug markets inspired the King County prosecutor, Seattle Police Department officials, and Racial Disparity Project staff to work together to identify an alternative approach. The result, eventually, was the creation and implementation of LEAD, which now exists across much of Seattle and King County and has been implemented, or is in the process of being developed, in numerous locales across the country.Footnote 18 LEAD seeks to reduce the neighborhood and individual-level harm associated with outdoor drug and sex markets as well as the criminal justice expenditures and human injury associated with conventional enforcement practices by diverting low-level drug and sex offenders into intensive, community-based social services that are guided by harm reduction principles (Beckett Reference Beckett2016; see also Satterberg Reference Satterberg2018).
The shift in drug enforcement philosophy and practice in King County has been especially dramatic but, nevertheless, provides insight into the larger political dynamics that are leading many urban prosecutors to reject some of the practices associated with the drug war. Like all but a few large urban counties, King County is now solidly democratic, and, in the age of mass incarceration, elected officials in increasingly liberal urban areas are finding that the politics of law and order no longer serve them well.Footnote 19 In this context, (comparatively) progressive prosecutors have campaigned—and been elected—on the basis of criminal justice reform agendas, with a particular focus on drug policy reform (Bazelon Reference Bazelon2019). By contrast, prosecutors in rural counties continue to seek conviction in many low-level drug cases that would be diverted or dismissed in King County. However, the fact that the legislature dramatically reduced sentences for drug offenses in 2002 means that comparatively few of these prosecutions result in prison sentences and very few result in long prison sentences (Drake Reference Drake2008).
In short, drug policy reforms undertaken in King County and the reversal of statutory reforms that heightened drug penalties in 2002 have helped slow the growth of the state’s prison population; in the context of a determinate sentencing framework, the reduction of statutory maximums for drug law violations in Washington has effectively capped the length of time most people convicted of a drug law violation spend behind bars. At the same time, tough sentencing laws aimed at people convicted of multiple and/or serious offenses remain on the books, and many prosecutors continue to employ these “statutory hammers.” As a result, the number of people serving long and life sentences has continued to climb. While the absolute number of crimes known to the police was just 5 percent higher in 2015 than in 1986, the number of long and life sentences imposed in Washington State more than tripled during this period.Footnote 20 The case of Washington thus suggests the possibility that the states that are less punitive by US standards are those in which the drug war has waned, and in which urban prosecutors have embraced reforms aimed at less serious crimes, but harsh sentencing policies for violent crimes, repeat offenses, and weapons violations remain largely uncontested and provide effective “statutory hammers” for prosecutors and judges inclined to impose very long sentences on people convicted of more serious offenses.
DISCUSSION AND CONCLUSION
In recent years, lawmakers across the United States have endeavored to reduce prison populations, mainly by enacting reforms designed to keep people convicted of less serious offenses such as drug possession out of prison (Gottschalk Reference Gottschalk2015; Beckett, Reosti, and Knaphus Reference Beckett, Reosti and Knaphus2016). While the impact of reforms that target the lowest-hanging fruit is inevitably limited (Tonry Reference Tonry2016), modestly declining incarceration rates have fueled the impression that state-level reforms have been efficacious, at least in some states.
The findings presented here suggest a far more complicated story. First, the penal response to law breaking continued to intensify after 2007 when incarceration rates began to fall. That is, the number of people sent to prison and other forms of correctional supervision relative to the number of felony crimes known to police continued to escalate even as states across the country endeavored to reduce their prison populations. Our findings further suggest that the greater commitment to the use of confinement by authorities in rural and suburban counties explains this pattern. In 2011–13, punishment rates in suburban and rural counties were notably higher than in large urban counties in all but four of the states in our thirty-eight-state sample. While differences in the response to drug arrests are especially notable, a substantially larger share of people arrested for all kinds of offenses in nonurban locales are sent to prison than is the case in urban counties. While the analysis presented here does not seek to explain why nonurban counties send more of their arrestees to prison, we treat this pattern as a meaningful indicator of heightened penal intensity in nonurban areas. This interpretation is bolstered by the fact that comparatively high admission-to-offense and arrest-to-offense ratios in nonurban areas are not an artifact of small denominators as crime is measured in terms of rates rather than absolute numbers. Nor do the geographic differences documented here stem from capacity problems in urban areas as urban jail populations have declined precipitously and many urban jails are operating well below capacity.Footnote 21
In short, differences in penal intensity across urban and nonurban locales are notable and have increased slightly in recent years. At the same time, the findings indicate that local penal practices and outcomes are very much shaped by the state policy environment. Punishment rates in rural and suburban counties in the most punitive states are three to four times higher than those observed in rural and suburban counties in less punitive states. Similarly, the average urban punishment rate in the most punitive states is twice as high as the urban punishment rate in less punitive states. Thus, while the informal exercise of discretion by locally elected officials clearly impacts criminal case outcomes, the consequences of this exercise of discretion are also powerfully conditioned by state policy environments. This conclusion is consistent with the results of regression-based analyses, which find that state-level factors explain roughly half of the county-level variation in incarceration rates (for example, Weidner and Frase Reference Weidner and Frase2001, Reference Weidner and Frase2003).
Our comparative case studies explore the mechanisms by which state law shapes penal outcomes. While prior studies examine how tough laws are differentially employed by actors operating in the same legal system, our comparative approach shows how decision makers can be both enabled and constrained by state sentencing policy. Both case studies show how the availability of “statutory hammers” empowers local criminal justice actors who are motivated for ideological and/or financial reasons to impose tough sentences (Lynch Reference Lynch2016). In Washington, however, such hammers are limited to people convicted of more serious offenses. Moreover, the use of a determinate sentencing grid that specifies comparatively moderate sentences for drug and property offenses means that rural counties simply cannot send as many drug or property law violators to prison or for as long as they can in states like Kentucky. Thus, state policies that expand the number and range of “statutory hammers” give tough-minded prosecutors and judges (increasingly concentrated in nonurban locales) the tools they need to fill prisons and, in some cases, local jails as well. Conversely, sentencing reform resulting in reductions in maximum sentence length effectively constrains zealous prosecutors and judges located in otherwise punitive counties and reduces the impact of their zealousness. These findings support the argument that formal sentencing policy and informal discretion are best understood as being intertwined than separate and distinct.
Finally, the findings presented here suggest that the end of the era of mass incarceration is not yet upon us. Instead, the results indicate that the justice system’s response to crime has continued to intensify despite the falling crime rates and the adoption of state-level reforms intended to reduce prison populations (see also Beckett et al. Reference Beckett2018). While the distribution of punishment across space has shifted, the proportion of crimes that result in imprisonment has continued to rise, especially in rural and suburban counties. While the analysis presented here does not identify the county-level drivers of penal intensity, it is worth noting that the increased use of prisons (and jails) in rural areas has been accompanied by the intensification of the rural-urban political divide. Whereas political divisions historically fell along state and regional lines, “the new political divide is a stark division between cities and what remains of the countryside” (Kron Reference Kron2012).
This split has been growing for some time, as an increasing number of America’s major cities have voted Democrat each year. By 2012, only four large cities voted Republican in the presidential election; all others, including those located in famously Red states such as Texas, voted Democrat. This pattern was even more pronounced in the 2016 presidential election.Footnote 22 The simultaneity of this trend with the growing geographic penal divide suggests that the latter may reflect broader shifts in the political landscape. This hypothesis is consistent with evidence that conservative values and the strength of the Republican party have been significant predictors of heightened incarceration across states and counties for decades (Jacobs and Helms Reference Jacobs and Helms1996, Reference Jacobs and Helms2001; Beckett and Western Reference Beckett and Western2001; Jacobs and Carmichael Reference Jacobs and Carmichael2001; Jacobs and Klebans Reference Jacobs and Klebans2003; Weidner and Frase Reference Weidner and Frase2003; Smith Reference Smith2004; Western Reference Western2006; Jacobs and Jackson Reference Jacobs and Jackson2010) as well as the fact that the vast majority of prosecutors and judges are elected (Barkow Reference Barkow2019; Pfaff Reference Pfaff2017).Footnote 23
There is also reason to believe that the increased use of prisons in nonurban areas may be reflective of, and contribute to, the rising levels of disadvantage in those spaces. Across the country, poverty and disadvantage are increasing in nonurban areas and are now most pronounced in rural counties (Grusky, Western, and Wimer Reference Grusky, Western and Wimer2011; Kneebone Reference Kneebone2017). Moreover, poverty and disadvantage are now strongly associated with variation in imprisonment at the sub-state level (Eason et al. Reference Eason, Greenberg, Abel, Sparks, Sherman, Tickamyer and Warlick2017; Eason, Zucker and Wildeman Reference Eason, Zucker and Wildeman2017; Simes Reference Simes2018; Oliver Reference Oliver2018). For example, John Eason, Danielle Zucker, and Christopher Wildeman (Reference Eason, Zucker and Wildeman2017, 205) find that in Arkansas, “rates of imprisonment and racial disparities in imprisonment are even higher in many nonmetropolitan areas than would be expected based on observed local area risk factors.” Similarly, in her analysis of variation in prison admissions across Massachusetts census tracts, Jessica Simes (Reference Simes2018) finds that concentrated disadvantage is a significant predictor of imprisonment, while Pamela Oliver (Reference Oliver2018) finds that white poverty rates are significantly associated with white incarceration rates and that this association helps explain rising imprisonment in rural areas.
In short, there is reason to believe that the spatial redistribution of the political divide and social disadvantage may help explain the geography of punishment in twenty-first-century America. Although additional research on the drivers of local variation in penal intensity is needed to assess this possibility, it is clear that meaningfully reducing prison and jail populations will require identifying and addressing the social conditions that are fueling commitment to the use of incarceration in nonurban locales. The research presented here also shows that removing the “statutory hammers” that enable motivated criminal justice actors to sustain the largest prison population the world has ever known will also be required if mass incarceration is to be meaningfully addressed (Lynch Reference Lynch2016).
APPENDIX 1. Additional information regarding data sources and measurement
Inclusion in the state sample was determined by the availability of prison admission, offense, and arrest data. For the later period, thirty-three states (of our thirty-eight-state sample) reported sufficient NCRP term records data. For Hawaii, Iowa, Minnesota, and Oregon, we also used NCRP data, but the data specifications for these states vary slightly. Hawaii NCRP data are taken from Part A (admissions) data rather from than term records data. Iowa NCRP data for the earlier time period were also taken from Part A records. Finally, Oregon used NCRP term records data for 2001–3, 2011, and 2012 but not for 2013. The data for Oregon reflect the average of 2011–12 rather than 2011–13. Admissions data for Kansas (2011–13) and Mississippi (2012) were taken from state Department of Corrections reports.
Inclusion in the sample also depended upon the quality of UCR data. Comparisons between offense and arrest populations indicate whether the UCR data can be used to create reliable arrest-to-offense ratios (a similar population for both data sources is critical to ensure that this measure is not skewed due to uneven reporting). Counties with large (greater than 10 percent) discrepancies between the populations sampled for the crime and arrest data were dropped, along with counties that had fully imputed their crime and arrest data. 246 counties were omitted from the sample for this reason.
Florida and Illinois do not report UCR arrest data at the county level. However, both states report these data through their respective state police departments, and these data were included for recent period sample. Additionally, while Florida does not report detailed drug arrest data, it does include information regarding total drug arrests. To calculate a comparable felony drug arrest for these two states, county-level data were multiplied by 0.495 (because 49.5 percent of arrests for drug abuse violations were not for marijuana possession, an arrest that rarely leads to a felony conviction).
California was omitted from the sample because of its size and the potential impact of the Brown v Plata (2011) ruling on our national sample. In response to this court decision, California began shrinking their prison population through early release and holding inmates with sentences up to four years in county jails rather than state prisons (Verma Reference Verma2016). Inclusion of data from California thus may have skewed the results presented here.
The reliability of NCRP admission data were assessed by comparing state totals for each year to Bureau of Justice Statistics’s Prisoners in the U.S. report, which details total admissions (for sentences greater than twelve months) for each state. Additional reliability information was also gleaned from the Vera Institute of Justice’s Working Paper: Reconstructing How Counties Contribute to State Prisons (Hinds, Lu, and Kang-Brown Reference Hinds, Lu and Kang-Brown2018).
Sampled States and Counties