Experimental
Plant materials
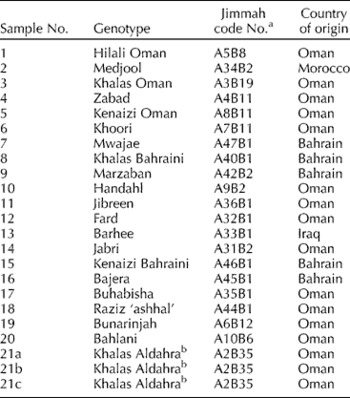
Twenty-one genotypes (Table 1; supplied by the Jimmah Research Station (Oman)) derived from mature in vitro propagated palms were DNA extracted (GenElute Plant Genomic kit; Sigma Aldrich, Gillingham, Dorset, UK). Three independent lines of the genotype Khalas Aldahra (propagated at the University of Nottingham by somatic embryogenesis) were also analysed to test for somaclonal effects on the derived genetic fingerprinting.
Genotypes of date palm used for molecular analysis

a Code number of genotypes used in Jimmah Tissue Culture Laboratory, Oman.
b Three individual plants from in vitro culture at Nottingham University.
Microsatellite markers
Sixteen primer pairs were tested (Billotte et al., Reference Billotte, Marseillac, Brottier, Noyer, Jacquemoud-Collet, Moreau, Couvreur, Chevallier, Pintaud and Risterucci2004) using an annealing temperature gradient running from 45°C to 60°C. From these, ten were selected for full analysis (mPdCIR010, mPdCIR016, mPdCIR025, mPdCIR032, mPdCIR035, mPdCIR044, mPdCIR070, mPdCIR085, mPdCIR090 and mPdCIR093) based on the strength of amplification. The microsatellite analysis was performed using a fluorescently labelled forward primer (Sigma-Proligo) and capillary electrophoresis (Beckmann Coulter CEQ 8000 model). Samples were run as pools of 3–4 markers per run, mixed post-PCR (polymerase chain reaction).
Data analysis
Microsatellite fragments were scored using the Beckman Coulter CEQ 8000 Genetic Analysis System and a presence/absence matrix constructed in Microsoft Excel. Correspondence analysis was carried out using the MVSP program (Kovachs, v.3.1; Kovachs Computing Services, Anglesey, Wales, Uk).
Results and discussion
Date palm (Phoenix dactylifera L.) is an important subsistence and export crop in much of northern Africa and the Middle East (Zaid and Arias-Jiménez, Reference Zaid and Arias-Jiménez2002). The ability of the date palm to produce a beneficial microclimate under its canopy has also made it an essential part of food security. Many countries have developed tissue culture procedures to rapidly multiply elite genotypes and cultivars, for local planting and for export. In Oman, there are more than 200 clonally propagated varieties of date palm (Anonymous, 2002) and this germplasm is an important component of plant improvement programmes, providing plant breeders with sources of useful traits. Agro-morphological traits, both qualitative and quantitative, have been commonly and traditionally used to estimate relationships between genotypes (Goodman, Reference Goodman1972). The characterization of date palm has been based mainly on fruit characteristics (e.g. shape, weight, colour, aspect of skin, consistency and texture), which are influenced by environmental conditions and have limited discriminatory power. This has led to ‘cultivars’ with similar morphological characters being given the same varietal name (e.g. in this study, Khalas Oman and Khalas Bahraini). As date palm is an obligate out-crossing species, cultivars will not be of identical genotype unless they are clonally derived from the same original palm.
Initial work to understand the genetic relationship within date palm varieties in Moroccan and Tunisian material has used restriction fragment length polymorphisms (RFLPs), random amplified polymorphic DNAs (RAPDs) and intersimple sequence repeats (ISSRs) (Sedra et al., Reference Sedra, Lashermes, Trouslot, Combes and Hamon1998; Ben Abdallah et al., Reference Ben Abdallah, Stiti and Lepoivre2000; Trifi et al., Reference Trifi, Rhouma and Marrakchi2000; Zhedi et al. Reference Zehdi, Sakka, Rhouma, Ould, Marrakchi and Trifi2004a). However, it was only with the development of SSR markers for date palm (Billotte et al., Reference Billotte, Marseillac, Brottier, Noyer, Jacquemoud-Collet, Moreau, Couvreur, Chevallier, Pintaud and Risterucci2004) that reliable, co-dominant and comparable molecular data on date palm populations could be generated (Zehdi et al., Reference Zehdi, Trifi, Billotte, Marrackhi and Pintaud2004b – on Tunisian date palm).
The aim of the present study was to: (1) evaluate polymorphic markers suitable for the discrimination of Omani date palm genotypes; (2) investigate the genetic relationships between key clonal varieties of Omani date palm; and (3) develop a DNA fingerprinting procedure to ensure quality control in the Jimmah Tissue Culture Laboratory.
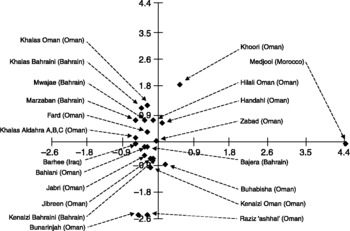
The correspondence analysis (Fig. 1) is consistent with the predicted expectations based on the known history or pedigree of the accessions used in this analysis. The genetic distances among the 21 accessions obtained from the correspondence analysis show a high level of diversity between the date palm genotypes and gave unique genetic fingerprints for all samples derived from different genotypes, together with identical fingerprints where the samples were derived from the same genotype (21a, 21b, 21c). The Medjool sample (derived from Morocco) is the outlier in the correspondence analysis, while the other samples – derived from countries in the Middle East – were more genetically similar.
Correspondence analysis for 21 different clonal genotypes using MVSP (Kovacks v.3.1). Axis 1 explains 19% of the variation and axis 2 a further 6%.

Khalas Oman (which originated in Oman) and Khalas Bahraini (from Bahrain), even though sharing the same varietal name, appear to be divergent genetically. Khalas Oman shows a close relationship to Buhabisha, Fard and Bahlani, while Khalas Bahraini is genetically closer to Marzaban. Furthermore, a similar situation was revealed in the Kenaizi Oman and Kenaizi Bahraini cultivars. That cultivars labelled as the same, but derived from different regions, are clearly different genotypes is not surprising, but is important to note for future breeding efforts and clonal production.
The study demonstrated that unique fingerprints could be obtained for the tested genotypes, gave an initial insight into the genetic relationships of key Omani date palm genotypes and demonstrated that material derived from different explants of the same genotype gave the same fingerprint after regeneration via somatic embryogenesis, suggesting that a fingerprinting system using SSRs would be robust enough to trace material through the tissue culture process.
Acknowledgements
I.A.A-R. would like to acknowledge the Government of Oman for sponsorship of this postgraduate research programme.