Introduction
The modern vision for the future of nanotechnology is to develop complex functional “objects” that will be able to operate autonomously and perform useful tasks. Nature offers a promising, already existing “template” to achieve that vision: insects. “Manufacturing” insects is based on self-assembly (natural biological processes) and therefore is economical and technologically friendly. Insects are a precious and yet underutilized source of information for the development of new micromechanical and micro/nano-fluidic systems and biomaterials, and for the utilization of new sensing and reaction mechanisms. The biological mechanisms in these highly diverse species have been developed and optimized by nature for the past 400 million years. Recent studies of insect physiology continue to reveal new mechanisms supporting respiration,Reference Westneat, Betz, Blob, Fezzaa, Cooper and Lee1, Reference Hetz and Bradley2 communication,Reference Cator, Arthur, Harrington and Hoy3 hearing,Reference Windmill, Sueur and Robert4, Reference Jackson, Windmill, Pook and Robert5 and other aspects of insect behavior and function. Modern nanotechnology tools offer the possibility to obtain more detailed and newer knowledge about the biomaterials used in insects and their bodily functions, assembly, and communications. At the same time, little exploration has been carried out with modern nanotechnology tools.
Atomic force microscopy (AFM) is one of the major innovations that has made the emergence of nanotechnology possible. The AFM technique has become popular in the study of biological materials at the nanoscale.Reference Jackson, Windmill, Pook and Robert5–Reference Radmacher, Fritz, Hansma and Hansma7 Demonstrably, AFM is capable of measuring the motion of the surface of biological cells with a resolution of several nanometers.Reference Jackson, Windmill, Pook and Robert5, Reference Domke, Parak, George, Gaub and Radmacher8–Reference Radmacher, Fritz, Hansma and Hansma12 Recently, it has been shown that the AFM technique can be utilized to study complex living organisms, such as insects.Reference Dokukin, Guz and Sokolov13–Reference Dokukin, Guz, Vasilyev and Sokolov15 For example, using a special sample stageReference Dokukin, Guz and Sokolov13, Reference Dokukin, Guz, Vasilyev and Sokolov15 designed to keep insect motion partially restricted, AFM can record surface oscillations with sub-Angstrom spatial and sub-millisecond temporal resolution, allowing topographical positioning of the probe at different parts of the insect with a precision of nanometers. In effect, AFM can work as a digital nanostethoscope, recording vibrations of the insect surface or structures on this surface. Insects are covered with a cuticle (exoskeleton covering the surface of insects), and they have small surface-borne hairs and wings. All of these structures should produce simple, non-functional noise when the insect moves and breathes. These structures can also hide the signals associated with the work of internal organs. A recent study,Reference Dokukin, Guz, Vasilyev and Sokolov15 however, showed that the observed vibrations come mostly from the motions of internal organs rather than from the cuticle or hair.
This article describes how the AFM technique can be applied as a nanostethoscope to “listen” to internal physiological events as the insect reacts to external stimuli such as light, sound, food, and respiratory or toxic gases. The recorded signal can be analyzed to characterize the responses and possible sensory mechanisms of insects. In particular, the spectral composition of surface oscillations of ladybird beetles can be used to understand the workings of its internal organs, its reaction to the presence of carbon dioxide, or how to test the sensitivity of insect eyes to light with different wavelengths. Lastly, other techniques are discussed that have a high potential to study surface oscillations as indicators of physiological processes in insects.
Atomic force microscopy as a stethoscope: How it works
AFM is based on the detection of forces acting between an AFM probe and the surface of a sample. The probe usually is a sharp tip that is attached to a very flexible cantilever. Any motion of the cantilever caused by the force acting on the probe can be detected by various methods. The most popular system of detection is optical. An incident stationary laser beam is reflected from the cantilever so that cantilever motion results in amplified deflection of the reflected beam. Beam deflections are detected by photodiodes placed some distance from the cantilever. When imaging, the probe is gently swept across the sample surface, causing cantilever deflections that are proportional to the change in the surface topography. Under regular experimental conditions, such a system can record surface profiles with subnanometer precision.
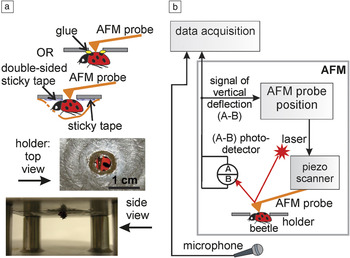
Traditionally, AFM has been applied to explore the surface topography of samples that do not move during the study. However, if the surface is moving, oscillations can be recorded at any one point of the surface without scanning. While measurement of oscillations of individual biological cells is possible, the expansion of this technique to study more complex living objects such as multicellular organisms or insects has been restricted by the allowable vertical deflection of the AFM cantilever. Typically, the integrity of a typical AFM cantilever can be jeopardized with a deflection greater than ∼50 μm. (Though this limit can be extended by adjusting the vertical position of the cantilever with the AFM scanner, the limit does not change substantially, even while adding large noise due to the feedback system adjusting the vertical position.) Clearly, organ and body movements in a living insect can easily exceed this limit. A technical solution to this issue has been suggested in Reference Reference Dokukin, Guz, Vasilyev and Sokolov15. Figure 1 shows a sample stage designed to partially restrict insect motion while recording with an AFM probe and keeping the insect alive. The key element of the stage is a metallic membrane with an aperture of a few millimeters diameter (the diameter should be adjusted according to the size of the insect of interest). A viable insect is attached underneath the membrane, for example, with the help of a microscopic amount of glue or adhesive tape if the operation requires reversibility. This positioning technique minimizes macroscopic insect motion in the vertical direction and virtually excludes any lateral displacement. It is worth noting that the adhesive tape method is more suitable for beetles; otherwise, rigid restriction of the motion of abdominal structures can result in closing respiratory spiracles (openings that insects use for breathing), thus preventing normal respiratory pumping by the animal and greatly reducing its survival time. Experiments on ladybird beetlesReference Dokukin, Guz and Sokolov13 showed reversibility and beetle survivability for the entire duration of the experiments (lasting several days).
A schematic of the atomic force microscopy (AFM) stethoscope. (a) The stage used to restrict motion of the insect during the study. (b) Scheme of data acquisition. An AFM probe is placed in contact with an insect surface at an optically accessible location, and the deflection signal from the AFM cantilever is recorded. Data from a reference microphone placed near the insect are used to monitor external noise. Reprinted with permission from Reference Reference Dokukin, Guz, Vasilyev and Sokolov15. ©2010, American Institute of Physics.

As an example, the AFM probe can be positioned on top of the insect through the aperture in the holder membrane (Figure 1a) with the help of an optical microscope (or inexpensive Web camera with a computer interface). Much more precise positioning accuracy can be obtained by using an AFM piezo scanner.
Since a typical AFM is not amenable to long duration recording (several minutes), data were recorded using a special external setup. Figure 1b shows an example of such a setup, see Reference Reference Dokukin, Guz, Vasilyev and Sokolov15 for technical details. Simultaneously, the external sound was recorded by means of a wideband precision microphone to monitor the ambient noise that can occur during the measurements. To eliminate the substantial noise due to the AFM vertical position feedback, which is conventionally used to keep the probe at a particular load force during scanning, one needs to set all gain parameters to zero.
The nanostethocope has a very high sensitivity in the detection of surface oscillations. The AFM setup described in Reference Reference Dokukin, Guz and Sokolov13 allows for collecting the signal from an area as small as ∼100 nm2 (0.0001 μm2) with a noise level of (2 ± 0.2) × 10−3 nm rms (root mean square) at frequencies >50 Hz. Signals from 5 Hz to several kHz can be monitored due to the broadband sensitivity of the present system. The specific top limit is defined by the parameters of the data acquisition card and the digital depth of recording used (24 bit); for example, the limit was 5–10 kHz for the system of References Reference Dokukin, Guz and Sokolov13–Reference Dokukin, Guz, Vasilyev and Sokolov15. To have high sensitivity to the high frequency oscillation, the resonance frequency of the AFM cantilever must be rather high (15–30 kHz in References Reference Dokukin, Guz and Sokolov13–Reference Dokukin, Guz, Vasilyev and Sokolov15).
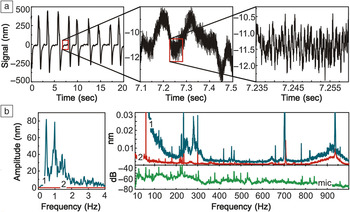
AFM recordings made on the elytra (forewings) of the ladybird beetle Hippodamia convergens (H. convergens) reveal oscillations that are set above background noise (Figure 2). Due to the high-bit digitization, oscillations with 500 nm and sub-Angstrom amplitudes can be detected. The signal spectra (Figure 2b) reveal peaks that are as small as ∼0.002 nm (with a noise amplitude <0.001 nm).
Surface oscillations from the elytra (forewings) of a ladybird beetle (H. convergens). (a) Time domain oscillations recorded at a 50 kHz sampling rate from the surface of the elytra. From left to right, the signal is depicted with increasing temporal resolution, down to a 20 ms long sequence in the right panel. (b) Frequency spectra of the surface oscillations. Right panel, curve 1 (blue) is the signal from a live specimen, and curve 2 (red) is from a dead, but not dehydrated, beetle. Ambient noise was recorded (green curve “mic”) with a broadband microphone in the vicinity of the holder. One can see that the signals with amplitudes of 0.002 nm can be resolved. Adapted with permission from Reference Reference Dokukin, Guz and Sokolov13.

Such signals can be collected from different anatomical locations of the insect. For example, when locating the probe near the insect’s heart, its hemolymphatic pump, strong beating mechanical signals can be detected, revealing previously unknown high frequency oscillationsReference Dokukin, Guz and Sokolov13 (the nature of these kinds of oscillations will be discussed later in the article). This method can also be used to detect other physiological responses to various stimuli. These applications will be described in the next sections. Although the examples described in this article deal with ladybird beetles, it was demonstrated that the same approach can be used for other insects, such as flies and mosquitoes.Reference Dokukin, Guz, Vasilyev and Sokolov15
Spectral sensitivity of insect eyes
The sensitivity of insect eyes has been studied by various methods, starting from the observation of the insect’s reaction to different colorsReference Maredia, Gage, Landis and Wirth16 to the advanced and more reliable methods of studying the electrophysiological response of individual photoreceptive cells involved in vision.Reference Briscoe and Chittka17
The AFM-based stethoscope was used to study spectral sensitivity of insect eyes to light using the ladybird beetle (H. convergens). A flashing monochromatic light was used to illuminate the head of the ladybird under the AFM setup, as shown in Figure 1a.Reference Guz, Dokukin and Sokolov14 The flashing light (1–2 flashes a second) disturbs the beetle if it sees it. As for any living organism, repetitive stimulation can result in adaptation and decreased reaction by the organism. To avoid adaptation effects, which have been also studied,Reference Guz, Dokukin and Sokolov14 the illumination started from near infrared light and finished with ultraviolet (near infrared and red wavelengths are reported to be outside the ladybird’s spectral sensitivity and cause no disturbance). A light of low intensity was used to avoid enhancing the adaptation and potentially harming the insect.
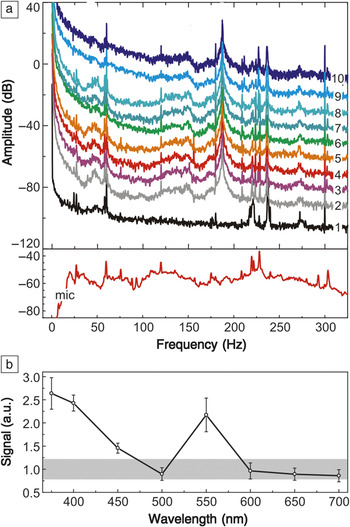
Figure 3 shows representative surface oscillation spectra collected on a ladybird exposed to the flashing monochromatic light of various wavelengths, from 700 nm (curve 3) to 375 nm (curve 10) with 50-nm steps. Curves 1 and 2 are the reference spectra recorded on a dead and living (with no illumination) ladybird, respectively.
Oscillations of the elytra surface of a ladybird beetle (H. convergens) to flashing light of different wavelengths measured with an atomic force microscopy (AFM) stethoscope. (a) Representative mechanical spectra measured for a specimen exposed to flashing monochromatic light of various wavelengths ranging from 700 nm (curve 3) to 375 nm (curve 10) with 50-nm steps. Curves 1 and 2 are reference spectra recorded on a dead and living (with no illumination) ladybird, respectively. The vertical shift of 10 dB was added to each consequent spectrum except (1) for better visibility. The spectrum of the room acoustic noise collected from a microphone is shown at the bottom (mic). (b) Spectral amplitudes integrated within the 40–100 Hz range. The gray area is the variation of the spectra for the ladybird with no flashing light. The beetle can clearly see ultraviolet and purple colors, is blind to the emerald color (wavelength of 500 nm), and has a range of vision in the vicinity of the green color. Reprinted with permission from Reference Reference Dokukin, Guz and Sokolov13.

To determine the beetle sensitivity to light of different wavelengths, the part of the oscillation spectrum that changes the most during the flashing was found with respect to the baseline (dead beetle). The spectral regions of large room noise, which were seen in the spectrum recorded by the microphone, were excluded. Correlating the relative changes in the spectra collected for different wavelengths of the flashing light, one can derive information about the sensitivity of the ladybird’s eyes to the wavelength of incident light. The integral of spectral amplitudes in the range of 40–100 Hz was determined as an example of a robust correlation between the presence of flashing light and the spectral change (Figure 3b). Compared to the variation of the spectra without flashing light (gray zone of Figure 3b), it becomes apparent that the ladybird’s spectral sensitivity is higher in the range of near UV (375–400 nm) and around green light (550 nm). Such spectral sensitivity is in qualitative agreement with the response reported previously.Reference Briscoe and Chittka17, Reference Mishra and Meyer-Rochow18
The described method combines the advantages of observational methods in which the behavior of the entire insect (mostly macroscopic motions of the legs and antennas) is analyzed as well as the quantitative nature of electrochemical cellular studies. Using this method, it is thus possible to study the entire sensory mechanism of vision in greater detail, which will help to understand the differences and similarities of vision between insects and humans.
Studying the mechanical response of internal organs
Examples of drinking water and reacting to the presence of carbon dioxide
A more complicated analysis of the signals recorded with the AFM stethoscope to study the insect’s reaction to external stimuli is described in Reference Reference Dokukin, Guz and Sokolov13. It was shown how the analysis of the AFM recordings can be used to understand some parts of the complex mechanisms of drinking and the reaction to the presence of carbon dioxide in air. Although the AFM signal can be collected virtually from any place on the ladybird,Reference Dokukin, Guz and Sokolov13 the AFM signals were collected on the elytra in both examples described later. The elytra was chosen because it demonstrated a rather rich spectrum of surface oscillations.
AFM-based stethoscope measurement during water drinking
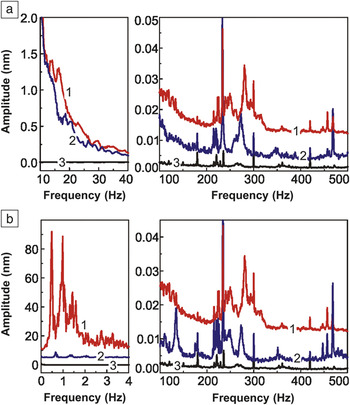
Figure 4a illustrates an AFM recording when a ladybird is fed sugar water.Reference Dokukin, Guz and Sokolov13 A small water droplet on a toothpick was used to feed the ladybird. (The fact that it was drinking was validated by prior observation of the natural behavior of the beetle in a Petri dish where beetles readily drank water droplets.) Drinking is a complex behavior involving the activation of many muscles as well as the motion of the liquid. The frequency spectrum of motion while drinking changed (curve 2) compared to the non-feeding state of the ladybird and a dead ladybird (curves 1 and 3, respectively). The peaks around 15–17, 120, and 250 Hz became smaller or disappeared. A large peak at 280 Hz apparently decreased by ∼25% and shifted to 273 Hz. There is also a broad double peak around 290–320 Hz, which disappeared when the beetle was drinking. New peaks at 18–20 Hz (maybe shifted 15–17 Hz peaks) and 350 Hz appeared.
Oscillation spectra recorded with an atomic force microscopy (AFM)-based stethoscope on a ladybird (H. convergens) when (a) fed with sugar water (curve 2). Curve 3 is the control curve taken from a dead ladybird. (b) Spectra obtained when the insect was exposed to carbon dioxide (curve 2). Control curve (curve 3) corresponds to a dead insect. In cases (a) and (b), curve 1 is the spectrum collected on live undisturbed insects (0.01 nm added to high frequency curve 1 for better visualization). Only parts of the spectra showing differences are shown. One can see specific spectral changes of surface oscillations of the beetle due to drinking and its exposure to carbon dioxide. Reprinted with permission from Reference Reference Dokukin, Guz and Sokolov13. ©2011, Elsevier.

This shows that drinking invokes a fairly complicated alteration of the spectral signals. While the complete deciphering of the observed spectra is yet to be done, there is a possibility of measuring the nanomechanical oscillations associated with a complex behavior, which can open the door to understanding underlying mechanisms. As a simple example, one can do the following reasoning.Reference Dokukin, Guz and Sokolov13 It is well known that the oscillation energy of a harmonic oscillator is proportional to its amplitude squared. Therefore, the decrease in amplitude of a particular peak suggests that less power is used by the corresponding muscle or organ while drinking. On the other hand, when a spectral peak appears (or gains in magnitude), the corresponding muscle or organ can be viewed as powered (or processing more power). Furthermore, it is known that at sufficiently small amplitudes, motion can always be treated as the oscillation of a simple harmonic oscillator. If the oscillations are not forced (by an external force), the resonance frequency of the oscillator is given by the following formula: 
, where k is the effective spring constant, and m is the effective mass of the muscle or organ. Therefore, a spectral peak may shift to a higher frequency if either the effective spring constant increases or the effective mass decreases. In the process of drinking, it is unlikely that the mass can decrease. The mass either remains constant (in the case of muscles) or increases (for the digestive system filling up). Living organisms tend to minimize energy expenditure, thus it may be assumed that the ladybird’s muscles are more relaxed while in the normal stage and powered more when drinking (and plausibly not the other way around).
Accordingly, one may speculate that the disappearance of peaks of mechanical motion at 120 and 250 Hz implies that this motion is associated with an organ that fills up with water intake. Energy dissipation due to viscoelastic damping and a simple need to move a mass around can lead to the vanishing of resonant peaks. Thus, it is plausible to associate these 120 and 250 Hz peaks with the oscillations of the main pathways of drinking water. The peaks at 18–20 Hz and 350 Hz, which appear during drinking, might be associated with the contraction of crop muscles required for water intake.Reference Dokukin, Guz and Sokolov13
The observed decrease of motion at 280 Hz (by about 25%) and its shift to a lower frequency (273 Hz) may be associated with an organ (the insect’s crop—a vesicle) that is filled during water intake. The filling is deemed to lead to an increase of mass and a decrease in the frequency of oscillations. Assuming there is no change in the effective spring constant, the change of mass responsible for the observed change of frequency would only be 1.3%. A 25% decrease in the amplitude is too large to be explained by a 1.3% additional mass of water. At the same time, this large amplitude decrease is unlikely to be explained by muscle relaxation alone because of the small, and perhaps non-significant, shift in the oscillation frequency. Presumably, the drop in oscillation magnitude may be attributed to a powering down of some organ while drinking. The disappearance of the broad double peak around 290–320 Hz seems to relate to the decrease of the 280 Hz peak because it is virtually identical to the ladybird’s response to the chemical stimulus (breathing of carbon dioxide), described in the next section.
AFM-based stethoscope measurement of carbon dioxide exposure
The surface vibrations were examined using AFM in response to exposure to carbon dioxide (CO2).Reference Dokukin, Guz and Sokolov13 The AFM stage with the insect was sealed from the bottom with a plastic film. This resulting chamber with the insect was filled with CO2. Figure 4b shows an example of the spectra measured on the elytra of a ladybird. One can see that all low-frequency activity (<5 Hz) is substantially suppressed (curve 2 of Figure 4b) after adding CO2. Both known breathing and heart beating peaks (∼0.5–1 Hz) almost disappear (and seem to be shifted toward higher frequencies). The 280 Hz peak decreases by almost 40% and shifts to 273 Hz. CO2 reversibly disrupts the respiration of insects.Reference Burkett and Schneiderman19 The muscles responsible for the closing of the respiratory spiracles, located on the sides of abdomen, (peritremal contraction) are known to be sensitive to the presence of CO2, where the spiracles tend to close, thus reducing respiration. Furthermore, the spectrum of Figure 4b shows the appearance of four new peaks: a well-pronounced peak at 133 Hz, a smaller peak at ca. 170 Hz, and weaker peaks at 350 Hz and 480 Hz. Presumably, these peaks, in particular the 133 Hz peak, can also be associated with the activation of the spiracle peritreme muscles.
The other feature of the spectra shown in Figure 4b is the disappearance of a broad double peak around 290–320 Hz after adding CO2. This is surprisingly identical to the previous example of drinking. As was concluded, such a behavior could be explained by a powering down of some organ producing these frequencies. After observing this behavior as a response to different stimuli, one may hypothesize that the disappearance of the 290–320 Hz peak could be a manifestation of part of a standard response to an external stimulus.Reference Dokukin, Guz and Sokolov13
One can see that these conclusions are rather speculative at the moment due to the complexity of the internal insect machinery. Further work is needed to make more precise conclusions about the response/work of particular organs.
Comparing AFM with competitive techniques
Optical microscopy and interferometry systems for the detection of surface oscillations have been previously used to study the surface vibrations of insects (e.g., Reference Reference Pelling, Wilkinson, Stringer and Gimzewski20). Optical interferometry based systems could potentially give better sensitivity to the surface displacement than the AFM setup described here. However, those systems require a well-defined stable surface reflection. As an example, a state-of-the-art systemReference Pelling, Wilkinson, Stringer and Gimzewski20 detected surface oscillations from a small reflective plate of an area of ∼500 μm2 that was attached to the insect surface (with a noise level of 0.5 ± 0.2 nm [rms]). In contrast, the AFM setup described here allows for the collection of the signal from an area as small as ∼0.0001 μm2 (with a noise level of (2 ± 0.2) × 10–3 nm rms). The main reason that AFM has a higher sensitivity, in particular at the higher frequency range, is the small mass of the AFM cantilever. As a result, such a system does not have the energy losses associated with moving a large mass with higher frequency and therefore has high sensitivity to the frequencies below the resonance frequency, which is rather high for AFM cantilevers (∼20 kHzReference Dokukin, Guz and Sokolov13–Reference Dokukin, Guz, Vasilyev and Sokolov15). In principle, it may be feasible to attach a very small mirror to the insect surface and obtain sensitivity similar to AFM. However, it would be challenging to attain flexibility similar to AFM to position the AFM probe at different places on the insect surface. Using such positioning, for example, far away from and close to the insect’s heart, the AFM method revealed previously unknown high frequency (∼290 Hz) oscillationsReference Dokukin, Guz and Sokolov13 associated with the activity of a ladybeetle heart.
Conclusion
The atomic force microscopy (AFM)-based nanostethoscope method gives interesting insights into the processes inside of living insects in a non-destructive way to understand how they work, how they operate, and how they respond to light. It is possible to suggest that the examination of the contraction of the insect’s muscles in the frequency domain will result in identification of the spectral signature of a particular organ. Research with an AFM-based stethoscope is in the beginning stages, and several of the conclusions are rather speculative so far. This situation can be compared with any spectroscopy in the beginning of its development: many peaks are observed, and only a few are identified. Certainly, there is a lot of work ahead.
The described method can also be expanded to the study of non-biological objects and systems. For example, the analysis of micro-/nano-fluidic systems made of soft materials can be performed with similar AFM methodology. Artificial muscles, micromechanical devices, and various sensors can also be studied with this method.
Emphasizing the described method allows for a better understanding of sensory and functional mechanisms of insects, that are simple but effective bio-machines. Such understanding will help implement these mechanisms for the development of new micromechanical and micro-/nano-fluidic systems, sensors, functional devices, and biomaterials. Thus, it will help to implement the vision of the future of nanotechnology and to develop artificial bio-nanomachines with specific functions.
Acknowledgments
The author is thankful to Professor Daniel Robert for careful reading of the manuscript and suggesting numerous improvements.
 Igor Sokolov is a professor of physics and the director of the Nanoengineering and Biotechnology Laboratories Center at Clarkson University, Postdam, New York. He received his BS degree in physics at St. Petersburg State University, Russia, and his PhD degree from the Soviet Bureau of Standards (Russian NIST). After his postdoctoral training at the University of Toronto, Sokolov joined the faculty at Clarkson University. He is the author of 125 refereed publications in various areas of surface science, self-assembly, photonics, biophysics, astrophysics, and elementary particles. Sokolov can be reached at the Nanoengineering and Biotechnology Laboratories Center, Clarkson University, Potsdam, NY 13699–5820, USA; tel. 315-268-2375; and email isokolov@clarkson.edu.