Organic fluors (or dyes) are used in applications ranging from painting and labeling to luminescence sensing of ultra-low analyte concentrations, as well as scintillation to detection ionizing radiation.[Reference Hoetzer, Medintz and Hildebrandt1–Reference Prodi, Bolletta, Montalti and Zaccheroni4] The active portion of an organic fluor has a system of pi-conjugation (also known as a chromophore) and is responsible for a specific color of the material. Scintillation occurs when ionizing radiation energy absorbed by the host matrix is transferred to the electrons of the fluor placing it in an excited state, which subsequently relaxes to the ground state resulting in the emission of light.[Reference Prodi, Bolletta, Montalti and Zaccheroni4–Reference Liu, He and Guo6]
Owing to an extended conjugated system (aromatic) fluor molecules have a natural tendency to aggregate even in relatively dilute solutions. Depending on the chemical structure and arrangement of the dye molecules in the aggregate, either red-shifted J-aggregates or blue-shifted H-aggregates can be observed.[Reference Callan, de Silva and Magri5–Reference Wurthner, Kaiser and Saha-Muller9] Control over formation of dye aggregates is highly desirable, as isolated single chromophores emit more brightly when a high density of them can be achieved without aggregation. The latter situation may be realized when the dye molecules are trapped within nanoscale pores of nanosilica or zeolite matrices. Previously, variation of optical properties was reported for visible light dyes under geometrical confinement in nanopores of zeolites,[Reference Márquez, García, Palomares, Fernández and Corma10] silica particles,[Reference Cho, Volkov and Sokolov11, Reference Sokolov and Volkov12] and dendritic polymer molecules.[Reference Márquez and Sabater13] Spectral shifts of 3–300 nm were observed. However, the size of the pores was material specific and was not varied broadly in those experiments.
In this paper, we report optical properties of polymer–fluor scintillator systems with fine control and variation of the polymer matrix porosity and, thus, the degree of geometrical confinement imposed to the fluor molecules. The desirable porosity (in terms of the average pore size, pore-size distribution, total surface area, and pore volume) was produced in the material during suspension polymerization synthesis of the matrix.
Porous polystyrene (PS) beads were prepared through suspension polymerization using divinylbenzene (25% or 75% by volume) as a cross-linking agent.[Reference Bliznyuk, Duval, Apul, Seliman, Husson and DeVol14] Three different fluor molecules were tested: 1,4-bis (4-methyl-5-phenyl-oxazol-2-yl)benzene (DM-POPOP, 98% scintillation grade, Aldrich), 2-(1-naphthyl)-5-phenyloxazole (αNPO) (Fluka), and 2-(1-naphthyl)-4-vinyl-5-phenyloxazole (v-NPO). v-NPO is the monomer form of αNPO; it was synthesized in our laboratory.[Reference Seliman, Bliznyuk, Husson and DeVol15] Chemical formulas of these compounds are shown in Fig. 1. DM-POPOP and αNPO are chemically inert and thermally stable at polymerization temperature (75 °C). v-NPO was utilized as a co-monomer and was incorporated into the polymer matrix through reaction of the vinyl group in its chemical structure. Fluor molecules were introduced into the polymer matrix using two alternative approaches: (1) by adding fluoro (0.5 wt%) to the monomer mixture prior to suspension polymerization (mixed fluor); and (2) by immersing preformed PS beads into a toluene/acetone solution with 0.5 wt% fluor for 24 h to allow diffusion of the fluor molecules into the PS matrix.
Fluorescence excitation spectra for DM-POPOP (a), αNPO (b), and v-NPO (c) fluor molecules in various environments, which include solution in toluene (the most red-shifted peaks) and PS beads (25% DVB) with different porosity (depending on a porogen being used).

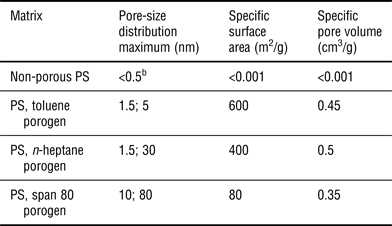
Three different porogens were utilized during the suspension polymerization process to achieve different average pore size and pore-size distribution: toluene, n-heptane, and span 80 (non-ionic surfactant). Porosity properties of the PS resin matrix depending on the applied porogen have been previously reported[Reference Bliznyuk, Duval, Apul, Seliman, Husson and DeVol14] and are summarized in Table I. Owing to thermodynamic compatibility of the components, the smallest pore size (<2 nm) and the highest specific surface area (~600 m2/g) could be achieved with the toluene porogen; while n-heptane and span 80 porogens produce large-size pores with moderately high specific surface area (80–400 m2/g) and pore volume.[Reference Bliznyuk, Duval, Apul, Seliman, Husson and DeVol14] A bimodal pore-size distribution is observed for all porogens under study. However, for the toluene porogen the smallest nanometer-size pores are in the majority, while in case of span 80 porogen the major contribution comes from macropores (~80 nm average pore size). PS beads prepared with n-heptane porogen show mesopores (Table I, and Figure S1). For comparison, non-porous PS resins with the same chemical composition were also prepared and tested. They showed non-detectible surface area and pore volume by the nitrogen adsorption porosimetry [Brunauer–Emmett–Teller (BET) analysis].
Physical properties of polymer matrices measured by BET and DFTa analysis of nitrogen adsorption–desorption isotherms (75% cross-linked resins).
a Brunauer–Emmett–Teller (BET) and density functional theory (DFT) approach.
b Typical free volume size associated with flexible polymer chains.[Reference Sperling17]
Fluorescence of the polymer beads and fluor solutions was measured in the 250–600 nm spectral range using Quanta Master 60 fluorescence systems (Photon Technology International, Inc.). Raman spectra were recorded with a spectrometer comprising an Innova 200 argon ion laser (514.5 nm wavelength at ~1 mW) and a Triplemate 1377 (Spex) spectrograph interfaced to a liquid nitrogen-cooled CCD detector (Model LN1152, Princeton Instruments).
Table II summarizes the emission properties of fluors depending on their environment. One can see a well-pronounced 3–4 nm hypsochromic shift in the emission peak position for polystyrene–fluor systems compared with a dilute fluor solution in toluene (monomer state). The latter in turn is blue shifted in comparison with the crystalline powder state (presumably aggregates) of the same fluor. In addition, a roughly 30% increase in the fluorescence intensity was observed for the resins prepared with the toluene porogen (smallest average pore size). Even more, attempts to leach fluor molecules from the PS matrix with toluene or acetone solvents showed persistent intensity of the fluorescence or even its enhancement, even after 99% of the fluor molecules (DM-POPOP or αNPO) had been removed with the solvent (see Supplementary materials and Ref. Reference Wade, Seliman, Husson, Bliznyuk and DeVol16) Finally, an additional blue-shifted peak appeared in the emission spectra of samples that were characterized with a broad pore-size distribution; i.e., samples prepared with the span 80 porogen.
Fluorescence peak maximum position depending on the type of matrix and chemical formulas of fluor molecules under study.
a Broad peak constituted with two or more lines.
Spectral shifts of the fluor molecules under study should be considered in the context of their possible aggregation behavior. It is well known that chromophores can aggregate in different ways depending on the interactions among neighboring molecules.[Reference Davydov7, Reference Bücher and Kuhn8] The two extreme cases are known as J-type and H-type aggregates, in which the induced dipole moments of individual chromophores are aligned in head-to-tail and head-to-head configurations, respectively. In the case of J-aggregates, the maximum of the absorption shifts to lower energy relative to that of the monomer, corresponding to the transition into the lowest energy level of the exciton band. For H-aggregates, the most intense absorption transition takes place into the highest level of the exciton band and a blue shift is observed. Whereas J-aggregates are characterized by increased fluorescence yield relative to the monomer, H-aggregates usually exhibit greatly reduced fluorescence with a much larger Stokes shift compared with that of J-aggregates. After exciting H-aggregates, rapid vibrational relaxation takes place to the lowest exciton band that has low emission probability due to a small transition dipole moment.
The emission spectra for fluor molecules introduced into polymer beads via diffusion depend more strongly on bead structure than those for fluor molecules mixed directly with the monomer during suspension polymerization. Swelling of the matrix in a solvent is an important prerequisite for fluor diffusion into the polymer beads. Therefore, the dense structure of non-porous PS or nanoporous structure of PS prepared with toluene porogen limited the fluor penetration into the polymer matrix. On the contrary, n-heptene and span 80-based resins contain larger pores that allow fluor to diffuse easily into the beads. In this case, the emission spectra for the mixed and diffused fluors practically coincide (Figure S2 from supporting materials). The consequent drying step causes shrinking of the material and redistribution of the fluor molecules in the pores. Fluor molecules become more concentrated and thus are likely to form aggregates. As demonstrated, formation of stacks of chromophores with higher band gap energy (H-aggregates) occurs under conditions of relatively fast pore collapse during dewetting of nanoparticulate polymer films.[Reference Heier, Steiger, Hany and Nuesch18] In our case formation of H-aggregates in meso- and macropore matrices manifests itself as an additional emission peak at ~415 nm (Figure S2 and Table II).
Figure 1 displays the fluorescence excitation spectra for DM-POPOP, αNPO, and v-NPO in PS and toluene. The maxima displayed in Fig. 1 are blue-shifted relative to the solution phase where the magnitude of the shift depends on the matrix porosity. The detected fluorescence maxima positions are characteristic of the fluor (due to the difference in molecular dipole moments); however, the observed spectral shifts show similar dependence on the polymer matrix and therefore can be attributed to its porosity. Interestingly, the v-NPO beads also display the pore-confinement effect. This may be related to incompatibility of the fluor and styrene, which leads to phase separation and thermodynamically driven localization of the fluor molecules on the pore walls even under conditions of their copolymerization.
Whereas the peak shift is due to the effect of the PS matrix, the region of the spectrum to the left of the peak is most likely the result of molecular assemblies dominated by H-type aggregates in the pores. The aggregation state in the pores appears to be highly heterogeneous as is evident from the strong tailing and the appearance of additional bands on the blue side from the emission maxima. The observed blue shifts of several nanometers in the emission maxima for fluors in a porous PS matrix are comparable with previously reported values for Rhodamine 6G molecules confined in nanopores of silica nanoparticles.[Reference Cho, Volkov and Sokolov11, Reference Sokolov and Volkov12] A low Stokes shift in the emission of the chromophores in PS matrixes relative to that in solution indicates that the emission comes mainly from non-aggregated or loosely aggregated fluor molecules that are expected to be present in such a heterogeneous system. The contribution of J-type aggregates to the observed emission is unlikely because no red shift in the fluorescence excitation spectra was observed. The experiments in which the removal of more than 99% of fluors from the matrix did not significantly reduce the fluorescence intensity further corroborate the conclusion that the observed fluorescence originates mainly from non-aggregated chromophores.
The pore confinement effects were analyzed further using Raman spectroscopy. Figure 2 shows Raman spectra of the DM-POPOP (as the most representative among the considered fluors) in different environments. Several characteristic peaks fall into a window of transparency of the PS matrix enabling monitoring of fluor–matrix interactions. The range of wavenumbers between 1300 and 1600 cm−1 has been reported to be the most sensitive to distortions of the conjugated structure (so-called, Я-mode[Reference Tian, Zerbi and Müllen19, Reference Castiglioni, Tommasini and Zerbi20]). Characteristic peaks at 1419, 1530, 1543, and 1571 cm−1 can be ascribed to the fluor, while the presence of weak PS peaks (1451 and 1584 cm−1) in the same range allows calibration and the relative intensity of the fluor to PS peaks are an indication of the matrix effects independent of bead composition. The original distribution of the intensity for the Raman doublet at 1530 and 1543 cm−1 (DM-POPOP in toluene solution spectrum) is modified significantly in a polymer environment. The higher frequency line at 1543 cm−1 shifts to higher energy (1545 cm−1) as the porosity of the matrix increases, whereas the lower frequency line at 1530 cm−1 broadens for matrices with larger pore sizes (indicating splitting of this peak into two components). Also, the intensity of the doublet generally is lower for matrices with higher porosity. An opposite trend can be observed for the peak at 1409–1419 cm−1. Here the peak intensity increases with increasing porosity and the samples clearly form two groups: non-porous beads or beads prepared with toluene porogen versus beads prepared with n-heptane or span 80 porogens. For the former group the intensity of this doublet peak is low, whereas for the latter group the intensity is much higher (especially for the lower energy 1409 cm−1 component). The peaks at 1584 and 1449 cm−1 belong to the PS matrix. The first one is insensitive to the presence of fluoro molecules, whereas the second one shifts depending on the porosity of the polymer. Again, the most pronounced changes were revealed for span 80 [Fig. 2(d)] and n-heptane-based porous resin [Fig. 2(e)] where this vibronic peak was shifted to lower wavenumbers.
Raman spectra in the window of transparency of PS (1400–1600 cm−1) for DM-POPOP in toluene solution (a), for PS resins containing 0.5 wt% of DM-POPOP and different porosity: (b) non-porous PS beads, (c) PS beads prepared with toluene porogen, (d) with span 80 porogen, (e) with n-heptane porogen; and non-porous PS beads containing no fluor (f). Raman spectra are shifted along the ordinate axes for clarity. The intensity of Raman spectra of PS beads is normalized to PS peak 1450 cm−1. The vertical lines are given as guides for the eye to recognize frequency shifts of some peaks due to variation of the porosity of PS matrix.
Because DM-POPOP fluors are expected to be in an aggregated state in the porous PS matrix, as was elucidated from fluorescence measurements, the observed blue shift can originate from both aggregation and exciton–phonon coupling. In larger pores, such as those resulting from span 80 porogen, the fluor molecules are more likely to be in free space (in the absence of the solvent in the pores) and therefore experience less damping compared with those in smaller pores and the solvent environment. It is also possible that DM-POPOP molecules in larger pores form aggregates, in which a coherent exciton state is formed, leading to exciton–photon coupling for selected vibrational modes. Such coupling can lead to blue shifts as well as intensity enhancement of some vibrational modes compared with the same molecules in the non-aggregated state. It can be speculated that the increased intensity at 1409 cm−1 of the fluor observed in a PS matrix with large pore size (span 80 or and n-heptane porogen) relative to the two other samples is due to the exciton–phonon coupling in the aggregates. The observed lower energy shift of the 1551 cm−1 PS band provides support for the existence of vibronic coupling between the fluor molecules and the matrix, which varies further depending on the nanoscale porosity of the latter. Matrix effects on vibrational modes of molecules are expected to result in red shifts and/or the reduction of the intensity of the corresponding bands.[Reference Czeslik, Kim and Jonas21] These changes usually are ascribed to the matrix imposing restraining and damping of molecular vibrations.
Figure 3 illustrates the emerging picture of the confinement effect based on available data. During suspension polymerization synthesis of a resin bead, the fluor molecules are pushed away from the bulk polymer material into the pores. This happens due to limited solubility of the fluor in PS matrix. Therefore, in the final polymer material the majority of fluor molecules are located within the pores and probably attached to the pore walls by van der Waals interaction forces. Excitation with light and relaxation to the ground state of such molecules proceeds in a different way in comparison with their solution state (non-confined situation). Firstly, the mechanical motion of the molecule is restricted by the wall, so that not all of the vibrational modes are possible and some of them are severely hindered. Secondly, and not the least important, the molecule attached to a wall has an asymmetric local electric field environment. To preserve the electrical neutrality of the media in the location of the molecule some additional polarization of the wall material is required causing a local field polarization, which may be significant since the fluors are polar. The incoming electromagnetic wave can additionally disturb the local electric field distribution thus causing the excited energy levels’ shift and/or band gap energy variation. Therefore, modification of the vibronic levels within both the ground and the excited state orbitals (energy bands) in comparison with a non-confined situation can be expected. The above effects may lead both to a spectral shift and intensity variation of the emission peak.
The scheme of the observed confinement effect of fluoro molecules in nanopores. A porous PS bead (left) creates two possible situations for fluoro molecules immersed into solvent or surrounded by non-porous polymer matrix (no confinement) or fluoro molecules located inside nanoscale pores with possible electronic (polarizable media just on one side from the fluoro) or vibronic (restriction on possible vibration modes of the fluoro due to its physical contact with the pore walls) confinement. The vibronic confinement affects mainly the ground state of the molecules, whereas electronic confinement put restrictions on the available excited levels or may cause shifts of the energy levels.
One should notice a difference between the diluted state regimes within polystyrene or toluene matrices in this context. Both situations are characterized with a low degree of confinement. Statistically all possible orientations of molecular axes are present within the fluor–matrix system in both cases. However, in the solid-state matrix no rotations of the guest molecules is possible (molecularly frozen state), while there is no such restriction in the solution. The effect manifests itself as a difference in peak widths observed in the fluorescence excitation spectra (Fig. 1). The main peak recorded for the fluor solution is narrow. On the contrary, the same fluor in a solid matrix shows an extremely broad fluorescence excitation peak (spreading over 100 nm spectral range or more). The width of this peak also depends strongly on the nature of the host matrix and can be used as an independent measure of its porosity. As revealed in our experiments, the width of this peak increases in the order: non-porous matrix > toluene porogen > n-heptane porogen > span 80 porogen, thus following the development of higher specific pore volume and larger average pore size.
Porous polymer matrices offer an interesting possibility for precisely controlling the fluorescence properties of guest fluor molecules. Despite being optically inert, a nanoporous polymer matrix can impose a significant confinement to chromophores due to geometrical restrictions on molecular vibrations and electronic confinement as a result of a non-uniform local electrical charge distribution near the pore wall. The observed nanopore confinement effect manifests itself as a several nanometers spectral shift (typically hypsochromic) as well as significant fluorescence intensity enhancement. The effect can be used for a controlled preparation of scintillating resins with enhanced emission properties and fine adjustment of the emission spectrum for a particular sensor application.
Supplementary materials
For supplementary material for this article, please visit http://dx.doi.org/10.1557/mrc.2015.38
Acknowledgment
This work was supported by the Defense Threat Reduction Agency, Basic Research Award #HDTRA1-12-1-0012, to Clemson University.