I. INTRODUCTION
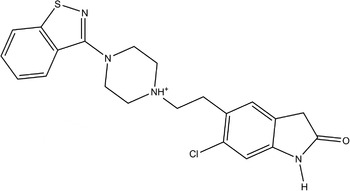
Ziprasidone hydrochloride monohydrate (marketed as Geodon or Zeldox) is an FDA-approved oral formulation of ziprasidone. It acts as an atypical antipsychotic used for the treatment of schizophrenia and bipolar disorder (Greenberg and Citrome, Reference Greenberg and Citrome2007). The systematic name (CAS registry number 138982-67-9) is 5-[2-[4-(1,2-benzisothiazol-3-yl)piperazin-1-yl]ethyl]-6-chloroindolin-2-one hydrochloride hydrate. A two-dimensional molecular structure diagram is shown in Figure 1.
The molecular structure of the ziprasidone cation.

The presence of high-quality reference powder patterns in the Powder Diffraction File (PDF; ICDD, Reference Kabekkodu2014) is important for phase identification, particularly by pharmaceutical, forensic, and law enforcement scientists. The crystal structures of a significant fraction of the largest dollar volume pharmaceuticals have not been published, and thus calculated powder patterns are not present in the PDF-4 databases. Sometimes experimental patterns are reported, but they are generally of low quality. This structure is a result of collaboration among ICDD, Illinois Institute of Technology (IIT), Poly Crystallography Inc., and Argonne National Laboratory to measure high-quality synchrotron powder patterns of commercial pharmaceutical ingredients, include these reference patterns in the PDF, and determine the crystal structures of these active pharmaceutical ingredients (APIs).
Even when the crystal structure of an API is reported, the single crystal structure was often determined at low temperature. Most powder measurements are performed at ambient conditions. Thermal expansion (often anisotropic) means that the peak positions calculated from a low-temperature single-crystal structure often differ significantly from those measured at ambient conditions. These peak shifts can result in failure of default search/match algorithms to identify a phase, even when it is present in the sample. High-quality reference patterns measured at ambient conditions are thus critical for easy identification of APIs using standard powder diffraction practices.
II. EXPERIMENTAL
Ziprasidone hydrochloride monohydrate was purchased from the United States Pharmacopeia (USP) (Lot FOJ028), and was used as-received. The white powder was packed into a 1.5 mm diameter Kapton capillary, and rotated during the measurement at ~50 cycles s−1. The powder pattern was measured at 295 K at beam line 11-BM (Lee et al., Reference Lee, Shu, Ramanathan, Preissner, Wang, Beno, Von Dreele, Ribaud, Kurtz, Antao, Jiao and Toby2008; Wang et al., Reference Wang, Toby, Lee, Ribaud, Antao, Kurtz, Ramanathan, Von Dreele and Beno2008) of the Advanced Photon Source at the Argonne National Laboratory using a wavelength of 0.413 914 Å from 0.5° to 50° 2θ with a step size of 0.001° and a counting time of 0.1 s step−1. The pattern was indexed on a primitive triclinic unit cell having a = 7.2494, b = 10.9937, c = 14.0771 Å, α = 83.437, β = 80.602, γ = 87.158°, V = 1099.06 Å3, and Z = 2 using N-TREOR incorporated into EXPO2013 (Altomare et al., Reference Altomare, Cuocci, Giacovazzo, Moliterni, Rizzi, Corriero and Falcicchio2013). A search of this cell in the Cambridge Structural Database (Allen, Reference Allen2002) yielded 73 hits, but no crystal structure for ziprasidone hydrochloride monohydrate. The space group was assumed to be P-1, which was confirmed by successful solution and refinement of the structure.
A ziprasidone cation was built and its conformation optimized using Spartan ‘14 (Wavefunction, 2013), and saved as a mol2 file. This file was converted into a Fenske–Hall Z-matrix file using OpenBabel (O'Boyle et al., Reference O'Boyle, Banck, James, Morley, Vandermeersch and Hutchison2011). This molecule, a chlorine atom, and an oxygen atom (for the water molecule) were used to solve the structure with FOX (Favre-Nicolin and Černý, Reference Favre-Nicolin and Černý2002). The maximum sinθ/λ used in the solution was 0.40 Å−1. The oxygen atom moved too close to the Cl, and was removed from the initial refinements. A reasonable oxygen was the highest peak in a difference Fourier map, and the oxygen O51 was added at that position. Initial positions of the active hydrogens were deduced by analysis of potential hydrogen-bonding patterns.
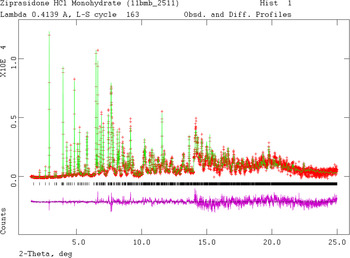
Rietveld refinement was carried out using GSAS (Larson and Von Dreele, Reference Larson and Von Dreele2004). Only the 1.5°–25° portion of the pattern (d min = 0.96 Å) was included in the refinement. All non-hydrogen bond distances and angles were subjected to restraints, based on a Mercury/Mogul Geometry Check (Bruno et al., Reference Bruno, Cole, Kessler, Luo, Motherwell, Purkis, Smith, Taylor, Cooper, Harris and Orpen2004; Sykes et al., Reference Sykes, McCabe, Allen, Battle, Bruno and Wood2011) of the molecule. The Mogul average and standard deviation for each quantity were used as the restraint parameters. The C4–C9 and C34–C39 aromatic rings were subjected to a planar restraint with a standard deviation of 0.01 Å. The restraints contributed 4.05% to the final χ 2. Isotropic displacement coefficients were refined, grouped by chemical similarity. The hydrogen atoms were included in calculated positions, which were recalculated during the refinement. The U iso of each hydrogen atom was constrained to be 1.3 times that of the heavy atom to which it is attached. The peak profiles were described using profile function number 4 (Thompson et al., Reference Thompson, Cox and Hastings1987; Finger et al., Reference Finger, Cox and Jephcoat1994), which includes the Stephens (Reference Stephens1999) anisotropic strain broadening model. The background was modeled using a six-term shifted Chebyshev polynomial. The final refinement of 104 variables using 23 576 observations yielded the residuals R wp = 0.067, R p = 0.054, and χ2 = 1.796. The largest peak (2.17 Å from H48) and hole (1.24 Å from C29) in the difference Fourier map were 0.30 and −0.31 e (Å−3), respectively. The Rietveld plot is included as Figure 2. The largest errors are subtle mis-fits in the shapes of the low-angle peaks, and may reflect subtle changes in the specimen during the measurement.
(Color online) The Rietveld plot for the refinement of ziprasidone hydrochloride monohydrate. The red crosses represent the observed data points, and the green line is the calculated pattern. The magenta curve is the difference pattern, plotted at the same vertical scales as the other patterns. The vertical scale has been multiplied by a factor of 5 for 2θ > 7.3°, and by a factor of 20 for 2θ > 14.0°.

A density functional geometry optimization (fixed experimental unit cell) was carried out using CRYSTAL09 (Dovesi et al., Reference Dovesi, Orlando, Civalleri, Roetti, Saunders and Zicovich-Wilson2005). The basis sets for the H, C, N, and O atoms were those of Gatti et al. (Reference Gatti, Saunders and Roetti1994), the basis set for S was that of Lichanot et al. (Reference Lichanot, Apra and Dovesi1993), and the basis set for Cl was that of Apra et al. (Reference Apra, Causa, Prencipe, Dovesi and Saunders1993). The calculation used eight k-points and the B3LYP functional. Re-starting the Rietveld refinement from the density functional theory (DFT)-optimized structure yielded residuals R wp = 0.069 and χ 2 = 1.961. The re-refined structure was essentially identical to the Rieitveld refinement prior to DFT, with a root-mean-square displacement of the non-hydrogen atoms of 0.06 Å.
III. RESULTS AND DISCUSSION
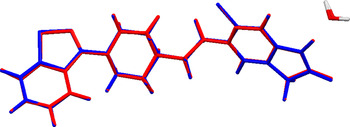
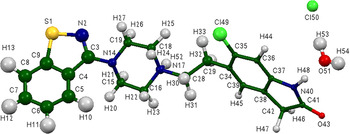
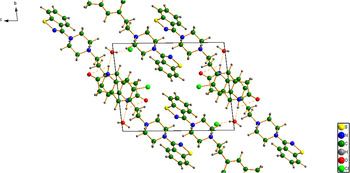
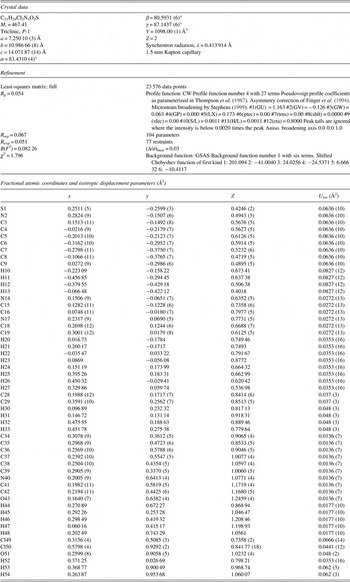
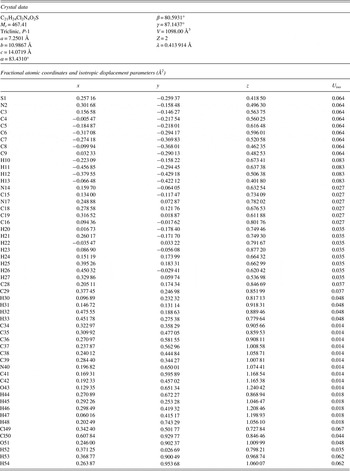
The refined atom coordinates of ziprasidone hydrochloride monohydrate are reported in Table I, and the coordinates from the DFT optimization in Table II. The root-mean-square deviation of the non-hydrogen atoms is 0.12 Å, and the maximum deviation is 0.31 Å, at O43 (Figure 3). The discussion of the geometry uses the DFT-optimized structure. The asymmetric unit (with atom numbering) is illustrated in Figure 4, and the crystal structure is presented in Figure 5.
(Color online) Comparison of the refined and optimized structures of ziprasidone hydrochloride monohydrate. The Rietveld-refined structure is in red, and the DFT-optimized structure is colored blue.

(Color online) The molecular structure of ziprasidone hydrochloride monohydrate, with the atom numbering. The atoms are represented by 50% probability spheroids.

(Color online) The crystal structure of ziprasidone hydrochloride monohydrate, viewed down the a-axis. The hydrogen bonds are indicated by the dashed lines.

Rietveld refined crystal structure of ziprasidone hydrochloride monohydrate.

DFT-optimized (CRYSTAL09) structure of ziprasidone hydrochloride monohydrate.

Most bond distances, all angles, and all torsion angles fall within the normal ranges indicated by a Mercury Mogul Geometry Check. The S1–N2 distance of 1.721 Å (average = 1.672(9) Å, Z-score = 5.52), the S1–C9 distance of 1.757 Å (average = 1.722(15) Å, Z-score = 2.39), and the C35–Cl49 distance of 1.820 Å (average = 1.732(25) Å, Z-score = 3.53) are flagged as unusual. The effect of a change in heavy atom basis set on these optimized distances was not explored.
Both quantum mechanical (DFT/B3LYP functional/6-31G* basis set) and molecular mechanics (MMFF) conformational analyses using Spartan ‘14 suggest that the observed conformation in the solid state is very close (<5 kcal mol−1) to the minimum energy conformation. An analysis of the contributions to the total crystal energy using the Forcite module of Materials Studio (Accelrys, 2013) suggests that the bond and torsion angle distortion contributions are small, while the angle distortion contributions are significant; the five-membered rings are probably strained. The crystal energy appears to be dominated by electrostatic contributions, which in this force-field-based analysis include hydrogen bonds. The hydrogen bonds are better analyzed using the results of the DFT calculation.
As expected, the positively-charged N17 makes a strong hydrogen bond with the chloride anion Cl50 (Table III). The water molecule O51 also makes two weaker hydrogen bonds to Cl50. The water molecule acts as a hydrogen bond acceptor from the ring group N40–H48. There is also a weaker C–H⋯O hydrogen bond to the carbonyl oxygen O43. Each of these hydrogen bonds is discrete. Two water molecules and two chloride anions form a R2,4(8) pattern (Etter, Reference Etter1990; Bernstein et al., Reference Bernstein, Davis, Shimoni and Chang1995; Shields et al., Reference Shields, Raithby, Allen and Motherwell2000). A significant contribution to the packing appears to be stacking of the flat portions of the molecule.
Hydrogen bonds in ziprasidone hydrochloride monohydrate.

The Bravais–Friedel–Donnay–Harker (Bravais, Reference Bravais1866; Friedel, Reference Friedel1907; Donnay and Harker, Reference Donnay and Harker1937) morphology suggests that we might expect platy morphology for ziprasidone hydrochloride monohydrate, with {001} as the principal faces; no preferred orientation correction was necessary for this rotated capillary specimen. The powder pattern of ziprasidone hydrochloride monohydrate is included in the PDF as entry 00-064-1492.
SUPPLEMENTARY MATERIALS AND METHODS
The supplementary material for this article can be found at http://www.journals.cambridge.org/PDJ
ACKNOWLEDGMENTS
Use of the Advanced Photon Source at Argonne National Laboratory was supported by the US Department of Energy, Office of Science, Office of Basic Energy Sciences, under Contract No. DE-AC02-06CH11357. This work was partially supported by the International Centre for Diffraction Data. We thank Lynn Ribaud for his assistance in data collection.