
I. INTRODUCTION
Tungsten heavy alloys (WHAs) are two phase composites consisting of nearly pure tungsten grains dispersed in a low melting temperature ductile matrix of other metals such as iron (Fe), nickel (Ni), cobalt (Co), or copper (Cu). Reference He, He, Li, Liu and Yin1,Reference Yunzhu, Jiajia, Wensheng and Yaxu2 The typical mean tungsten grain size varies from 20 µm to 60 µm depending on the initial particle size, volume fraction of tungsten, sintering temperature, and sintering time. Due to their high density and high strength associated with the bcc tungsten phase, and high ductility attributed to the fcc matrix, these alloys are used in various applications such as kinetic energy penetrators, radiation shielding, counter balance, vibrational damping devices, and other military and civil applications. Reference Patra, Meraj, Pal, Yedla and Karak3,Reference Xia, Huang, Cu and Ge4 During the last two decades, the research of WHAs has concentrated on strengthening methods, which do not compromise their density, that is especially important in military applications. The combination of a powder with a particular microstructure and a consolidation technique that can maintain that microstructure is an effective method for obtaining bulk samples with a unique microstructure.
The mechanical properties of WHAs are determined by various factors; in particular, the strength of W/W and W/matrix interfaces. Reference Oliveira, Costa, De Sousa, Alves, Campos, Santana and Parasad5,Reference Abdel Halim, Bram, Buchkremer and Bahgat6 Microstructural factors, such as tungsten particle size, matrix volume fraction, and tungsten–tungsten contiguity, affect the mechanical properties of WHAs. Reference Rabin and German7
WHAs are usually fabricated by conventional powder metallurgy (PM), which consumes too much sintering time and energy. Reference Shu-dong, Jian-hong, Ying-Li, Yuan-dong, Li-ya and Jun-ming8 Mechanical properties of WHAs such as strength and ductility are low due to the coarse tungsten grain microstructure. Therefore, material researchers have been investigating and exploring new sintering technology to reduce grain size and refine microstructure to improve mechanical properties, such as employing mechanical alloying to increase powder activation and decrease sintering temperature, Reference Ryu, Hong and Reak9 refining grain size by rare earth additions, Reference Fan, Liu, Cheng and Wang10 plasma spraying, Reference Matejicek, Koza and Weinzettl11 and laser sintering. Reference Bagchi, Arvind Kumar, Sarma and Maitra12 Microwave sintering provides a new technological innovation for sintering metal powders. Reference Upadhyaya, Tiwari and Mishra13
Thin, micrometer-thick layers of a new amorphous alloy, Fe–Ni–W, have been obtained by electrodeposition. Reference Mikolaj, Henrikas and Zbigniew14 Electrodeposition under constant current conditions from a citrate-based environmental-friendly bath allows to obtain the three-component, amorphous Fe–Ni–W alloys that are satisfactorily smooth, hard, uniform, of good look, and of good adherence to both copper and steel. The alloys with the Fe mole fraction, [Fe]:([Fe]–[Ni]), approaching unity have the best properties; however, the properties for other stoichiometries do not depart far from these alloys. Reference Mikolaj, Henrikas and Zbigniew14
Powder technology is a novel approach for synthesis of WHAs as well as ferroalloys including reduction and sintering processes. Reference Abdel Halim, Bram, Buchkremer and Bahgat6,Reference Abdel Halim, Bahgat and Fouad15–Reference Bahgat, Paek and Pak19 This kind of technology is mainly based on using blends of metal oxides as starting materials. Due to the application of brittle oxides, homogenization of alloy compounds can be easily achieved by high energy milling. Furthermore, risk of oxygen uptake during milling as a well-known by-product in the case of mechanical alloying of metal powders is avoided reliably. Complete reduction of the oxide blends can be performed either isothermally or nonisothermally at relatively low temperature using a reducing agent e.g., hydrogen gas. The kinetics and mechanism of gaseous reduction process of metal oxides have been investigated by many researchers from different points of view. Reference Pineau, Kanari and Gaballah20–Reference Abdel Halim, Khedr, Nasr and Abdel Wahab24 It was found that the gaseous reduction process of metal oxide mixtures is mainly characterized by a stepwise course of reaction. Usually, the initial reduction of thermodynamically less stable metal oxides eases the reduction of the others. As an example, in the Fe2O3/NiO system the formation of metallic nickel due to reduction of NiO clearly accelerates the reduction rate of iron oxide since Ni acts as catalyst.
Jie Zhu et al. Reference Zhu, Cao and Liu25 studied Fabrication of W–Ni–Fe alloys with radiant structures. A sintering couple of green compacts with compositions of 88W–5Mo–4.9Ni–2.1Fe and 93W–4.9Ni–2.1Fe respectively, were processed by liquid phase sintering. The microstructure and content of binding phase at different regions along the direction perpendicular to the original interface were investigated by scanning electron microscopy (SEM). The distribution of Mo content in composite was determined by energy dispersive analysis (EDS) and the micro hardness in different regions was measured by Vickers micro hardness tester. Results show that the grain size, volume fraction of binding phase, and micro hardness vary gradually due to the graded distribution of molybdenum, which also introduces a solid/liquid interfacial tension gradient and the unbalanced liquid phase pressure serving as the driving force for liquid phase migration during liquid phase sintering.
WHAs with three different compositions (90W–7Ni–3Fe, 93W–4.9Ni–2.1Fe and 95W–3.5Ni–1.5Fe, wt%) were heavily deformed by one pass rapid hot extrusion at 1100 °C with an extrusion speed of ∼100 mm/s and an extrusion ratio of ∼3.33:1. Reference Gong, Fan, Ding, Song and Huang26 The influence of tungsten content on the microstructure and tensile fracture characteristics of the as-extruded alloys was investigated in detail. The results show that tungsten particles in the as-extruded 95W have the largest shape factor compared to the as-extruded 90W and 93W alloys and this implies that the tungsten particles in the as-extruded 95W alloy were subjected to the heaviest plastic deformation.
The effect of swaging on the microstructure and mechanical properties of 93W4.9Ni–2.1Fe alloy was investigated. Reference Yu, Zhang, Yu and Wang27 The alloy was prepared by liquid-phase sintering under hydrogen atmosphere followed by vacuum heat treatment and swaging at 600 °C with different area reductions (ranging from 15.0% to 84.8%). The swaged alloy with area reduction 84.8% exhibits the highest ultimate tensile strength (about 1490 MPa) and the lowest elongation (about 2.5%), which has been attributed to higher fraction of tungsten cleavage.
The present study aims at investigation of synthesis of heavy tungsten alloys (98W–2Fe), (93W–7Fe), and (95W–2Fe–3Ni) via powder reduction technology starting from metal oxides of tungsten, iron, and nickel. The reduction behavior of the oxide mixture was investigated under varying operation conditions. The microstructures of the produced alloy together with the kinetics data obtained from reduction process were used to elucidate the reduction mechanism under isothermal conditions. Afterward, compacts of these alloys were produced by solid state as well as liquid phase sintering of the reduced oxides.
II. EXPERIMENTAL PROCEDURE
A. Alloys synthesis
Heavy tungsten alloys with fixed compositions were produced from metal oxide powder precursors. Analytical reagent (AR) grade oxides of tungsten (WO3, 99.8% metal basis) and iron (Fe2O3, 99.5%) from Alfa Aesar GmbH & Co KG (Karlsruhe, Germany) whereas the NiO powder (99% purity) was processed from J.T. Baker Company (Center Valley, Pennsylvania) have been used in the current study. Amounts of metal oxide powders were calculated to achieve 98W–2Fe, 93W–7Fe, and 95W–2Fe–3Ni alloys composition after reduction. Starting materials in a powder form were strongly blended in mortar agate and then subjected to ball milling process for 2 h to get homogenous powder mixtures.
After homogenization, isothermal reduction behavior of oxide blends was investigated by thermogravimetry in the temperature range between 850 and 1000 °C using pure H2 gas as reducing agent. The course of reduction was followed up by measuring weight loss as a function of time under controlled conditions of reduction temperature. For each reduction experiment, the furnace was heated up to the required reduction temperature. Then the prepared compact (diameter 7 mm, height 5 mm, weight 1.5 g) was placed in a platinum wire basket which was then introduced into the furnace and positioned in the middle of the furnace hot zone. First, purified nitrogen gas was introduced at a flow rate of 0.5 L/min. Then, the sample was held for 10 min at reduction temperature before the reducing gas H2 was introduced at the same flow rate of 0.5 L/min. The weight loss resulting from oxygen removal of the samples was recorded in time intervals of 1 min. At the end of reduction process, the reduced sample was removed from the hot zone and cooled in purified N2. When the temperature dropped below 200 °C, the sample was quenched in pure acetone.
B. Sintering processes
For conducting the sintering study, the mixed oxide compacts were reduced in pure H2 (0.5 L/min) for 90 min. at 900 °C with (30 °C/min) heating rate. Reduced compacts were placed in fused alumina boats and sintered at temperatures of 1200 and 1300 °C with heating rate 30 °C/min and dwell times 30 and 90 min in Ar/4% H2 atmosphere.
The microstructure of the reduced and sintered samples was examined by field emission scanning electron microscopy (FESEM; Quanta FEG250, FEI Company, Hillsboro, Oregon) along with energy-dispersive x-ray spectroscopy (EDX) and optical microscope (Zeiss Axio Scope A1, Carl Zeiss AG, Oberkochen, Germany). X-ray diffraction analysis was carried out for the prepared samples at room temperature and diffraction patterns were obtained by means of a chart recording Philips PW (1790) X-ray diffractometer (Philips, Amsterdam, The Netherlands) using copper (Kα) radiation. Hardness of the sintered specimens was measured using Vickers Microhardness tester (HWDM-7, Phase II Instruments Beijing Ltd., Beijing, China) with 100 g load and dwell time 15 s.
III. RESULTS AND DISCUSSION
A. Effect of reduction temperature
1. Reduction behavior
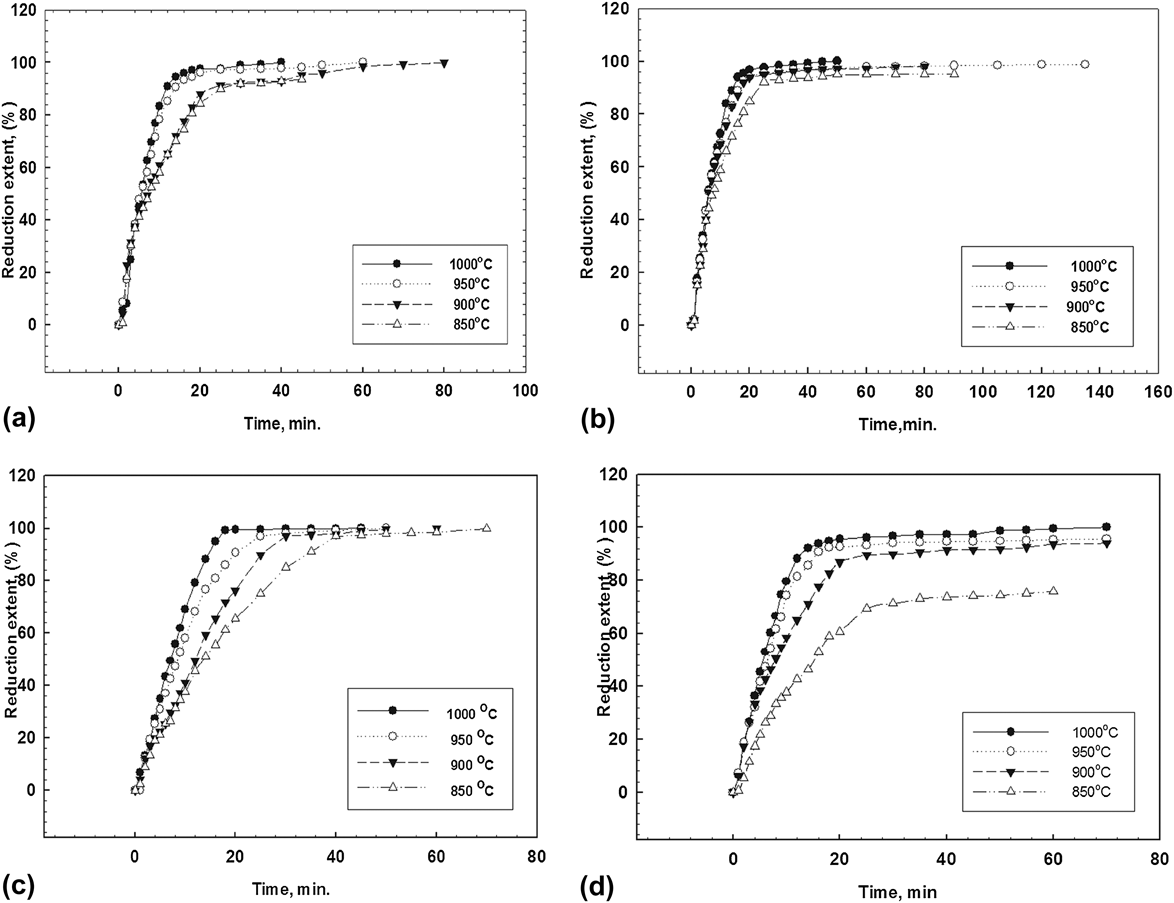
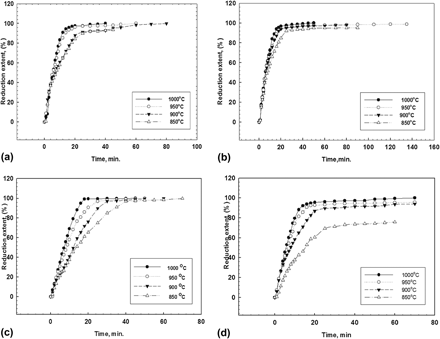
The isothermal reduction behavior of tungsten oxide and oxide blends {W–Fe (98:2), (93:7), and W–Fe–Ni (95:2:3)} was investigated by thermogravimetry in the temperature range 850–1000 °C using pure H2 gas as reducing agent as shown in Figs. 1(a)–1(d), respectively. It was found that for each reduction curve, the rate of reduction was highest at the early stages and decreased as reduction proceeds. The rate of reduction increases with temperature. At 850 °C, all mixed compacts did not attain complete reduction extent which means that this reduction temperature (850 °C) was not enough to produce metallic materials of W and/or Fe–Ni. Such kind of phenomena can be attributed to the nature of reduction behavior of mixed oxide. i.e., the reduction process takes place in a stepwise manner and form lower oxides containing hardly reducible phases. Reference Bahgat, Abdel Halim, El-Kelesh and Nasr28,Reference Abdel Halim, Bahgat, El-Kelesh and Nasr29
Effect of reduction temperature on reduction behavior of (a) pure WO3, (b) 98W2Fe, (c) 93W7Fe, and (d) 95W2Fe3Ni.

2. XRD patterns
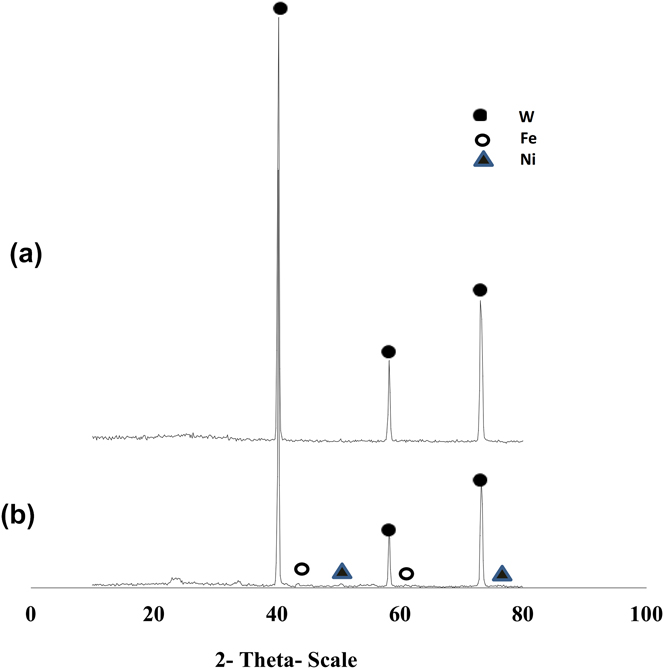
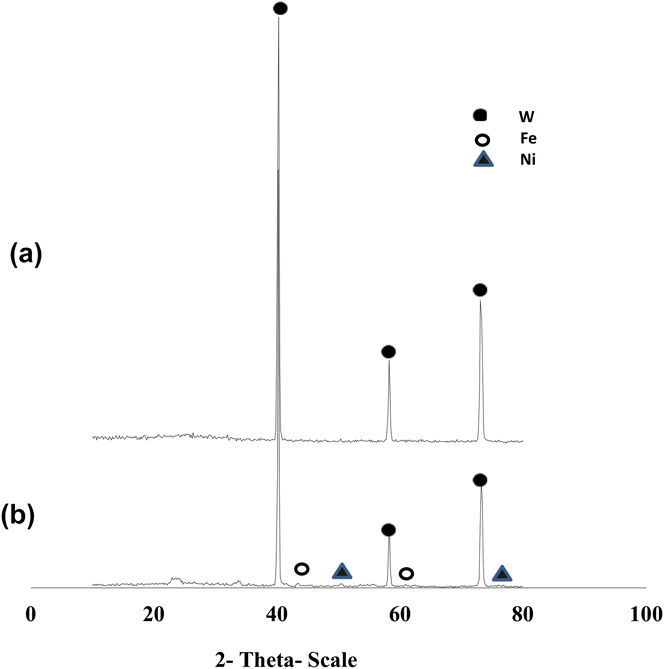
The reduced powder was characterized with x-ray diffraction analysis as shown in Figs. 2(a) and 2(b) for pure W and W–Fe–Ni (95:2:3) alloy, respectively. It was observed that the main peak belonged to bcc tungsten phase and there are small peaks for iron and nickel while there is no evidence for the presence of any residual oxide phase. Pure W, 98W2Fe, 93W7Fe, and 95W2Fe3Ni had the following crystal size 101.7, 97.5, 94.62, and 119.1 nm, respectively. Samples were characterized by energy dispersive x-ray analysis EDX to confirm the elemental contents as shown in Fig. 3 for 95W2Fe3Ni alloy. It can be noticed that the spectrum exhibits signals corresponding to W, Ni, and Fe and EDX analysis reported atomic percents near to those of the prepared alloys.
XRD Chart for samples prepared at 950 °C (a) pure W and (b) 95W2Fe3Ni alloy.
EDX for 95W2Fe3Ni alloy prepared at 950 °C.

3. Powder morphology
The microstructure of pure tungsten and heavy tungsten alloys fabricated at different temperatures (1000 and 900 °C) are examined by FESEM. It can be noticed that cubic grains are formed and their size increased by increasing reaction temperature with denser structure as shown in Figs. 4(a) and 4(b) for pure tungsten and Figs. 4(c) and 4(d) for 98W2Fe alloy, respectively.
SEM micrographs of samples reduced at different temperatures (a) pure W at 900 °C, (b) pure W at 1000 °C, (c) 98W2Fe at 900 °C, and (d) 98W2Fe at 1000 °C.

The microstructures of 93W7Fe alloy fabricated at different temperatures are shown in Fig. 5. It was observed that the alloy formed at lower temperature has cubic structure with different grain sizes but for the alloy formed at higher temperature, rounded-off grain clusters are observed throughout the matrix. On the other hand, 95W2Fe3Ni alloy had grains with relatively irregular shape, while at lower temperatures few fibrous grains could be observed on the structure as shown in Fig. 6. In conclusion, increasing of reduction temperature increases the chance of densification of grains due to sintering process.
SEM micrographs of 93W7Fe reduced at (a) 900° C, (b) and (c) 1000 °C.

SEM micrographs of 95W2Fe3Ni reduced at (a) 900 °C and (b) 1000 °C.

4. Arrhenius plot
To predict the rate controlling mechanism at both the initial and final stages of reduction, the values of apparent activation energy E were calculated using the Arrhenius equation
 $${K_{\rm{r}}} = {K_0}{{\rm{e}}^{ - {{{E_{\rm{a}}}} \over {RT}}}}\quad ,$$
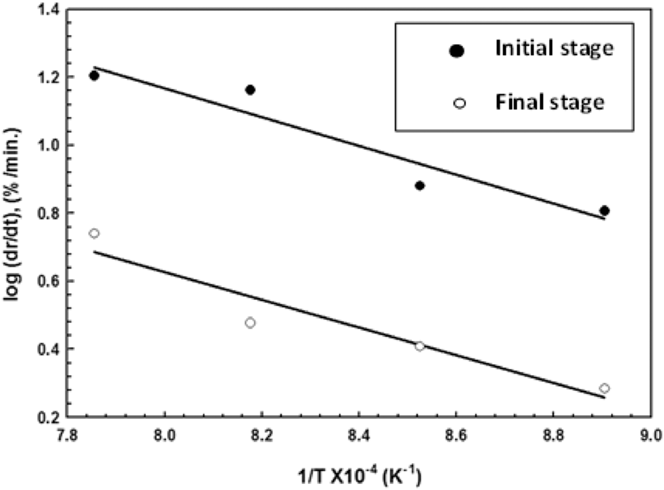
where K r is the reduction rate constant, K 0 is the frequency factor, R is the gas constant, and T is the absolute temperature. The relationships between the logarithm of the rate of reduction (dr/dt) and the reciprocal of the absolute temperature 1/T are plotted at both initial (15%) and final (85%) reaction stages for pure W, 98W2Fe, 93W7Fe, and 95W2Fe3Ni samples for activation energy calculations as shown in Fig. 7 for 93W7Fe alloy.
Arrhenius plot for 93W7Fe samples reduced by H2 gas at both initial and final reaction stages.

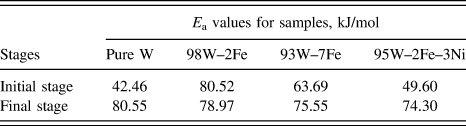
From the obtained results, the apparent activation energy E a values were calculated at initial and final stages, as shown in Table I.
Activation energy values for reduction process at initial and final stages reaction

The calculated activation energy values indicate that the formation of heavy tungsten alloy 98W2Fe and 93W7Fe via gas-solid reduction of metal oxides is most likely controlled by interfacial chemical reaction mechanism at all stages of reduction. For pure W and 95W2Fe3Ni at initial reaction stages the reactions are most likely controlled by combined effect of gas diffusion and chemical reaction mechanisms whereas the final reaction stages are most likely controlled by chemical reaction mechanism. Reference Strangway30
B. Effect of impurity elements
1. Effect of iron
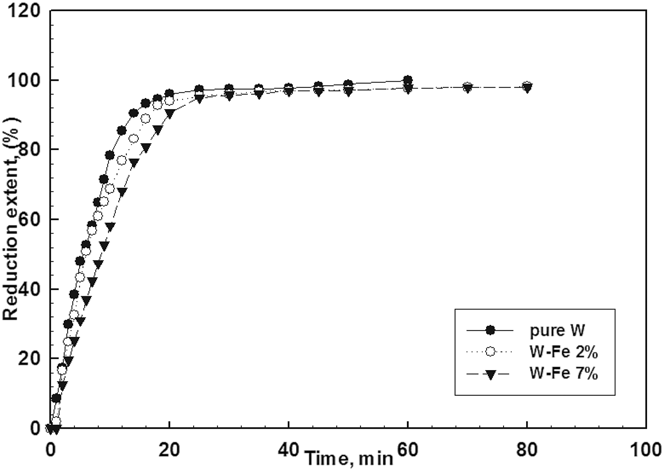
The isothermal reduction behavior of tungsten oxide and oxide blends {W–Fe (98:2) and (93:7)} was investigated by thermogravimetry in the temperature range (850–1000 °C) using pure H2 gas as reducing agent. It was found that the presence of iron oxide decreases the reducibility of WO3 due to formation of lower iron oxides during reduction process as the reduction of iron oxide is stepwise reduction as shown in Fig. 8. Figures 9(a) and 9(b) shows the microstructure of 98W2Fe and 93W7Fe reduced at 900 °C respectively. It can be observed that in case of 98W2Fe alloy many macro- and micro-pores distributed inside a semi-integrated texture which relatively facilitate the access of reducing gas but for 93W7Fe alloy grains are agglomerated and coalesced with lower number larger size pores.
Effect of iron percent on reduction behavior of alloy at 950 °C.

Optical images of (a) 98W2Fe and (b) 93W7Fe formed at 900 °C (x = 500).

2. Effect of Ni
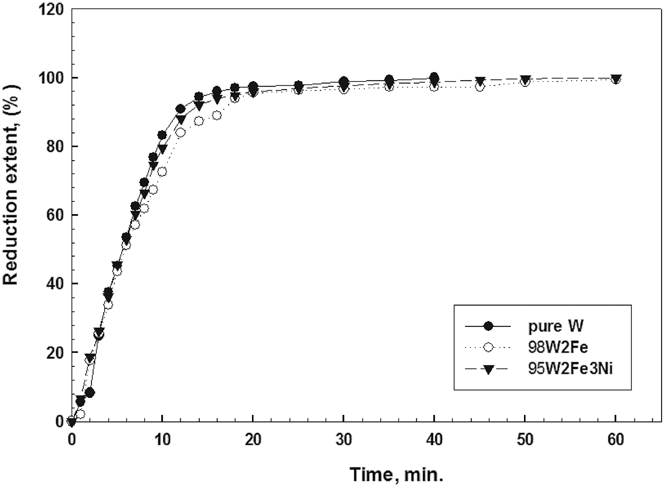
The isothermal reduction behavior of tungsten oxide and oxide blends {W–Fe (98:2) and W–Fe–Ni (95:2:3)} was investigated by thermogravimetry in the temperature range (850–1000 °C) using pure H2 gas as reducing agent. It was found that reducibility of the blended oxides proceeds according to the following order pure W > 95W2Fe3Ni > 98W2Fe as shown in Fig. 10. It can be explained that Ni is easily reduced than Fe, so once Ni metal is formed it will act as a catalyst for the reduction of Fe2O3 and WO3. Reference Pineau, Kanari and Gaballah20–Reference Abdel Halim, Khedr, Nasr and Abdel Wahab24 Figure 11 shows SEM micrographs of pure W, 98W2Fe alloy and 95W2Fe3Ni alloy formed at 1000 °C, it can be noticed that particle coalescence as well as lack of micro-pores was clearly observed in case of 98W2Fe alloy compared to these for 95W2Fe3Ni and pure W. Sintering behavior, densification, and coalescence generally retard reducibility of the samples.
Effect of nickel percent on reduction behavior of alloy at 1000 °C.

SEM micrographs of samples reduced at 1000 °C (a) pure W, (b) 98W2Fe and (c) 95W2Fe3Ni.

C. Effect of sintering parameters
In the present study, heavy tungsten alloy with the following composition 98W2Fe, 93W7Fe, and 95W2Fe3Ni were prepared by powder reduction technique with subsequent sintering. The produced samples of tungsten alloy were subjected to sintering processes at different temperatures (1200 and 1300 °C) and holding time (30 and 90 min) in reducing hydrogen atmosphere. This atmosphere was used to avoid any reoxidation reactions during sintering processes as inert gas (Ar) is sometimes contaminated by traces of oxygen. It was found that sintering parameters, (temperature and time) are greatly affecting the microstructure changes accompanying sintering process. The effect of sintering temperature is shown in Fig. 12(a) and 12(b) for 93W7Fe sintered for 30 min at (1200 and 1300 °C), respectively. It can be noticed that for 93W7Fe sintered at 1200 °C, agglomerated metallic grains are formed in presence of large macro-pores between them. By increasing sintering temperature to 1300 °C semimelted phases started to appear in the structure with smaller pores.
Optical images of 93W7Fe alloy sintered for 30 min at (a) 1200 °C and (b) 1300 °C (x = 200).

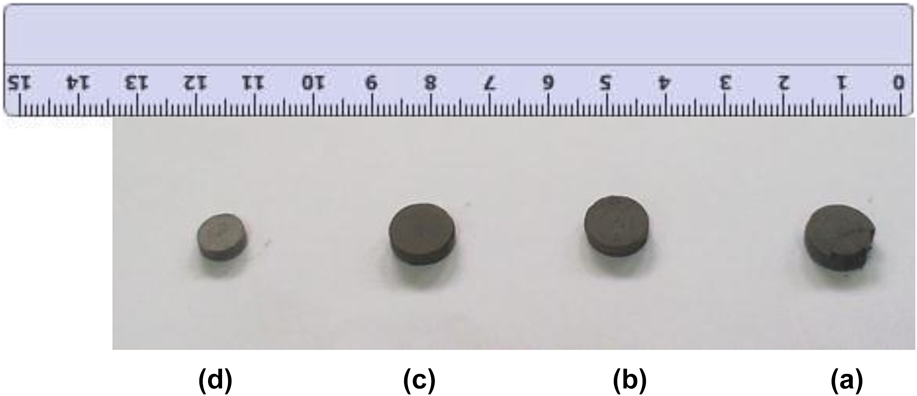
On the other hand, the microstructure of heavy tungsten alloy samples sintered at constant temperature with different holding time are shown in Fig. 13(a) and 13(b) for 95W2Fe3Ni sintered at 1300 °C for 30 and 90 min respectively. It can be observed that increasing holding time leads to increasing sintering and coalescence in the structure that leads to semimelted phases for 95W2Fe3Ni sintered at 1300 °C for 90 min. This results in a considerable shrinkage in 95W2Fe3Ni compact volume after sintering as shown in Fig. 14.
Optical images of 95W2Fe3Ni alloys sintered at 1300 °C for (a) 30 min and (b) 90 min (x = 100).

Digital camera images for alloys sintered at 1300 for 90 min. (a) Pure W, (b) 98W2Fe, (c) 93W7Fe and (d) 95W2Fe3Ni.

D. Microhardness
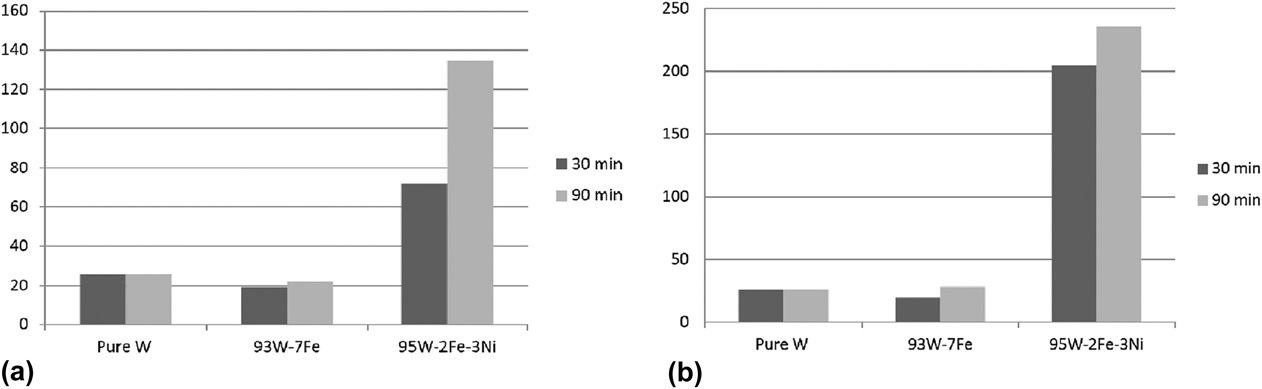
The microhardness for the sintered samples was measured by microhardness tester from Indentic Manufacturer-Germany using ASTME384 as standard material, load 100 g and dwell time 15 s. The results are summarized and shown in Fig. 15. It can be noticed that sintering temperature and dwell time are strongly correlated to the value of hardness. For pure tungsten samples, the effect of sintering temperature and dwell time is insignificant. For samples of 93W–7Fe, it was noticed that the effect of sintering temperature is also negligible at 30 min while it increases slightly by increasing sintering temperature from 1200 °C to 1300 °C at 90 min.
Micro-hardness values of sintered alloys at (a) 1200 °C and (b) 1300 °C.

The trend is completely changed with samples containing Ni (95W–2Fe–3Ni), the hardness values increased with increasing sintering temperature and dwell time. The maximum hardness of 235.3 was achieved for samples containing nickel (95W–2Fe–3Ni) and sintered at 1300 °C for 90 min. It was found that for samples of 95W–2Fe–3Ni sintered at 30 min, the value of hardness increased by about +185% with increasing sintering temperature from 1200 °C to 1300 °C. Reference Jang, Fwu, Chang, Chen and Hsu31 Such high effect is slightly deceased for samples of 95W–2Fe–3Ni sintered at 90 min, the hardness values increased by +75% by increasing temperature from 1200 °C to 1300 °C. Accordingly, it can be concluded that the addition of Ni to form 95W–2Fe–5Ni had strong impact on the value of hardness. This can be attributed to the formation of solid solution between Ni and iron together with the increase of densification processes. Reference Li and Ebrahimi32 This densification appears clearly as the apparent considerable shrinkage in 95W2Fe3Ni compact volume after sintering as shown in Fig. 14.
IV. CONCLUSION
-
(1) Heavy tungsten alloys (98W–2Fe), (93W–7Fe), and (95W–2Fe–3Ni) were synthesized via powder reduction technology from metal oxide powder precursors.
-
(2) The presence of iron oxide decreases the reducibility of WO3 due to formation of lower oxides during reduction process while the presence of NiO increases the reducibility of both iron oxide and tungsten oxide as NiO is easily reduced than FeO.
-
(3) With the increase of sintering temperature and dwell time, porosity of samples decreases forming dense structure which is coupled with the increase of hardness particularly for 95W2Fe3Ni alloy.
-
(4) The calculated activation energy values indicate that the formation of heavy tungsten alloy 98W2Fe and 93W7Fe is most likely controlled by interfacial chemical reaction mechanism at all stages of reduction. For pure W and 95W2Fe3Ni at initial reaction stages the reactions are most likely controlled by combined effect of gas diffusion and chemical reaction mechanisms whereas the final reaction stages are most likely controlled by chemical reaction mechanism.