I. INTRODUCTION
So far there have been great efforts to utilize bulk metallic glasses (BMGs) for structural applications since BMGs provide mechanical properties that cannot be obtained in the counterpart crystalline materials.Reference Salimon, Ashby, Brechet and Greer1, Reference Ashby and Greer2 However, the low ductility of BMGs is still an obstacle for application as structural materials, although some tensile ductility has been reported recently.Reference Hofmann3, Reference Pauly, Gorantla, Wang, Kuhn and Eckert4 Along with the efforts for the development of structural BMGs, there have been attempts to use BMGs for functional applications. In particular, BMGs can be thermoplastically formed into complex geometries over a length scale ranging from 10 nm to a few centimeters due to the presence of a highly viscous supercooled liquid (SCL) region.Reference Kumar, Tang and Schroers5, Reference Schroers6 Using such a high thermoplasticity of BMGs, various fabrication methods including micro/nano imprinting,Reference Saotome, Imai, Shioda, Shimizu, Zhang and Inoue7 blow molding,Reference Schroers, Pham, Peker, Paton and Curtis8 and net-shape formingReference Schroers9 have been successfully applied to produce microsprings,Reference Fukushige, Hata and Shimokohbe10 microgears,Reference Schroers, Nguyen and Desai11 nanowires,Reference Carmo, Sekol, Ding, Kumar, Schroers and Taylor12 etc. Therefore, besides structural BMGs, the recent progress in BMG research shows that more emphasis should be placed on the development of functional BMGs to widen the application area of BMGs. As a result, some successful applications of functional BMGs, e.g., as catalyst for fuel cells and as binder for Si solar cell Ag paste, have been reported recently.Reference Carmo, Sekol, Ding, Kumar, Schroers and Taylor12, Reference Kim, Jee, Lim, Kim, Kim, Lee, Kim, Lee, Lee and Eckert13
Most of the functional applications of BMGs used so far make use of high thermoplasticity and good wetting characteristics in the SCL state; therefore, it is highly required that the SCL of BMGs should have a good oxidation resistance. Most the previous studies have investigated the effect of long-term air exposure on the oxidation behavior in the temperature range of 573–773 KReference Kimura, Asami, Inoue and Masumoto14–Reference Sun, Schneider, Geyer, Johnson and Nicolet23 with the aim to utilize the BMGs for structural application. Under such experimental conditions, the oxidation kinetics is an important aspect for evaluation of the oxidation resistance. However, since the fabrication process in the SCL state for functional application of BMGs should be finished in relatively short time, the oxidation behavior and mechanism need to be examined in more detail under the condition of short-term air exposure in the SCL state.
Therefore, the aim of the present study is to investigate the oxidation behavior of BMGs during continuous heating from room temperature up to well above the crystallization temperature (T x), with special attention on the oxidation resistance in the SCL state. Cu–Zr-based BMGs, which are known to be one of the most widely studied systems related to their oxidation behavior,Reference Kimura, Asami, Inoue and Masumoto14–Reference Liu and Chan22 were selected for the present investigation.
So far, the oxidation behavior of various Cu–Zr-based BMG systems including Cu–Zr,Reference Kimura, Asami, Inoue and Masumoto14 Cu–Zr–Ti,Reference Tam and Shek15–Reference Tam and Shek17 Cu–Zr–Ti–Si,Reference Kai, Kao, Lin, Ren and Jang18 Cu–Zr–Hf–Ti,Reference Tam and Shek19 and Cu–Zr–AlReference Tam, Shek and Wang20, Reference Kai, Ho, Hsieh, Chen, Qiao, Jiang, Fan and Liaw21 glasses has been reported. In the case of binary Cu–Zr metallic glasses, only monoclinic ZrO2 (m-ZrO2) is present in the oxide layer of Zr-rich Cu30Zr70 glass, while a mixture of m-ZrO2, Cu2O, and metallic Cu are present for both Cu50Zr50 and Cu63Zr37 amorphous alloys after room temperature aging for 7–9 years.Reference Kimura, Asami, Inoue and Masumoto14 The oxidation products of ternary Cu–Zr–Ti BMGs are tetragonal ZrO2 (t-ZrO2), Cu oxides (CuO, Cu2O), and metallic Cu at elevated temperatures of 573–773 K.Reference Tam and Shek15 Further detailed studies under long exposure annealing conditions showed that the oxidation proceeds by forming two different oxide layers: a Zr oxide-rich inner layer and a Cu oxide-rich outer layer. Metallic Cu, as an oxidation product, has been found to coexist with ZrO2 in the inner oxide layer.Reference Koster, Jastrow and Meuris16, Reference Tam and Shek17 The oxidation products of Cu–Zr–Al BMGs after long exposure annealing are mainly t-ZrO2, CuO and Cu2O, and minor amounts of m-ZrO2 and Al2O3.Reference Tam, Shek and Wang20, Reference Kai, Ho, Hsieh, Chen, Qiao, Jiang, Fan and Liaw21 Due to the formation of Al2O3 at the topmost layer, it has been shown that Cu–Zr–Al BMGs exhibit much better oxidation resistance than Cu–Zr–Ti BMGs.Reference Tam, Shek and Wang20
In the present study, the oxidation behavior of Cu50Zr50 and Cu46Zr46Al8 metallic glass alloys has been investigated under the condition of short-term air exposure during continuous heating from room temperature up to 1073 K. Addition of Al in Cu–Zr BMG is known to enhance the glass-forming ability and to increase the SCL region.Reference Zhang, Zhang, Xie and Inoue24 Since under the condition of short-term exposure the thickness of the oxide scale will be much smaller than that formed during long-term annealing experiments in most of the previous investigations, we examined the oxidation behavior using melt-spun ribbon samples.
II. EXPERIMENTAL
Alloy ingots with the nominal compositions of Cu50Zr50 and Cu46Zr46Al8 (in at.%, hereafter will be referred to as CZ and CZA, respectively) were produced by arc-melting high-purity metals with purities of 99.9% or higher under argon atmosphere in a water-cooled copper crucible. Rapidly solidified ribbons were prepared by remelting the alloys in quartz tubes and ejecting the melt with an overpressure of 50 kPa through a nozzle onto a copper wheel rotating with a surface velocity of 40 m/s.
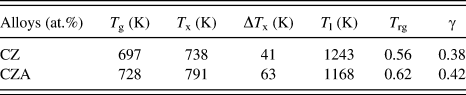
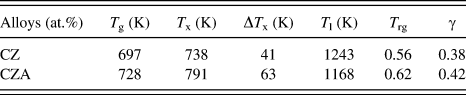
The structure and the thermal stability of the melt-spun ribbon samples were examined using x-ray diffractometry (XRD; D8 DISCOVER, Bruker AXS, Billerica, MA), differential scanning calorimetry (Perkin Elmer DSC 7, Waltham, MA), and differential thermal analysis (Perkin Elmer DTA 7, Waltham, MA) at a heating rate of 40 K/min. The XRD results showed that the CZ and CZA melt-spun ribbon samples have a single amorphous structure. Thermal analysis revealed that the glass transition temperature (T g) and the crystallization onset temperature (T x) of the CZ and CZA samples are 697 and 738 K and 728 and 791 K, respectively. The thermal properties of the BMGs investigated in the present study are given in Table I.
Thermal properties of the melt-spun Cu50Zr50 (CZ) and Cu46Zr46Al8 (CZA) amorphous alloys (heating rate 40 K/min): glass transition temperature T g, crystallization temperature T x, supercooled liquid region ΔT x, liquidus temperature T l, reduced glass transition temperature T rg = T g/T l, and γ = T x/(T g + T l); T rg and γ parameters represent the ability to avoid crystallization during cooling.
The oxidation tests were performed by using a thermogravimetric analyzer (TGA; Perkin Elmer TGA 4000) in high-purity dry air (>99.99%). To evaluate the oxidation resistance applicable to thermoplastic forming or wetting in the SCL state, no surface pretreatment was conducted on the melt-spun ribbon samples before the oxidation experiments. For each experiment, the net flow rate of air was kept constant at 20 cm3/min and the sample was continuously heated in the TGA furnace up to the maximum temperature of 1073 K with a heating rate of 40 K/min. Characterization of the oxidation scales was performed using XRD, scanning electron microscopy (SEM; FEI Helios NanoLab, Hillsboro, OR), and transmission electron microscopy (JEOL 2010F, Tokyo, Japan) equipped with an energy dispersive spectrometer (EDS; Oxford Instruments INCA x-act 51-ADD0069, Oxfordshire, UK). To observe the full cross section of the oxide layer, the samples were prepared using a focused ion beam milling equipment (Dual-beam FIB, FEI Helios NanoLab). Composition depth profiles of the oxidized samples were obtained using Auger electron spectroscopy (PHI-700, ULVAC-PHI, Kanagawa, Japan) with the electron beam energy set at 20 keV.
III. RESULTS
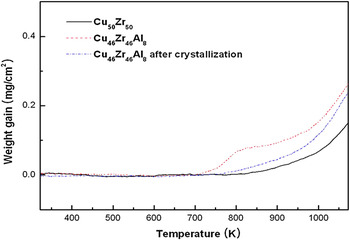
Figure 1 shows the mass gain–temperature plot obtained for the CZ and CZA ribbon samples upon continuous heating in the TGA with a heating rate of 40 K/s up to 1073 K. For comparison, the mass gain–temperature plot obtained for crystallized CZA is included and will be discussed in Section IV.B. A monotonous increase of the sample weight with increasing temperature is observed for the CZ sample. No weight gain is detectable up to ∼770 K (∼32 K above T x) within the resolution limit of the TGA, and the weight gain gradually increases from ∼770 up to 1073 K. In the case of the CZA sample, the sample weight increases in two steps. No weight gain is detectable up to ∼700 K, but the weight gain sharply increases up to ∼806 K. Above ∼806 K, the sample weight further increases but with a much reduced rate. When considering the T g and T x of the CZA sample, the weight gain rate begins to sharply increase when the sample temperature reaches the onset of the glass transition (714 K) and then decreases when the sample temperature is raised above the crystallization offset temperature (804 K), indicating that the oxidation rate strongly increases in the SCL region. Apparently, the oxidation rates of the crystallized CZ and CZA samples are almost identical.
Weight gain–temperature plots for Cu50Zr50 (CZ) and Cu46Zr46Al8 (CZA) metallic glasses during continuous heating at 40 K/min up to 1073 K in the thermogravimetric analyzer.

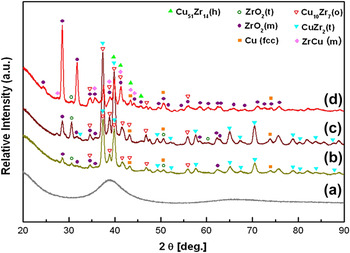
Figure 2(a) shows a XRD pattern obtained from the as-spun CZ ribbon sample, confirming its amorphous structure without any evidence for detectable crystallinity. Figure 2(d) reveals that after heating up to 1073 K in TGA, the glass phase devitrifies into a mixture of ZrCu, Cu10Zr7, and Cu51Zr14, while the oxidation product is mostly m-ZrO2 with a very tiny fraction of t-ZrO2. A small fraction of metallic Cu is also present. To investigate the oxidation procedure in the intermediate temperature range, the samples were annealed in the TGA for 1 h at the temperatures of T g (697 K) and T x (738 K) since the weight gain during continuous heating up to T g and T x was negligible. Figure 2(b) reveals that the glassy phase partially devitrifies into Cu10Zr7 and CuZr2 and the amount of oxides (m- and t-ZrO2) is very small after annealing at T g for 1 h. After annealing at higher temperature (T x) for 1 h [Fig. 2(c)], the devitrification products are still Cu10Zr7 and CuZr2, but the amount of oxides (m- and t-ZrO2) increases significantly. Figures 2(b) and 2(c) show that a detectable amount of metallic Cu is present after annealing at T g and T x. The XRD results indicate that the devitrification sequence of the CZ ribbon is Cu10Zr7 + CuZr2 → CuZr + Cu10Zr7 + Cu51Zr14 and the oxidation products are m-ZrO2, t-ZrO2, and metallic Cu. As the oxidation proceeds to higher temperature, i.e., up to 1073 K, the oxidation product consists mostly of m-ZrO2; however, at the intermediate temperature range such as around T x, a considerable amount of t-ZrO2 is present in the oxide scale.
X-ray diffraction (XRD) patterns obtained for CZ metallic glass: (a) as-spun state; (b) after holding for 1 h at Tg (697 K); (c) after holding for 1 h at T x (738 K); (d) after continuous heating at 40 K/min up to 1073 K.

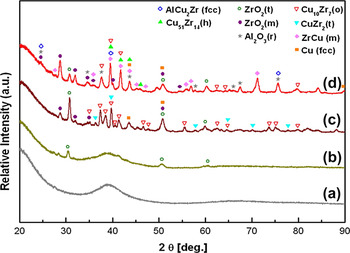
Figure 3(a) shows a XRD pattern obtained from the as-quenched CZA sample, confirming its amorphous structure. Figure 3(d) reveals that after heating up to 1073 K in TGA, the glass phase devitrifies into ZrCu, Cu10Zr7, Cu51Zr14, and AlCu2Zr, while the oxide layer consists of m-ZrO2, t-ZrO2, and Al2O3. Comparison of the peak intensities indicates that m-ZrO2 is dominant in the oxide layer. As in the CZ sample, metallic Cu is also present in the oxide layer. Since the CZA sample exhibits a considerable weight gain during continuous heating above T g in the TGA (Fig. 1), XRD analysis was performed for the samples continuously heated up to 758 (in the SCL region) and 873 K (after crystallization) in the TGA. After heating up to 758 K [Fig. 3(b)], the sample almost retains its amorphous structure and only the sample surface is oxidized forming t-ZrO2, indicating that oxidation proceeds first before devitrification in the SCL region. At the higher temperature of 873 K [Fig. 3(c)], devitrification of the glass results in the formation of Cu10Zr7 and CuZr2. The oxide layer consists mostly of t-ZrO2 with minor fractions of m-ZrO2 and metallic Cu. The results displayed in Fig. 3 reveal that the devitrification sequence of the CZA sample is basically the same as that of the CZ sample, but an additional crystalline phase, i.e., AlCu2Zr, appears for the CZA ribbon. After heating up to the intermediate temperatures (758 and 873 K), t-ZrO2 is dominant in the oxide layer. On the contrary, after heating up to 1073 K, m-ZrO2 becomes dominant and Al2O3 forms in the oxide layer.
XRD patterns obtained for CZA metallic glass: (a) as-spun state; (b) after continuous heating up to 758 K; (c) after continuous heating at 40 K/min up to 873 K; (d) after continuous heating at 40 K/min up to 1073 K.

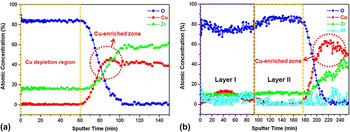
Figures 4(a) and 4(b) display Auger concentration depth profiles obtained for the CZ and CZA samples after continuous heating up to 1073 K. For CZ, the oxide layer with a thickness of ∼1 μm [Fig. 5(a)] is composed of Zr oxide with a constant composition ratio of Zr and O. Cu is completely depleted in the oxide layer. (Here, the measured Zr content is relatively lower than expected from the composition of ZrO2 due to different acquisition ratios of each element in the oxide layer and the crystallized matrix. However, the information on the distribution of each element in the oxide layer can be obtained from the depth profile.) Below the oxide layer, a Cu-enriched zone appears, as marked in Fig. 4(a). In the case of the CZA sample [the thickness of the oxide layer is ∼1.4 μm from Fig. 5(b)], the composition of each element in the oxide layer is not constant as in the CZ sample: The outer layer [marked as Layer I in Fig. 4(b)] is slightly enriched in Al and Cu when compared with the inner layer [marked as Layer II in Fig. 4(b)]. Examination of the element distribution in Layer I indicates that (i) the Zr content is almost constant, but the Cu and Al contents are not constant and (ii) the distribution of oxygen is not homogeneous, i.e., when Cu is enriched, the oxygen level decreases. The results imply that the Layer I consists of Zr and Al oxide and metallic Cu. On the other hand, in Layer II, Zr and O are homogeneously distributed, but Cu and Al are almost completely depleted, implying that Layer II mostly consists of Zr oxide. Below the oxide layer, a Cu-enriched zone appears, as marked in Fig. 4(b). It can be noticed from Fig. 4(b) that Al is also slightly enriched below the oxide layer (Layer II).
Auger concentration depth profiles obtained for: (a) CZ metallic glass and (b) CZA metallic glass.

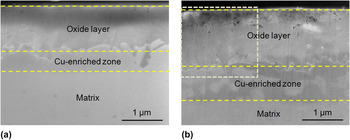
Cross-sectional scanning electron microscopic images showing the oxide layer, the Cu-enriched zone, and the crystallized matrix for: (a) CZ metallic glass and (b) CZA metallic glass.

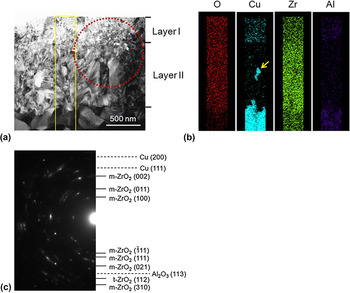
The SEM images in Figs. 5(a) and 5(b) show the cross section of the oxide layers in the CZ and CZA samples after continuous heating up to 1073 K. The SEM images were obtained from thin samples sectioned using FIB. As marked in the figures, the oxidized samples consist of three regions: oxide layer, Cu(Al)-enriched zone, and crystallized matrix, which will be analyzed in detail in Figs. 6 and 7. The thicknesses of the oxide layers of the CZ and CZA samples are ∼1 and ∼1.4 μm, respectively. The elemental distribution in the oxidized CZA sample was investigated by EDS mapping analysis. Figure 6(a) shows the scanning transmission electron microscopy (STEM) image obtained from the region marked by the dotted line in Fig. 5(b). Figure 6(b) shows the EDS mapping results for O, Cu, Zr, and Al obtained from the region marked in Fig. 6(a). As expected from the Auger depth profile analysis, the oxide layer consists of two types of layers: Layer I and Layer II, as marked in Fig. 6(a). Oxygen is homogeneously distributed in Layer I and II, while Zr is slightly more enriched in Layer II than in Layer I. A relatively high content of Cu can be detected in Layer I, while only a very small amount of Cu is detected in Layer II. However, occasionally some Cu-enriched islands [as marked by the arrow in Fig. 6(b)] are observed in Layer II. Al is more enriched in Layer I than in Layer II, but a higher Al content is observed below the oxide layer. A very high enrichment of Cu is found below the oxide layer, showing the presence of a Cu(Al)-enriched zone. Figure 6(c) shows the selected area diffraction pattern (SADP) obtained from the region of the oxide layer marked with a circle in Fig. 6(a). Analysis of the SADP supports the presence of t- and m-ZrO2, Al2O3, and metallic Cu in the oxide layer.
(a) Scanning transmission electron microscopy (STEM) image obtained from the region marked by the dotted line in Fig. 5(b); (b) energy dispersive spectrometric mapping results for O, Cu, Zr, and Al obtained from the region marked in Fig. 6(a); (c) selected area diffraction pattern obtained from the region of the oxide layer marked with a circle in Fig. 6(a).

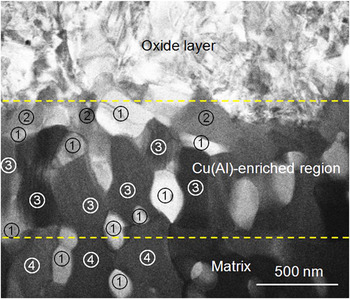
STEM images showing the typical grain structure of the Cu(Al)-enriched region below the oxide layer in CZA metallic glass.

From the XRD, Auger, and EDS analyses results (Figs. 2–6), it is clear that Al2O3 and metallic Cu are mostly present in outer oxide layer (Layer I). When recalling that m-ZrO2 mostly forms during the later stage of continuous heating, then it is understandable that the outer Layer I consists of t-ZrO2, Al2O3, and metallic Cu, while the inner Layer II consists of m-ZrO2 with a small fraction of metallic Cu islands. In a previous report by Kai et al.Reference Kai, Ho, Hsieh, Chen, Qiao, Jiang, Fan and Liaw21 on the long-term exposure oxidation of Cu47.5Zr47.5Al5 BMG (at 673–773 K for 36 h), the oxide layer consists of ZrO2, Cu2O, CuO, and Al2O3. They showed that t-ZrO2 is abundant in the outer oxide layer, while m-ZrO2 is present in the inner layer, supporting our result on the presence of ZrO2 with different crystal structures in Layers I and II. In addition, our results show that metallic Cu is also present in the oxide layer. However, in our case, no Cu oxide is observed due to the much shorter exposure time. Longer exposure will lead to the formation of Cu oxide by diffusion of Cu from the Cu-enriched zone. Liu and ChanReference Liu and Chan22 showed that t-ZrO2 and metallic Cu mainly form in the outer oxide layer of Zr55Cu30Al10Ni5, while m-ZrO2 preferentially forms in the deeper layer of the oxide scale, indicating that if the oxidizing temperature is sufficiently high, m-ZrO2 can become the dominant Zr oxide, which again supports our results.
Figure 7 shows the typical grain structure of the Cu(Al)-enriched region below the oxide layer in the CZA sample. The results of EDS analysis for the grains marked in Fig. 7 are listed in Table II. The chemical compositions measured from each grain can be classified into four types, and all the crystalline phases are enriched in Cu (≥50 at.%). From the measured compositions, the corresponding crystalline phases are determined as AlCu2Zr, Cu70Zr15Al15, Cu51Zr14, and Cu10Zr7. Considering that previously reported crystallization products in Cu–Zr–Al glass are Cu10Zr7, CuZr2, ZrCu, and AlCu2Zr,Reference Kai, Ho, Hsieh, Chen, Qiao, Jiang, Fan and Liaw21, Reference Pauly, Das, Mattern, Kim and Eckert25, Reference Sun, Wei, Wang, Li, Cheung and Shek26 our results show that additional crystalline phases such as AlCu2Zr, Cu70Zr15Al15, and Cu51Zr14 are present due to the high Cu(Al) content in the Cu(Al)-enriched zone caused by oxidation. Below the Cu(Al)-enriched layer, the crystallization products of the glass matrix begin to appear. In Fig. 7, Cu10Zr7 was found only in the bottom region of the micrograph, i.e., below the Cu(Al)-enriched zone.
The results of energy dispersive spectrometer analysis and phase prediction for the grains marked in Fig. 7.

IV. DISCUSSION
A. Oxidation mechanism
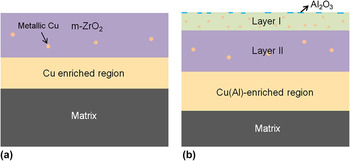
In the present study, the oxidation behavior of CZ and CZA has been analyzed using TGA, XRD, Auger depth profile, and STEM (EDS) analyses. Using samples sectioned by FIB enables to analyze the elemental/phase distribution in the cross section of the oxidized samples in detail. Depending on the alloy composition, the structure of the oxide layer after heating up to 1073 K is different, as shown schematically in Fig. 8. For CZ, the oxide layer mostly consists of m-ZrO2 and a small fraction of metallic Cu [Fig. 8(a)], while for CZA, the oxide layer is comprised of two different layers [Fig. 8(b)]: Layer I consisting of t-ZrO2, Al2O3, and metallic Cu particles; and Layer II consisting m-ZrO2 and a small fraction of metallic Cu islands. For both CZ and CZA, Cu- or Cu(Al)-enriched regions exist below the oxide layer, which consists of Cu51Zr14 (additionally Cu70Zr15Al15 and AlCu2Zr in case of CZA). One of the most striking results in the present study is that there is a large difference in the oxidation resistance of the SCL state depending on the alloy composition, i.e., addition of Al in the Cu–Zr BMG significantly deteriorates the oxidation resistance in the SCL state.
Schematic diagrams showing the oxidation products for: (a) CZ metallic glass and (b) CZA metallic glass after continuous heating at 40 K/min up to 1073 K.

Our results show that when the glassy state is retained during heating in the SCL state, e.g., after holding at T g for 1 h for CZA [Fig. 3(b)], t-ZrO2, which is induced by Al addition,Reference Ho27–Reference Khan, Islam and Bates31 forms as main oxidation product. However, when partial crystallization occurs in the SCL state, e.g., after holding at T g for 1 h for CZ [Fig. 2(b)], a small fraction of m-ZrO2 forms as oxidation product.
As the formation of t-ZrO2 continues in the SCL state, Cu becomes rejected from the growing oxide layer, leading to the formation of a Cu-enriched region in or near the oxide layer. Here, discussion on the formation of Al2O3 is required: Previous studies have shown that Al2O3 forms at temperatures higher than ∼773K upon oxidation of Cu–Zr-based BMGs,Reference Kai, Kao, Lin, Ren and Jang18 and 7-8.7 at.% Al can be solutionized into t-ZrO2 when t-ZrO2 forms, while Al has a very low solubility (∼0.7 at.%) in m-ZrO2.Reference Arhammar, Araujo and Ahuja32 Therefore, in our study, Al is solutionized into t-ZrO2, when the oxidation proceeds in the SCL state, and then Al2O3 forms on the surface of the oxide layer (Layer I) due to the strong affinity with oxygen when the temperature is raised above the crystallization temperature. Therefore, the oxidation products from the SCL state are: t-ZrO2 + metallic Cu for CZ and t-ZrO2 (with solutionized Al) + metallic Cu for CZA, corresponding to Layer I observed in the Auger depth profile (Fig. 4) and the STEM EDS mapping results (Fig. 6).
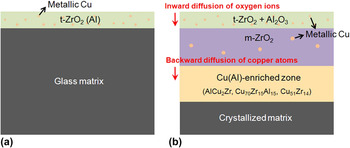
As the crystallization process continues over the temperature range above the SCL region, the major oxidation product for CZA is m-ZrO2 formed on the crystallized matrix. Since Cu and Al have very low solubility in ZrO2,Reference Arhammar, Araujo and Ahuja32, Reference Levin, Robbins and McMurdie33 the growth of the m-ZrO2 layer is accompanied with by rejection of Cu and Al, leading to the formation of Layer II shown in Figs. 4(b) and 6. Some of the rejected Cu will form metallic Cu islands in the m-ZrO2 oxide layer, as shown in Fig. 6(b), but most of the rejected Cu(Al) will diffuse backwards toward the oxide/matrix interface, forming a Cu(Al)-enriched zone below the oxide layer. Previous studies on long-term oxidation of Cu–Zr-based BMGsReference Tam and Shek15–Reference Tam and Shek17, Reference Liu and Chan22 have shown that Cu atoms diffuse in the outward direction (toward the top surface) to provide the growth kinetics for ZrO2. However, the present study shows that backward diffusion of Cu toward the oxide/matrix interface and inward diffusion of oxygen through the oxide layer are the rate controlling parameters. The present result is consistent with Sun et al.’s result,Reference Sun, Schneider, Geyer, Johnson and Nicolet23 which has shown that a Ni-enriched region is formed at the oxide/matrix interface by the rejection of Ni from growing Zr and Al oxides in a Zr60Al15Ni25 BMG. However, as the oxidation proceeds, excessive accumulation of Cu at the oxide/matrix interface leads to outward diffusion of Cu atoms from the interface to the top surface, thus forming Cu oxide in the outer layer providing the kinetics for m-ZrO2 growth, as previously reported for the long-term exposure experiments.Reference Tam and Shek15–Reference Tam and Shek17, Reference Liu and Chan22 Sun et al.’s resultReference Sun, Schneider, Geyer, Johnson and Nicolet23 on oxidation of Zr60Al15Ni25 BMG does not show outward diffusion of Ni since they analyzed thin oxide layers (<1 μm) of which the scale is similar to that investigated in the present study. The schematic diagrams in Figs. 9(a) and 9(b) explain the oxidation mechanism of the CZA metallic glass investigated in the present study. Figure 9(a) illustrates the formation of t-ZrO2(Al) and metallic Cu particles during oxidation in the SCL state, while Fig. 9(b) depicts the mechanism for the formation of a m-ZrO2 layer by inward diffusion of oxygen ions from the top surface and backward diffusion of Cu(Al) toward the oxide/matrix interface when oxidation of the crystallized matrix occurs.
Schematic diagrams explaining the oxidation mechanism of CZA metallic glass: (a) formation of tetragonal ZrO2 (Al) and metallic Cu particles during oxidation in the supercooled liquid state and (b) the formation of a monoclinic ZrO2 layer by inward diffusion of oxygen ions from the top surface and backward diffusion of Cu toward the oxide/matrix interface when oxidation occurs on the crystallized matrix.

B. Oxidation resistance in the SCL region
As mentioned in the introduction section, one of the important aspects to be considered carefully for the application of BMGs for functional use is their oxidation resistance in the SCL region. The present results show that the oxidation resistance in the SCL region significantly varies depending on the alloy chemistry even in the same Cu–Zr-based system. The total weight gain after heating up to 1073 K is strongly influenced by the oxidation behavior in the SCL region (Fig. 1). The larger weight gain observed for CZA (Fig. 1) is due to its higher oxidation rate in the SCL region. The TGA curve obtained from the crystallized CZA sample included in Fig. 1 shows a monotonous weight increase similar to the CZ glass sample, supporting that oxidation in the SCL state is the most influential aspect for the final weight gain in the TGA analysis. It seems that the more active oxidation in the SCL region of the CZA sample is caused by the presence of Al during the formation of t-ZrO2 on the surface of the SCL. The solutionizing of Al in ZrO2 leads to a higher oxygen ion vacancy concentrationReference Ho27–Reference Khan, Islam and Bates31 and, therefore, the oxygen ions can move more easily through the oxygen ion vacancies in t-ZrO2.Reference Khan, Islam and Bates31 Under such circumstances, the SCL is prone to be more readily oxidized due to the larger activity of the oxygen ions.
V. CONCLUSIONS
In the present study, the oxidation behavior of CZ and CZA during continuous heating up to 1073 K has been analyzed using TGA, XRD, SEM, Auger depth profile, and STEM (EDS) analyses. The major conclusions are as follows:
(i) For CZ, the oxide layer mostly contains of m-ZrO2 and a small fraction of metallic Cu, while for CZA, the oxide layer consists of two different layers: an outer layer (Layer I) comprised of t-ZrO2, Al2O3, and metallic Cu, and an inner layer (Layer II) consisting of m-ZrO2 with a small fraction of metallic Cu islands. For both CZ and CZA, a Cu or Cu(Al)-enriched region exists below the oxide layer, which consists of Cu51Zr14 (additionally Cu70Zr15Al15 and AlCu2Zr in CZA).
(ii) Layer I forms as first oxidation product in the SCL state of CZA metallic glass. As the crystallization process continues over the temperature range above the SCL region, the major oxidation product changes from t-ZrO2 to m-ZrO2 formed on the crystallized matrix. Backward diffusion of Cu toward the oxide/matrix interface and inward diffusion of oxygen through the oxide layer are the rate controlling parameters determining the kinetics of m-ZrO2 growth.
(iii) The oxidation resistance in the SCL region significantly varies depending on the alloy chemistry even in the same Cu–Zr-based system. The larger weight gain observed for CZA after heating up to 1073 K is due to its higher oxidation rate in the SCL region. The active oxidation in the SCL region of the CZA sample is caused by the presence of Al during the formation of t-ZrO2 since the solutionizing of Al in ZrO2 leads to a higher oxygen ion vacancy concentration, enabling more easy movement of oxygen ions through the oxygen ion vacancies.
The present results show that the oxidation resistance in the SCL state sensitively depends on the alloy chemistry of BMGs even in the same family of Cu–Zr-based BMGs, indicating that further efforts are required to design and tailor BMGs with high oxidation resistance in the SCL state.
ACKNOWLEDGMENTS
This work was supported by the Samsung Advanced Institute of Technology and the Global Research Laboratory Program of the Korean Ministry of Education, Science, and Technology. K.R. Lim acknowledges the support from the Second Stage of Brain Korea 21 Project. Stimulating discussions with K.B. Kim, N. Mattern, S. Oswald, and E.S. Park are gratefully acknowledged.