INTRODUCTION
Radiocarbon (14C) dating of lake sediment cores could be used to develop the chronology of lakes as old as ~50,000 yr (Geyh et al. Reference Geyh, Grosjean, Núñez and Schotterer1999; Hodell et al. Reference Hodell, Brenner, Kanfoush, Curtis, Stoner, Xueliang, Yuan and Whitmore1999). However, lake sediments are a mixture of autochthonous and various allochthonous sources with different residence times and consequently, distinct 14C activities, thus the 14C dating of sediments could yield ages older than their true age. The 14C reservoir age in sediments can vary from <200 to several thousand years (Abbott et al. Reference Abbott and Stafford1996; Hou et al. Reference Hou, D’Andrea and Liu2012; Mischke et al. Reference Mischke, Weynell, Zhang and Wiechert2013; Schneider et al. Reference Schneider, Pain, Haberle, Blong, Alloway, Fallon, Hope, Zawadzki and Heijnis2018). The reservoir age depends on the lake watershed geology and hydrology (lake size, lake water residence time, weathering of soil carbonates, presence of peatlands in the watershed) influence on old carbon import and accumulation (the inherited age) as well as the carbon exchange rate with the atmosphere (the residence age) (Hendy et al. Reference Hendy and Hall2006).
The main modern carbon source in sediments is terrestrial plants, fixing atmospheric CO2 and reflecting the approximately real age of sediment depositions (Abbott et al. Reference Abbott and Stafford1996; Philippsen Reference Philippsen2013). In turn, some types of allochthonous OM, such as soil, could be depleted in 14C. Autochthonous sedimentary OM originates from planktonic and benthic algae and macrophytes that fix the dissolved inorganic carbon (DIC), and thus, these autochthonous sources reflect the isotope composition of the consumed carbon. The DIC concentration and the isotope composition depend on various factors such as transportation (Fontes et al. Reference Fontes, Gasse and Gibert1996), the rates of organic carbon production and mineralization, as well as carbonate weathering and dissolution (Gale et al. Reference Gale, Reddy and Graetz1992; Dean Reference Dean1999; Bastviken et al. Reference Bastviken, Persson, Odham and Tranvik2004; Penning et al. Reference Penning, Claus, Casper and Conrad2006; Conrad et al. Reference Conrad, Claus and Casper2009). All these processes impact water and atmospheric CO2 exchange rates (Abbott et al. Reference Abbott and Stafford1996; Tranvik et al. Reference Tranvik, Downing, Cotner, Loiselle, Striegl, Ballatore and Dillon2009; Williamson et al. Reference Williamson, Saros, Vincent and Smol2009), thus influencing the ability of aquatic plants to uptake atmospheric CO2 (modern carbon source).
Anthropogenic activities (such as agricultural practices, dam construction, wastewater discharge, greenhouse gas emissions, atmospheric pollutant deposition) and climate changes affect the lake ecosystem state by changing the import and export regime of organic and inorganic matter, including the transformation process in sediments and the water column, as well as exchange with the atmosphere (Hou et al. Reference Hou, D’Andrea and Liu2012; Hillman et al. Reference Hillman, Abbott, Yu, Steinman and Bain2016; Li et al. Reference Li, Qiang, Zhang, Huang, Zhou, Chen, Wang and Zhao2017; Wang et al. Reference Wang, Das, Xu, Liu, Jahan, Means, Donoghue and Jiang2018; Winogradow et al. Reference Winogradow and Pempkowiak2018; Wang et al. Reference Wang, Chen, Kang, Hu and Wang2019; Zhang et al. Reference Zhang, Zhao, Zhou, Zhang, Wang and Shen2019) Thus, these changes are reflected in the lake carbon pool. Stable isotope ratio analysis in carbonates and sedimentary OM, concentration measurements of carbon (C), nitrogen (N) in sedimentary OM, as well as pigment analysis have been used for the reconstruction of events related with any changes in the climate and status of the lake ecosystem over a few decades (Brenner et al. Reference Brenner, Whitmore, Curtis, Hodell and Schelske1999; Vreca et al. Reference Vreca and Muri2006; Torres et al. Reference Torres, Inglett, Brenner, Kenney and Reddy2012; Woszczyk et al. Reference Woszczyk, Grassineau, Tylmann, Kowalewski, Lutyńska and Bechtel2014). During the last few years publications appeared, offering to use the reservoir age as a proxy in these studies Zhou et al. (Reference Zhou, Chen, Wang, Yang, Qiang and Zhang2009, Reference Zhou, Cheng, Jull, Lu, An, Wang, Zhu and Wu2014, Reference Zhou, He, Wu, Zhang, Zhang, Liu and Yu2015).
In Lithuania, previous studies covering the Late-Holocene natural or human induced environmental changes based on dated lacustrine sediment records were developed mostly in the framework of archaeological investigations (Stancikaite et al. Reference Stancikaite, Kabailiene, Ostrauskas and Guobyte2002, Reference Stancikaite, Kisieliene and Strimaitiene2004, Reference Stancikaite, Baltrunas, Sinkunas, Kisieliene and Ostrauskas2006; Šeiriene et al. Reference Šeiriene, Kabailiene, Kasperovičiene, Mažeika, Petrošius and Paškauskas2009). Most of these studies used chronologies based on bulk lacustrine sediment 14C dating, although they did not carefully address the reservoir age, including the possible hard water effect even in cases where the signs of such an effect are present, e.g. carbonate material transport from the catchment, groundwater discharge to the lake or water with dissolved organic carbon (DOC) or particulate organic matter (POM) inflow into the lake from peatlands located near the shore (Šeiriene et al. Reference Šeiriene, Kabailiene, Kasperovičiene, Mažeika, Petrošius and Paškauskas2009).
A sediment core record is presented here from a running, shallow Lake Tapeliai belonging to a chain of hydrologically connected small lakes of a glacial tunnel valley surrounded by peat bogs and old weakly expressed aeolic landscape forms. The main regional settings are favorable for a hard-water effect. The lake is located in a deepened glacial tunnel valley with groundwater discharge into the lake (Moisejenkova et al. Reference Moisejenkova, Tarasiuk, Koviazina, Maceika and Girgždys2012). The surrounding glaciofluvial deposits of gravel with sand and other deposits contain up to 40% carbonates (Bitinas Reference Bitinas2012).
The objective of the present research was to examine how land use and urbanization changes in adjacent areas affected the biological productivity and carbon cycling in the lake ecosystem, including how these changes are reflected in carbon isotope variations, the reservoir age, and other proxies of lake sediments.
Carbonate and OM content measurements were performed in this study along with pigment and diatom analysis, as well as stable carbon isotope ratio and 14C activity measurements in two organic fractions of the lake sediment: humin and humic acids.
In order to determine the reservoir age variability in lake sediments of the last century for the construction of an independent chronology, the 210Pb and 137Cs dating methods were used.
MATERIALS AND METHODS
Sampling Area
The study area is located in the plain of the Neris River, which flows through a glaciofluvial outwash plain stretching beyond the marginal deposits of the Late Weichselian Glaciation (Guobyte Reference Guobyte2004; Bitinas Reference Bitinas2012). The elevation of the investigated territory ranges between 93.6 m asl in the lower areas of the Neris River flood plain and 163.4 m asl at the top of the small moraine marginal hills. The studied Lake Tapeliai (54°46’28”N, 25°26’45”E) (Figure 1) itself is located in the southeastern part of the glacial tunnel valley which has general direction of NW–SE. The attribution of the lake to the deepened up to 15–20 m tunnel valley in the glaciofluvial deposits (gravel with sand and various sands) composed of carbonates up to 40% are favorable to groundwater discharge to lake (Bitinas Reference Bitinas2012; Moisejenkova et al. Reference Moisejenkova, Tarasiuk, Koviazina, Maceika and Girgždys2012). The lake is surrounded by elevated glacial and glaciofluvial forms composed of till and sandy deposits (140–150 m asl) and by small wetland areas occurring in surface depressions (altitudes slightly above 137 m asl, the lowest altitudes are 136 m asl at the shoreline of the lake). The wetland areas are underlain by glaciolacustrine deposits consisting of fine and very fine sand deposited during the earliest stages of deglaciation, when meltwater was drained along the ice sheet and formed prominent outwash plains (Blažauskas et al. Reference Blažauskas, Jurgaitis and Šinkunas2007). The surface sediments in the vicinity of the lake and on adjacent slopes were transformed by aeolian processes during the cold climate phases that occurred during the Late Glacial and early Holocene periods. Northward from the lake are areas with a thicker cover of aeolian deposits, sometimes forming small, although not strongly, morphologically expressed aeolian forms. The region surrounding the study area belongs to the boreonemoral vegetation zone, which is dominated by Scots pine (Pinus sylvestris L.), spruce (Picea abies L.), and birch (Betula pendula Roth.).
Location of the study site (the sampling location at Lake Tapeliai is marked by a triangle).

Lake Tapeliai is a part of the lake chain connected by a brook with lakes Juodis (54°46’49”N, 25°26’29”E) in the North and by a ditch with Lake Lydekinis in the South. It is known that this ditch was opened between 1879 and 1923. In the 1960s (Tarasiuk et al. Reference Tarasiuk, Moisejenkova, Koviazina, Karpicz and Astrauskiene2009) an inflowing ditch connecting the former first original water body of Lake Lydekinis (54°46’11”N, 25°27’23”E) with Lake Tapeliai was blocked by a sand buffer, so Lake Tapeliai became the first original water body in the entire lake chain. During spring flood periods or after long-term rains, the lake is fed by an inflow of colored water from the surrounding watershed mires (Figure 1). The surface area of the lake is ~0.126 km2, and the area of the drainage basin exceeds 0.7 km2 (Tarasiuk et al. Reference Tarasiuk, Moisejenkova, Pečiulienė, Jasaitis and Girgždys2015). The lake could be divided into four sectors: the shallow southern terrace (depth of 4–5 m), the deepest (7–9 m) central part of the lake, the northern terrace with its gradual bottom deepening from 1.5 to 6 m, and the small western bottom terrace (5–6 m). The thickness of the gyttja layer varies from 1.5 m near the northern bank to 4-6 m in the deeper central part. The outflows to Lake Juodis are seasonally dependent and vary in the range of 7–80 L/s. Sometimes, small beaver dams control the water level of the lake. The water column in the lake mixes for a short period in spring at water temperatures near 4ºC and for a longer-term period during autumn due to the various cooling processes.
Sediment Sampling and Pretreatment
Lake sediment core was collected from the ice surface in the central point of Tapeliai Lake (54°46’29”N, 25°26’47”E) on January 30, 2017, using a Kajak sediment corer (tube length 100 cm, inner Ø 52 mm). The depth from the ice layer to the lake bottom was 9.50 m. The pH and temperature of water were 7.5 and 3.5ºC, respectively, at the bottom layer. The dissolved oxygen concentration was close to zero. The pH of the surface water was 7.8, the temperature was 0.9ºC, and the oxygen concentration was 8.5 mg/L. All the measurements of the water temperature, pH and dissolved oxygen were performed in situ using a portable WTW multiparameter unit (MultiLine F/Set-3). The sediment core was separated into sample layers of 1 cm thickness, and all samples were transported to the laboratory in plastic containers. The samples were lyophilized using a freeze-dryer (CHRIST Alpha 2-4 LSC).
137Cs, 210Pb, and 214Pb Measurements in Sediment Samples
Measurements of the 137Cs, 210Pb, and 214Pb found within the samples of the sediment core were accomplished with an ORTEC gamma-ray spectrometer with an HPGe GWL-series detector (detector diameter 54.7 mm, detector length—67.8 mm, active well depth—40 mm, well inside diameter—15.5 mm, total active volume—126 cm3, absorbing layers of high purity aluminium—0.5 mm, inactive germanium—0.3 μm, resolution, FWHM, at 1.33 MeV (60Co)—2.25 keV, and at 122 keV (57Co) – 1.2 keV) at the Nature Research Centre, Vilnius. 210Pb activity concentrations were measured by its gamma-ray emission at 46.5 keV, 137Cs activity concentrations were measured at 661.7 keV (gamma line of a daughter product 137mBa) and activity concentrations of 214Pb, as a daughter product of 226Ra, were measured at 295.2 keV and 351.9 keV. GammaVision-32 software was used for the determination of activities and uncertainties (± 2σ), as well as for quality assurance procedures. The energetic and counting efficiency calibration of the gamma spectrometric system was implemented by using commercially available multi radionuclide standard sources and a reference solution for different densities and filing heights with the selected matrix as described by Marčiulionienė et al. (Reference Marčiulioniene, Mažeika, Lukšiene, Jefanova, Mikalauskiene and Paškauskas2015). Regarding most of the samples, the detection limit for the counting time of 200,000 s was about 0.014 Bq for 137Cs, 0.065 Bq for 210Pb and 0.021 Bq for 214Pb, while the measurement errors did not exceed 8%, 15%, and 20% for 137Cs, 210Pb, and 214Pb, respectively. The normal precision of gamma spectrometric measurements of the laboratory was proved during the intercomparisons of 2014 organized by the STUK– Finish Radiation and Nuclear Safety Authority (Klemola et al. Reference Klemola, Holm, Mattila, Nielsen, Ramebäck and Jónsson2014) and 2017 organized by Risø, DTU–Technical University of Denmark (Nielsen et al. Reference Nielsen, Rand, Bjerk, Ramebäck, Pöllänen and Jónsson2017).
Organic Matter and Carbonate Content Measurements in Sediments
For determination of the OM and carbonate content in sediments, the loss on ignition method (Heiri et al. Reference Heiri, Lotter and Lemcke2001) was used. Briefly, after an oven drying at 105ºC for 12 hr, the OM was combusted at 550ºC for 5 hr and heated at 950ºC for 2 hr. The carbon carbonate content (%) was calculated as:
 $$\eqalign{{\rm {C}}_{{\rm{carb}}}}\left( \% \right){\rm{ }} = {\rm{ }}\left( {{\rm{weight \ of \ post \ {550}^{\circ}}}{\rm{C \ ash }}-{\rm{ weight \ of \ post \ {950}^{\circ}}}{\rm{C \ ash}}} \right)/\left ( {{\rm{weight \ post \ {105}^{\circ}}}{\rm{C \ dry \ sample}}} \right) \times 0.{\rm{273}} \times {\rm{1}}00.$$
The constant of 0.273 in the equation was used to convert the mass of CO2 to the mass of carbon (Wang et al. Reference Wang, Wang and Zhang2012).
13C/12C, OC, and TN Measurements in Sediments
For the estimation of the content of total nitrogen (TN), organic carbon (OC), and stable carbon isotope composition, the sediment samples were acidified with 1M HCl to remove carbonates, then were rinsed until the pH was 7 and re-dried.
The OC (%) and TN (%) in the sediment samples were established using an elemental analyser (Thermo Flash EA 1112). Standard sulphanilamide (Merck, cat. #111799) was used for calibration. The long-term standard measurements were performed with a precision of <1.8% for C and <1.2% for N.
The 13C/12C measurements in the OC (weight 0.8–1.5 mg), humin (weight 2–5 mg) and humic acid (weight 1–2 mg) samples were performed using a Thermo Flash EA 1112 elemental analyser connected to a Thermo Scientific Delta V Advantage isotope ratio mass spectrometer (IRMS).
All the results of the stable carbon isotope ratio measurements were expressed relative to a standard using delta notation in units of permil (‰):
 $${\delta ^{{\rm{13}}}}{\rm{C }} = {\rm{ }}[({{\rm{R}}_{{\rm{sample}}}}/{{\rm{R}}_{{\rm{standard}}}}){\rm{ }}-{\rm{ 1}})] \times {\rm{1}}{0^{\rm{3}}}\left(‰ \textperthousand \right),$$
where R=13C/12C in the sample or in the standard. The stable carbon isotope ratios were expressed relative to the international Vienna Pee Dee Belmnite (V-PDB) reference standard.
The laboratory standard was calibrated using NIST Standard Reference Material IAEA600. The long-term reference material measurements were performed with a precision of <0.1‰.
Radiocarbon Dating
Prior to the graphitization, sediment samples were pretreated using the acid-base-acid (ABA) method to extract the humin and humic acid fractions (Brock et al. Reference Brock, Higham, Ditchfield and Ramsey2010). Sequential washes were performed as follows: 1 M acid wash overnight, following 0.2 M base wash for 1 hr (with the base solution being replaced until the solution remained colorless) and then a 1 M acid wash for 1 hr to yield the humin fraction. Humic acid was extracted from base solution by acidification. Graphitization of the samples (weight 2–5 mg) was performed using an Automated Graphitization Equipment AGE-3 (IonPlus AG) (Wacker et al. Reference Wacker, Němec and Bourquin2010).
The 14C/12C ratios in the graphitized sediment samples were measured using a 250-kV single-stage accelerator mass spectrometer (SSAMS, NEC, USA) at the State Research Institute Center for Physical Sciences and Technology in Vilnius. The accuracy of the measured 14C/12C ratio was better than 0.3%. Graphitized phthalic acid (Merck, cat. #822298) was used for the estimation of the background of measurements. It was determined to be 2.45 × 10⁻³ fM. The IAEA-C3 standard was used as a reference material (percent of modern carbon [pMC] – value of 129.41). For the 14C isotopic fractionation correction, the ratio of 13C/12C was used.
The reservoir age (RRA) in the humin and humic acids was calculated according to Philippsen (Reference Philippsen2013):
 ${\rm{RRA}} = 8033 \times {\rm{ln}}({{{\rm{pM}}{{\rm{C}}_{\rm{T}}}} \over {{\rm{pM}}{{\rm{C}}_{\rm{A}}}}}),$
where pMCA and pMCT is 14C activity in the aquatic and terrestrial samples of the same period, respectively. As pMCT, we used atmospheric 14C activity data from OxCal v4.2.4 (Bronk Ramsey Reference Bronk2009; Bronk Ramsey et al. Reference Bronk and Lee2013) and for the last 20 years 14C activity data in Scots pine (Pinus sylvestris L.) tree rings, from Ežerinskis et al. (Reference Ežerinskis, Šapolaitė, Pabedinskas, Juodis, Garbaras, Maceika, Druteikienė, Lukauskas and Remeikis2018).
Analysis of Sedimentary Pigments and Diatoms
Sedimentary pigments were determined spectrophotometrically according to standard methodologies (Strickland and Parsons Reference Strickland and Parsons1972; Swain Reference Swain1985; Lami et al. Reference Lami, Niessen, Guilizzoni, Masaferro and Belis1994). Approximately 0.1 g of freeze-dried sediment was extracted with 90% acetone for 20 hr. Chlorophyll a (Chl a) and chlorophyll derivative (CD) values were obtained before and after acidification with 0.5 M HCl using the relevant equations by Lorenzen (Reference Lorenzen1967). The concentration of total carotenoids (TC) was calculated according to Strickland and Parsons (Reference Strickland and Parsons1972). The concentration of pigments was expressed µg Chl a/CD/TC per gram of freeze-dried weight.
Sediment samples for diatom analysis were prepared using standard methods for microfossil analysis (Battarbee Reference Battarbee and Berglund1986; Miller and Florin Reference Miller and Florin1989). The samples were oxidized by treatment with 30% hydrogen peroxide. Diatoms were mounted with Naphrax and at least 500 valves along the central part of horizontal transects per slide were counted. Diatoms were grouped by ecological requirements according to VanDam et al. (Reference VanDam, Mertens and Sinkeldam1994). The most frequent and ecologically important taxa were displayed using the TILIA and TILIA-GRAPH programs (Grimm Reference Grimm1992).
RESULTS
210Pb and 137Cs Sediment Dating and Sedimentation Rate Determination
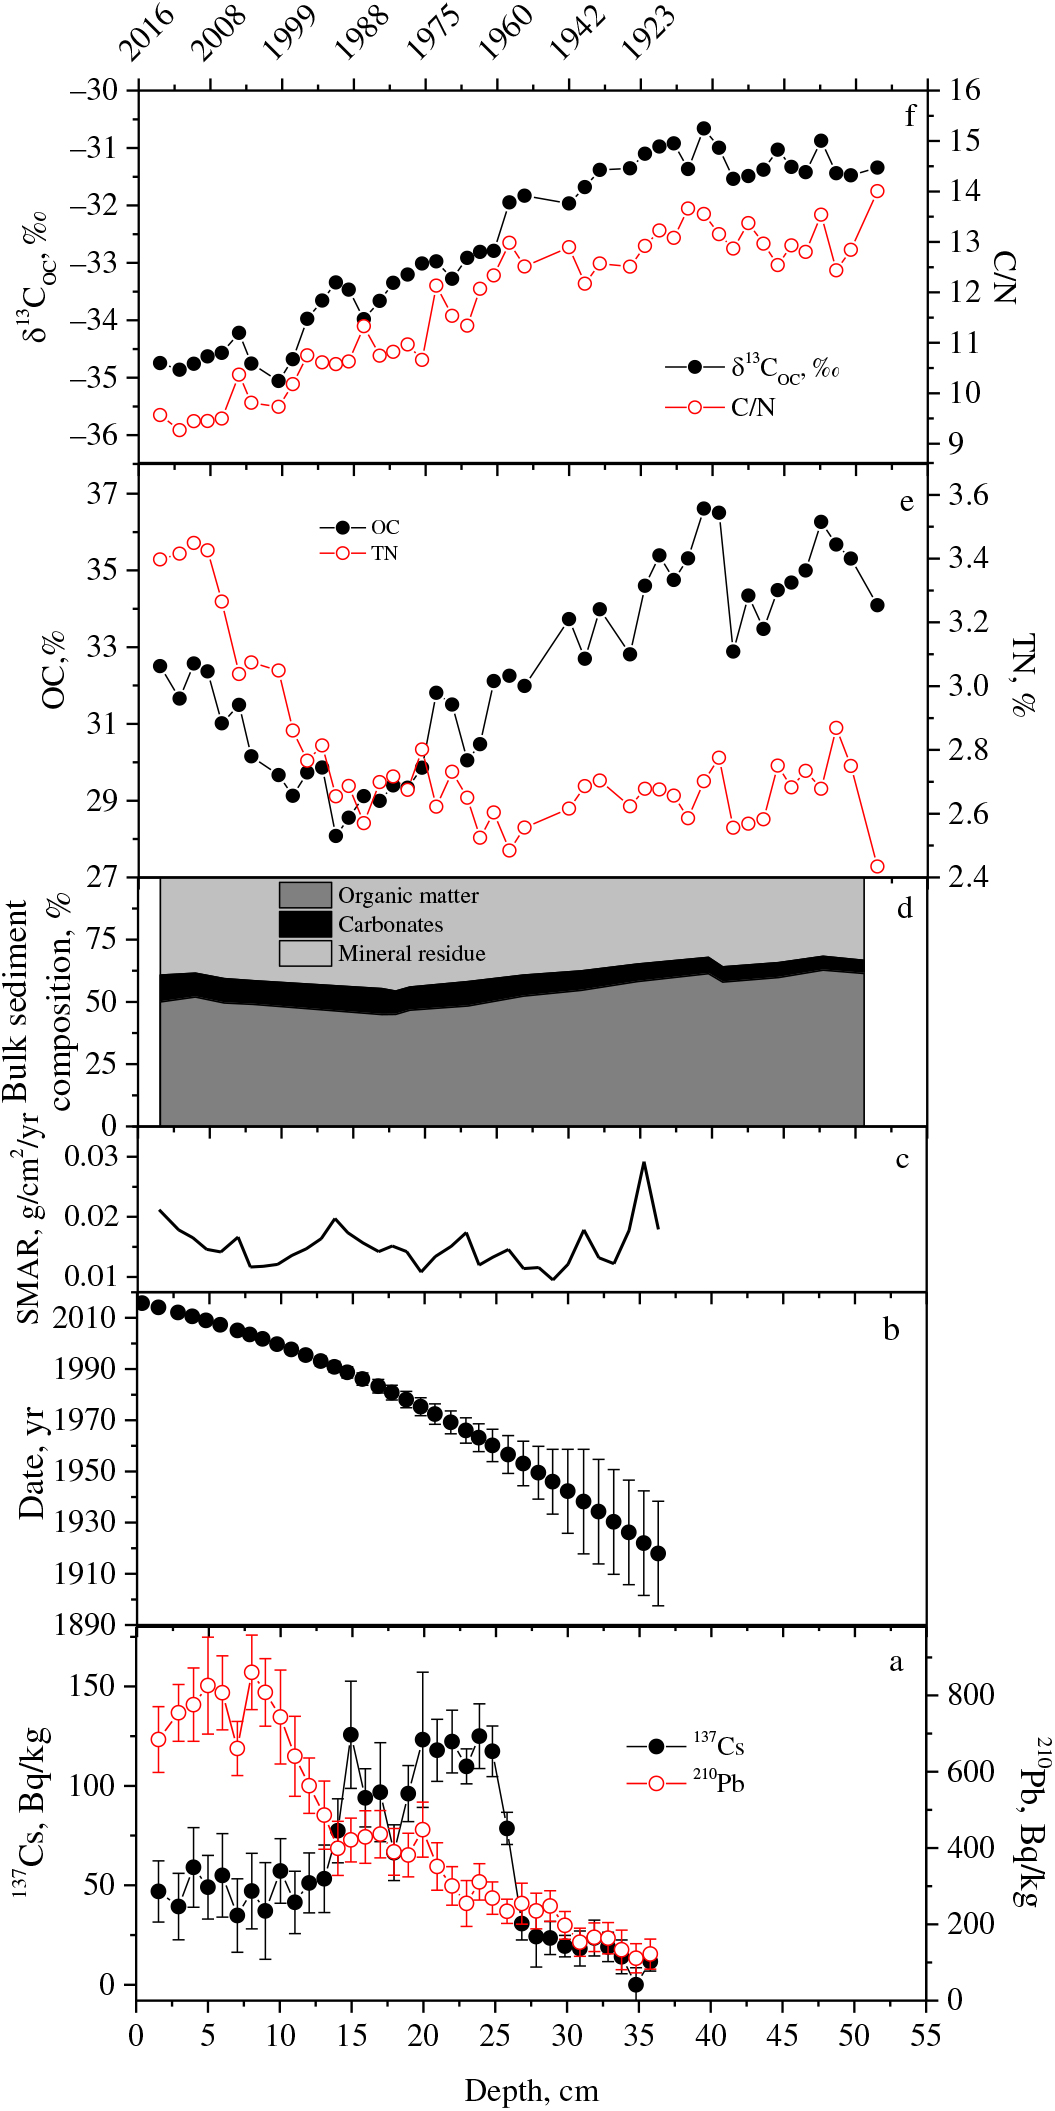
210Pb dating of the sediment core was performed according to the constant rate of the 210Pb supply (CRS) model (Appleby et al. Reference Appleby and Oldfield1978; Appleby Reference Appleby, Last and Smol2001; Piotrowska et al. Reference Piotrowska, de Vleeschouwer, Sikorski, Pawlyta, Fagel, le Roux and Pazdur2010) with some modifications. The data on the activity concentration of 210Pb (total) and 137Cs in the sediment core layers taken from Lake Tapeliai are given in Figure 2a.
Lake Tapeliai sediment records: (a) 137Cs and 210Pb profiles; (b) model ages from 210Pb profile; (c) sediment mass accumulation rates (SMAR) based on 210Pb chronology; (d) cumulative weight percentage of organic matter, carbonates and mineral residue; (e) OC and TN content; (f) stable isotope composition of OC and C/N ratio in sedimentary organic matter.

The specific activity of the total 210Pb exponentially decreased from 860 ± 100 Bq/kg in the 6.3–7.4 cm depth interval of the sediment core to 100–120 Bq/kg at a depth of 36 cm, however, with some negative (1–4.5 cm depth interval) and positive (7.5–10.5 cm and 19.5–20.5 cm depth intervals) 210Pb excursions observed. These small changes could be induced by a somewhat variable sedimentation rate and consequently pronounced 210Pb dilution for intervals with a higher sedimentation rate and the 210Pb concentration effect for intervals with a lower sedimentation rate. These variations of sedimentation rate were calculated for the entire depth interval of sediments (0–36 cm) with excess 210Pb (unsupported). The 210Pb excess, 210Pbex, which was used for the sediment age calculation based on radioactive decay, was determined subtracting the supported 210Pb (assumed to be in equilibrium with 214Pb and 226Ra) from the total 210Pb.
Below the depth of 36 cm, the specific activity of 210Pb was within the limits of uncertainties close to the level of 214Pb in sediments, which corresponds to the supported 210Pb level. This level between a depth of 36 and 52 cm was slightly variable in the interval of 25–55 Bq/kg and corresponded to 210Pbex=0.
The 210Pbex concentration profile in the sediment core up to the depth of 36 cm exhibited a well-defined exponential decrease with the mass depth (product of the sediment slice wet thickness and dry bulk density), dm, (210Pbex=950×exp(–2.1107×dm); R2=0.94) evidencing a rather constant 210Pbex flux and steady-state sedimentation in the lake allowing the construction of the CRS age model. This model was used to calculate the sediment age and partial sediment mass accumulation rate (SMAR) values for the studied core up to the depth of 36 cm (Figure 2c).
Below this depth of 36 cm, which corresponds to calendar date of 1918 ± 3 AD, the 210Pb chronology is uncertain. However, based on the mean sediment mass accumulation rate, it is possible to approximately predict the sediment age for the 36–55 cm interval using the sediment age-depth function (Figure 2b) obtained for the 0–36 cm sediment interval with 210Pbex. The sediment age-depth function derived from the 210Pb CRS model was expressed by the polynomial equation (y = 0.0384×x2 + 1.3123×x + 0.8269; R2 = 0.9997). From this function, sediments at the core bottom (55 cm depth) can be attributed to a calendar date of ~1820 AD with an uncertainty not less than 20 years. First-order errors (2σ) increased exponentially with the calculated CRS-model dates approximately as follows: for the age interval of 0–10 yr they became ± (0.5–1) yr; 10–20 yr – ± (1–2) yr; 20–50 yr – ± (2–5) yr; 5–100 yr – ± (5–20) yr. Therefore, the dating of older sediments (>100 yr) was unreliable due to large numerical uncertainties: at low 210Pb activity (20 Bq/kg) 2σ, the uncertainty associated with gamma spectrometry measurements can reach ± 70%, although for higher activities, (>60 Bq/kg) ± 20% and less.
The partial SMAR values for the past 100 years were in the range of 0.012 ± 0.0017 to 0.029 ± 0.009 g/cm2/yr with a mean sediment mass accumulation rate of 0.015 g/cm2/yr for the whole dated interval of the core. The mean SMAR value corresponded to a linear sedimentation of wet matter equal to 0.4 cm/yr. The 2σ uncertainties for the SMAR values were in the range of 15-30% with the largest values found at the sediment depth of 36 cm, where 210Pb activities were approaching the minimal detectable activity (MDA) level. The chronology based on 210Pb for the second half of the 20th century was validated by the use of the artificial fallout radionuclide 137Cs from the atmospheric testing of nuclear weapons and the Chernobyl NPP accident as an independent chronostratigraphic marker. The depth profile of the 137Cs activity in sediments agreed well with the 210Pb CRS dates. Two peaks of 137Cs at the sediment depths of 23.8 and 14.6 cm corresponded to the 210Pb dates of ~1964.0 ± 3.0 and ~1988.8 ± 3.0 AD (Figure 2b).
The shapes of two activity peaks are seen in the 137Cs profile: one rather outspread activity concentration elevation at the 20–25-cm depth and a distinct peak at the 15-cm depth. Steep activity slopes from the first peak down to deeper sediment layers from a depth of 25–27 cm, as well as from the second peak towards the sediment surface at the depth of 15–17 cm were observed. The first smooth peek evidently appeared due to the radiocesium global fallout of nuclear weapons testing in the atmosphere before the moratorium in 1963.
The second peak is evidently attributed to Chernobyl, because its centre location at a depth of 15–16 cm corresponds to the years 1986–1988 and it has a narrow half-width of 3 cm. This finding is similar to the investigation of bottom sediments in the deepest part of Lake Tapeliai, reported in (Moisejenkova et al. Reference Moisejenkova, Tarasiuk, Koviazina, Maceika and Girgždys2012) where two radiocesium activity peaks were also detected. However, in our case, the Chernobyl origin peak is much more pronounced. The 137Cs activity plateau found within the top 10 cm of the layers indicate that sediments of up to 10 cm might be physically mixed. In this study, the maximum activity concentration of the first outspread peak was 123 Bq/kg (the global fallout) and of the second sharp peak, 126 Bq/kg (Chernobyl accident). By integrating the activity around the peaks, the contribution of 137Cs contamination can be estimated to be 1:3 from Chernobyl and the global fallout, correspondingly. The estimated total load of 137Cs in the bottom sediments is 816 Bq/m2 and the average sedimentation rate is 0.4 cm/yr. Our results are in a good agreement with the corresponding data of (Moisejenkova et al. Reference Moisejenkova, Tarasiuk, Koviazina, Maceika and Girgždys2012), where maximum radiocesium activity concentrations in the range of 110–190 Bq/kg were observed in the bottom sediments all over the lake, and the total load in the range of 770–1540 Bq/m2 was derived with the value of below ~1050 Bq/m2 in the cores from the deepest central zone of the lake (Moisejenkova et al. Reference Moisejenkova, Tarasiuk, Koviazina, Maceika and Girgždys2012).
Sediment Characteristics
The percentage content of OM, carbonate and mineral residue based on LOI is presented in Figure 2d.
The lowest part of the core (50–40 cm) contains 5.5–6.2% of carbonates. The amount of OM and organic carbon (OC) are the greatest at this depth and vary within a range of 58–62.8% and 33.5–36.2%, respectively. The content of mineral residue varies between 31.7–35.9%.
Both OM and OC displayed a decreasing trend of 58.1–44.9% and 36.6–28.1% respectively, within the middle part of the core (40–15 cm), while the percentage of carbonates slightly increased from 7 to 10.4%. The content of mineral residue gradually increases to 44.6%.
The TN content remained at a stable level of 2.7 ± 0.1% until the depth of 15 cm, followed by a steep increase to 3.4% at the topmost sediment layers. Both OM and OC also displayed an increasing trend at the upper part of the core (15–0 cm), reaching the values of 50% and 32.6%, respectively. The mineral content slightly decreased to 39.2%.
In the depth interval of 50–35 cm, OM had a C/N ratio of 15.1 ± 0.6, indicating the mixed terrestrial and aquatic sources (Lamb et al. Reference Lamb, Leng, Mohammed and Lamb2004). In the middle part of the core (35–10 cm), the C/N value showed a decreasing trend that could be an indication of the increasing content of autochthonous OM in the sediments. The C/N value of 11.2 ± 0.3 remained stable at the upper 10 cm of the sediment layer (Figure 2f).
Stable Isotope Ratio Measurements in Sediments
The δ13C value of the sedimentary OC (δ13COC) (Figure 2f) varied from to –34.9‰ to –30.9‰ and exhibited stable values of –31.3 ± 0.2‰ and of –34.6 ± 0.2‰ in the depth intervals of 50–40 cm and 10–0 cm, respectively, while in the middle part of the core upward from the depth of 40 cm, the stable carbon isotope ratio values display a decreasing trend.
The δ13COC significantly correlated with the C/N ratio values (r=0.95, p<0.001).
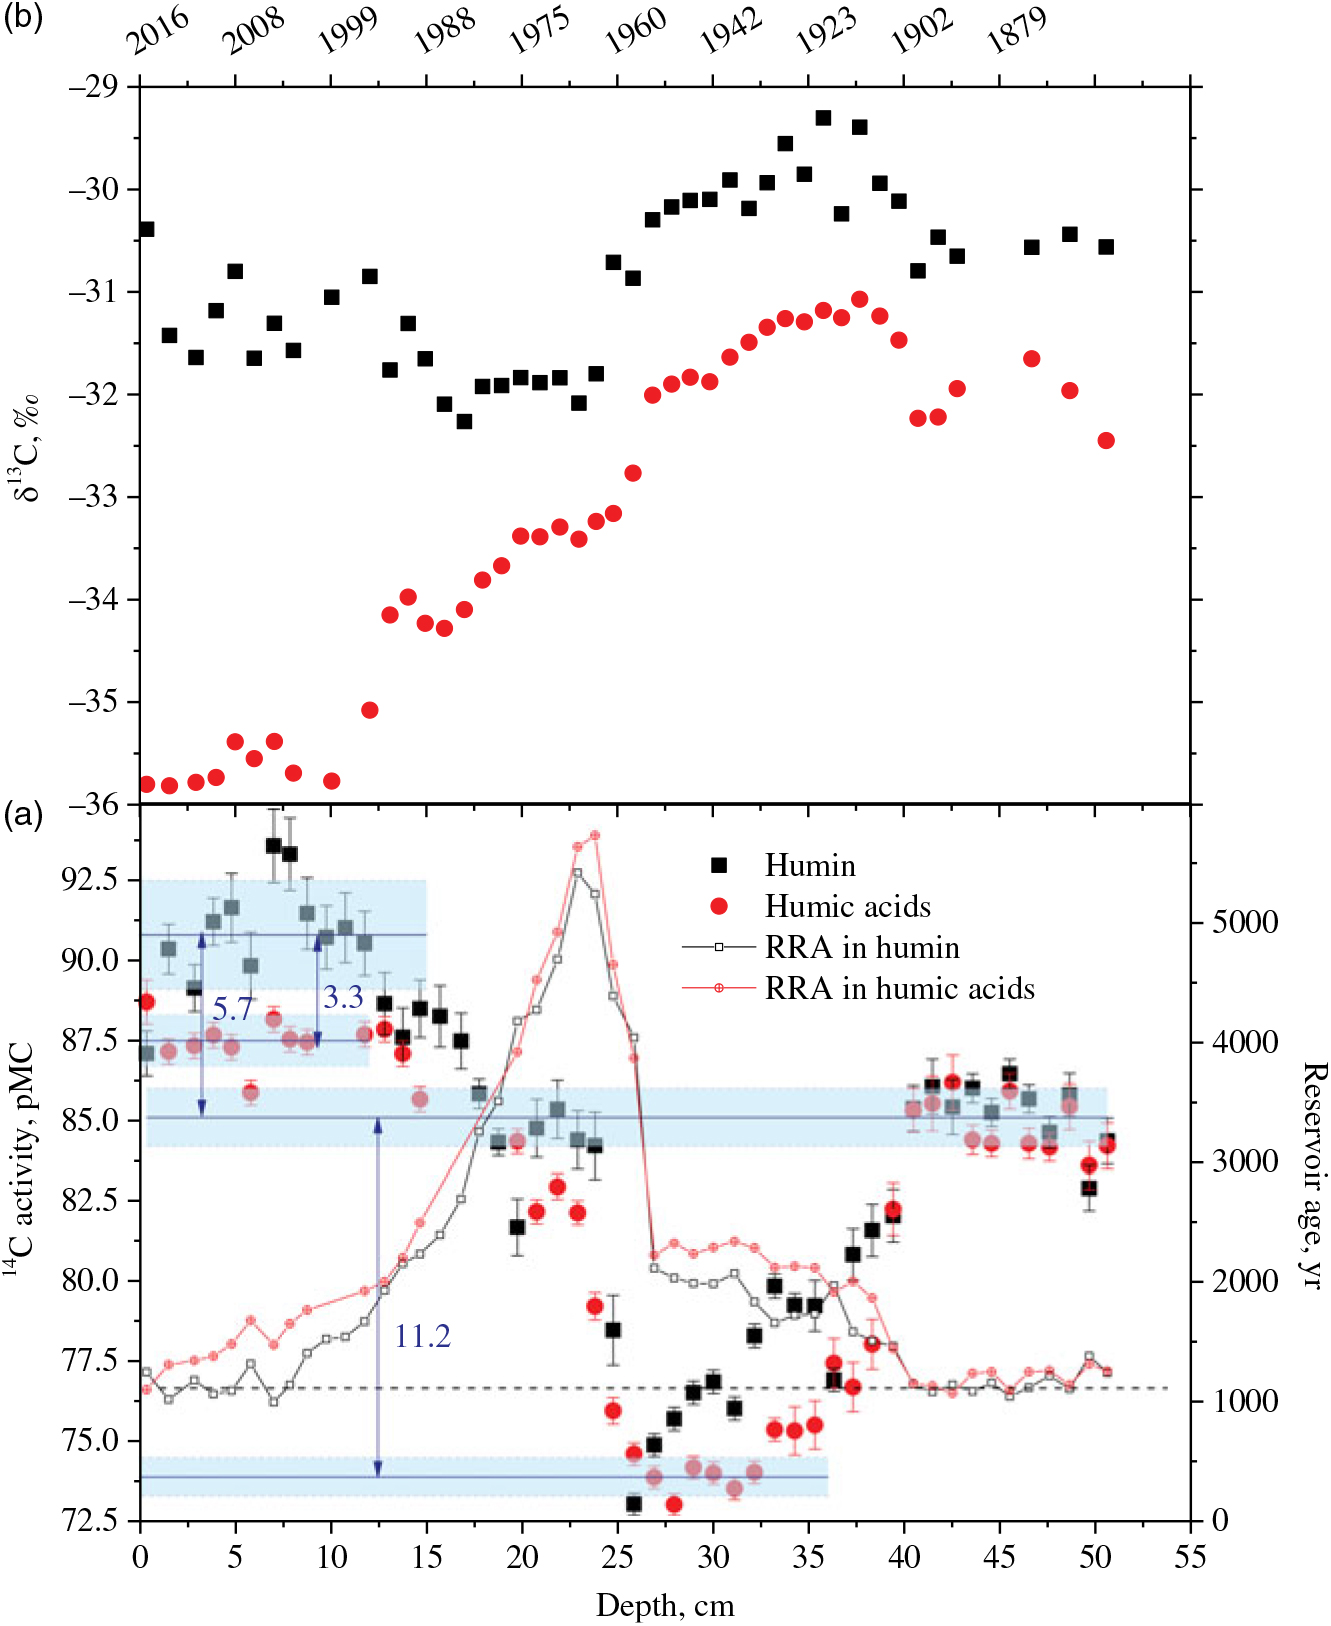
The stable carbon isotopic composition of humin and humic acid fractions in the sediments from Lake Tapeliai is shown in Figure 3b. The δ13C values in the humin fraction varied from –32 to –29‰. The highest 13C values of –29.5 ± 0.5‰ were observed in the depth interval from 40 to 26 cm. Within the same depth interval, a 13C enrichment of up to 1‰ in the humic acid fraction as well as a linear reduction in the δ13C values by as much as 1‰ at a depth of 26–25 cm were seen.
14C activity measurements (a) and the stable carbon isotope composition (b) in sediment humin and humic acids fractions (b). Plotted the reservoir age (RRA) data (a) was established in both humin and humic acid fractions.

δ13C values in the humic acid fraction varied from –36 to 31‰ exhibiting the same trend as δ13C values of OC with depletion of 0.4–1‰ (the Pearson correlation coefficient between the δ13C values of both fractions was 0.96, p<0.001).
Radiocarbon Dating Results
As can be seen in Figure 3a, the 14C activity in both sediment fractions of Lake Tapeliai varied in the 73–94 pMC interval during the last century. In the depth interval of 50–40 cm, the 14C activity in both fractions exhibited the same value of 85.1 ± 0.9 pMC. In the humin fraction, measurements showed a gradual decrease in the 14C activity from 85.4 pMC to 73 pMC in the depth interval of 40–26 cm. The 14C values in the humic acid fraction decreased down to 73.5 pMC in the depth interval of 40–31 cm and remained rather constant (73.9 ± 0.5 pMC) in the depth interval of 31–26 cm. From the depth of 26–25 cm, the 14C activity in both fractions exhibited a gradual increase up to 87 pMC at the depth of 15–14 cm. In the top 14 cm layer, the humic acid fraction showed a uniform 14C activity distribution with a value of 87.5 ± 0.6 pMC, while in the same depth interval, the 14C activity in the humin fraction varied in the 87–93.5 pMC range.
Sedimentary Pigments and Diatoms
The concentration of CD and TC slightly varied in the sediment core at a depth of 50–18 cm (Figure 4). In the upper 17–6 cm sediment layer, the pigments values markedly increased and indicated increased primary productivity in the lake. The ratio of CD/TC was relatively high from 1.43 to 4.21 in the core, indicating good lake water transparency and a high oxygen content in the lake (Figure 4). The CD/TC ratio tends to decrease slightly from the upper layer to 17 cm (1.72 ± 0.18). The highest values and variation of the ratio (2.68 ± 0.45) were determined within the depth interval of 44–18 cm.
The ratio of CD/TC, the concentrations of chlorophyll degrade (CD) and total carotenoids (TC) in sediment core of Lake Tapeliai.

The diatom analysis (Figure 5) demonstrated that short term changes in the lake’s environmental conditions had a remarkable effect on diatom values. The total abundance of the valves was 4503 million valves/g of sediments dry weight in the lowest layer of the core and decreased by nearly 3 times in the upper layer.
Relative abundance of diatom taxa, diatom groups according to ecological preference, and total amount of the valves in the sediment core of the Lake Tapeliai.

On the basis of the presence of diatom taxa differing in their responses to environmental conditions and their relative abundance, the entire core was divided into 3 groups through the use of cluster analysis.
In the deepest part of the core, 50–30 cm (cluster I), the dominant diatom assemblage consisted of planktonic species of the genus Aulacoseira, mainly Aulacoseira granulata, which reached a proportion of almost 40%, and Tabellaria fenestrata. The amount of these species decreased in the upper layers of the sediment.
A distinct decrease in the total amount of valves in the middle of the core (cluster II) was found. Small centric Cyclotella diatoms, and Fragilaria crotonensis, F. acus started to replace the prevailing species in the lowest layers. An increased diversity of the acidophilic diatoms Eunotia, Neidium, Pinunularia was also revealed.
In the upper sediment layer (cluster III), diatom assemblages consisted of planktonic species that reached a proportion of more than 75%. In the upper sediment layer, the greatest part of the diatom assemblages was created by eutraphenic species, mainly Aulacoseira ambigua, Cyclotella meneghiniana, and Stephanodiscus hantzschii.
DISCUSSION
The reservoir age in the humin and humic acid fraction of Lake Tapeliai sediment before the 1900s (at a depth of below 40 cm) was 1191 ± 59 yr. After events related with land use changes in adjacent areas and nuclear weapons testing, a similar reservoir age value of 1136 ± 112 yr was only found in the humin fraction ~18 yr ago (the sediment layer of 10–0 cm).
It is known that the ditch connecting Lake Tapeliai with Lake Lydekinis, densely surrounded by peat bog, was opened between 1886 and 1923. In the 1960s, this ditch was blocked. There is very little data on possible water level variation for this period. Data taken from historical maps revealed that the water level altitude was 137.4 m and 137.0 m in 1923 and in the 1930s, respectively (the channel was open). In 2017, then the channel was closed, it reached 136.6 m. It seems that the opening or closing of the channel did not change the water level significantly. However, the opening and the closing of the channel impacted the carbon pool and carbon isotope redistribution in the lake ecosystem (Figure 3). During the period of 1900–1960s (40–26 cm) a 13C enrichment by 1‰ and 14C activity reduction in both humin and humic acid fractions was observed as compared with the measurements in sediments from the earlier period. The 14C activity in the humic acid fraction decreased by 11.2 pMC (1175 ± 111 yr) during a 20-yr period (depth interval of 40–35 cm), while the humin fraction underwent the same decrease in 14C activity during ∼53 yr (depth interval of 40–26 cm).
Due to the ditch opening, a higher concentration of humic water and floating peat mat could be brought to Lake Tapeliai. Stable carbon isotope ratio measurements were not performed in the DOC from the watershed mires of the lake, but it is known from literature that the δ13C values in the DOC from bogs could vary from –26‰ to –28‰ (Charman et al. Reference Charman, Aravena, Bryant and Harkness1999; Kracht et al. Reference Kracht and Gleixner2000; Clymo et al. Reference Clymo and Bryant2008), while the δ13C values in the peat could vary from –25‰ to –28‰ (Xie et al. Reference Xie, Nott, Avsejs, Maddy, Chambers and Evershed2004; Esmeijer-Liu et al. Reference Esmeijer-Liu, Kürschner, Lotter, Verhoeven and Goslar2012). However, the rather stable molar C/N ratio values of 15.3 ± 0.5 in the sediment OM at the depth interval of 50–39 cm (Figure 2f) did not indicate any significant increase of OM of terrestrial origin (with C/N>20) in the sediments. Thus, the reduction of 14C activity in sediments could be related with the increased humic water inflow from the surrounding watershed mires. The slightly increased values in the ratio of chlorophyll derivatives and the total carotenoids (CD/TC) from 2.13 at the lowest part of the core to 2.68 ± 0.45 at the depth interval of 45–15 cm (Figure 4) could be an indicator of decreased primary productivity in the lake during this period. A higher ratio of CD/TC is usually typical for lakes with low productivity, where worse conditions for the preservation of pigments occurred (Swain Reference Swain1985; Waters et al. Reference Waters, Schelske, Kenney and Chapman2005; Mikomägi and Punning Reference Mikomägi and Punning2007). Furthermore, the considerable decrease in the total amount of diatoms, shifting of dominant species and elevated proportions of oligotrophic species in the sediment assemblages also support changes in the lake productivity. The sediment mass accumulation rate (Figure 2c) during this period was stable (0.015 ± 0.003 g/cm2/yr), and the double increase in sediment mass accumulation rate was observed only at the depth of 35 cm (Figure 2c). The decreasing C/N values (from to 15.3 to 12.4) indicate an increased content of autochthonous versus allochthonous OM in the sediments (Figure 2f). Stable sediment mass accumulationrate, but decreasing OM (from 61.4 to 44.9%), as well as OC concentrations (from 36.6 to 28.6%) and increased mineral residue content in sediments at the depth interval of 40–15 cm (Figure 2d and 2e) may indicate a reduction in primary production and changes in the allochthonous matter sources. At the beginning of the 20th century, the area of the lake basin was occupied with larger cultivated land areas, as compared to the later period. Forestation of the basin area began after World War II (30–28 cm), reducing the OM supply to the lake (Figure 2d).
However, a reduction in CO2 exchange rates between the lake water and atmosphere (δ13C value of atmospheric CO2 is ∼ –9‰), due to lowered photosynthetic activity and the degradation of dissolved humic matter (δ13C range from –26‰ to –28‰), would reduce the 13C concentration in water DIC (dissolved inorganic carbon). The autochthonous origin OM should also be depleted in 13C, even considering that the δ13C value in autochthonous POM can change by a few ‰ with respect to the initial value due to the decomposition processes (Lehmann et al. Reference Lehmann, Bernasconi, Barbieri, McKenzie, Ambientali, Pradiso, Lehmann, Bernasconi, Barbieri and McKenzie2002). The observed 13C enrichment by 1‰ in the humin and humic acid fractions (Figure 3b) was unlikely to have been caused by a decrease in the amount of allochthonous organic (terrestrial OM derived from C3 plants has δ13C values between –27‰ and –30‰ (Meyers Reference Meyers1997; Torres et al. Reference Torres, Inglett, Brenner, Kenney and Reddy2012). The 13C enrichment in the water DIC may have resulted from higher input of 14C depleted hard water, possibly related to changes in total groundwater discharge into the lake.
The ditch blocking in the 1960s coincided with an intense nuclear weapon test period. Both processes resulted in a reduction in humic water inflow and an increase in atmospheric 14CO2, which could impact the sharp increase in the 14C concentration in sediments back to its previous value of 85.1 ± 9 pMC in the 26–24-cm depth interval (Figure 3). Moreover, decreased diversity of acidophilic diatoms such as Eunotia, Neidium, and Pinnularia suggested increasing pH values during this period (Figure 5).
The 14C activity peak at the depth interval of 24–21 cm (1962–1969) can be seen in both sediment fractions (Figure 3a) and it coincided with the maximum value of reservoir age, calculated for the humin fraction, which could be related with a sharp 14CO2 concentration increase due to the “bomb peak.”
In the 1980s, an intensive expansion in the allotment gardens for the residents of Vilnius started in the forested area at a distance of 1–2 km from the lake. The use of fertilizers could stimulate lake eutrophication, as seen in the increased concentrations of chlorophyll derivatives and carotenoids at the depth interval of 15–0 cm (1985–2017). During this period, the reduced CD/TC (Figure 4) and C/N (Figure 2f) ratio values also indicate increased eutrophication. The greater amount of diatom taxa preferring eutrophic conditions, e.g. planktonic Aulacoseira ambigua, Cyclotella meneghiniana, Stephanodiscus hantzschii, etc. and their abundance also confirmed alteration in the lake trophic state (Figure 5). It is likely that the increased productivity of the lake (Figure 5) occurred due to significant alterations in phytoplankton assemblages, where algae species from other taxonomic groups or cyanobacteria became dominant. Eutrophication could increase the rate of CO2 exchange between the lake water and atmosphere, thus accelerating the restoration of the former reservoir age (before the 1900s) in the humin fraction seen at the top 10 cm sediment layers, and increasing the 14C activity value by 5.7 ± 1.8 pMC compared to the period before the 1900s (Figure 3a). In the humic acid fraction, 14C activity during this period was lower by 3.3 ± 0.8 pMC. Unfortunately, 210Pb dating indicated that the top 10 cm surface layers could be mixed. The constant values of C/N, and δ13C in the humic acid fraction and in the OC estimated in these layers also confirmed mixing (Figure 2e and 2f). Thus, it is impossible to evaluate the influence of environmental changes over last 18 yr (depth interval 10–0 cm) for lake ecosystem.
The alkaline soluble humic acids have both hydrophobic and hydrophilic domains, and are therefore able to bind organic compounds and inorganic ions (Heil Reference Heil2005; Meinelt et al. Reference Meinelt, Schreckenbach, Pietrock, Heidrich and Steinberg2008; Schellekens et al. Reference Schellekens, Buurman, Kalbitz, van Zomeren, Vidal-Torrado, Cerli and Comans2017). Their macromolecular structures (size and shape) as well as the corresponding activity of the functional groups vary in response to changes in the environmental conditions (Myneni et al. Reference Myneni, Brown, Martinez and Meyer-Ilse1999). The humin fraction, due to a lack of ionisable functional groups, is not alkali extractable and respond more slowly to changes in environmental conditions. However, both fractions are impacted by two opposite processes that are continuously proceeding: the fragmentation/decomposition of larger molecules of primary plant material to smaller size compounds with increases in the polar and ionisable groups, as well as the incorporation of smaller compounds into less reactive aggregates (Lehmann et al. Reference Lehmann and Kleber2015). Despite all the changes in the areas surrounding the lake that impacted the carbon import/export and cycling processes within the lake, the humin fraction had rather a constant value of –31.2 ± 0.6‰ throughout the entire investigated period, and slight 13C enrichment was only observed during the period, when the channel was open. The 13C trends in humin and humic acids coincided with a depletion of 1.5–1.8‰ until 1968, when due to forestation, the allochthonous versus autochthonous OM content in sediment decreased (Figure 3b). The δ13C values in humic acids showed a decreasing trend depending on C/N value in the sedimentary OM, indicating that the 13C concentration variation in this fraction was dependent on the content of the autochthonous origin OM in sediments. (Pearson correlation coefficient between C/N ratio in sedimentary OM and δ13C values of humic acids r=0.87, p<0.001). Various sources of OM had various proportions of different classes of organic compounds, having their own isotope composition and degradation time under certain environmental conditions (Lehmann et al. Reference Lehmann and Kleber2015). A slight increase in the δ13C values seen in both organic fractions during the period of 1900–1960 was most likely related not with changes in the OM sources in sediments, but with 13C concentration changes in autochthonous OM. Pre-aged organic carbon and 14C-depleted hard water inflow, as well as changes in sources of sedimentary OM conditioned the 14C activity difference in both fractions by 1–5 pMC (Figure 3a).
CONCLUSIONS
Our sediment records revealed that carbon cycling and biological productivity in the lake ecosystem were impacted by land use changes in the areas surrounding the lake during the last century. During the period investigated, the reservoir age varied from 1136 ± 112 yr to 5733 ± 122 yr depending on 14C depleted organic and inorganic carbon inflow, along with changes in the atmospheric 14CO2 concentration.
The changes observed in the 14C activity (up to 11.2 pMC) and in the δ13C values (up to 1‰) coincided with the opening of the channel connecting two lakes in the 1900s and the closure of this channel in the 1960s, reflecting the inflow of the 14C depleted organic carbon from the surrounding watershed mires as well as 14C depleted hard water inflow due to possible changes in total groundwater discharge into the lake.
During this period, the observed decrease in the total amount of diatoms and increased values in the ratio of chlorophyll derivatives and the total carotenoids (CD/TC) indicated a reduction in the lake productivity. The reservoir age in both fractions increased by 1175 ± 111 yr.
Forestation of the basin area after World War II reduced the OM supply to the lake and reduced the δ13C values in the humin acid fraction, depending on the increasing autochthonous versus allochthonous OM content in sediments. The channel blocking in the 1960s coincided with the intense nuclear weapon test period. The 14C activity peak coinciding with the maximum value of reservoir age (of 5421 ± 135 yr and 5733 ± 122 yr in the humin and humic acids, respectively) was identified as the “bomb peak”. In the 1980s, intensive expansion of allotment gardens and the use of fertilizers increased lake eutrophication, and as a consequence, enlarged the total amount of carotenoids, diatoms preferring eutrophic conditions, and also the structural changes in the phytoplankton assemblages that occurred.
Environmental changes had a minor impact on the stable carbon composition within the humin fraction. The δ13C values in the humic acid fraction showed a tendency to decrease, depending on the content of autochthonous origin OM in sediments. Pre-aged organic carbon and 14C-depleted hard water inflow, as well as changes in the sources of sedimentary OM was responsible for the 14C activity difference in both fractions by 1–5 pMC.
ACKNOWLEDGMENTS
The authors would like to thank Dr. Piotr Szwarczewski, University of Warsaw, Poland, Dr. Rimantė Guobytė, Lithuanian Geological Survey, and Dr. Vaidotas Kazakauskas, Nature Research Centre, Lithuania, for fruitful discussions and constructive comments that helped to improve the manuscript. The authors are also indebted to Radiocarbon Associate Editor Christine Hatté and three anonymous reviewers for their constructive comments.