Introduction
Sign languages (SLs) are natural, communication-structured systems that emerged independently of spoken languages wherever a deaf community is found (Sandler and Lillo-Martin, Reference Sandler, Lillo-Martin, Aronoff and Rees-Miller2001). Even though SLs are fully fledged languages, myths and misconceptions surrounding them persist, which impact on their users (Lane and Grosjean, Reference Lane and Grosjean2017). SLss are the primary communication systems for SL communities around the world (De Meulder et al., Reference De Meulder, Krausneker, Turner, Conama, Hogan-Brun and O'Rourke2018). The SL community as a linguistic minority group does not discriminate against individuals on the basis of their hearing status. SL community members are not only deaf signers but also deaf-blind, hard-of-hearing, both deaf and hearing people; such as SL interpreters, other professionals, or the hearing family members of deaf SL users.
The methodology adopted for research with deaf populations needs to take into consideration the linguistic diversity of SLs. In terms of accuracy, reliability, and validity of results, both SL research and research involving deaf signers must adequately guarantee the cultural and linguistic aspects at all stages (Allen, Reference Allen, Orfanidou, Woll and Morgan2015). At the same time, it is necessary to protect ethical standards in research within the deaf populations and to promote accessibility to guarantee human rights (Ewart and Snowden, Reference Ewart and Snowden2012; Berghs et al., Reference Berghs, Atkin, Graham, Hatton and Thomas2016).
Although authors generally agree that accessibility plays a central role in human rights in this framework, it is still unclear how it should be understood. Greco (Reference Greco, Matamala and Orero2016) defined this dilemma as a Human Right Divide Problem (AHRD Problem). The AHRD problem highlights the fact that accessibility is an unequivocal human right, as well as an instrument for the fulfillment of human rights. The World Federation of the Deaf (WFD) aims to ensure equal human rights for deaf populations around the globe (World Federation of the Deaf, 2018). According to the figures, there are more than 70 million deaf people worldwide and more than 300 different, national SLSL. For that reason, the WFD defends bilingual education and SL rights, due to the diversity they bring to society. Deaf users who consider SL as their first language have the right to use it as their everyday means of communication. In contexts such as education and research, new technologies are necessary for the provision of innovative, inclusive learning environments towards social, emotional, academic, and linguistic development (Domínguez, Reference Domínguez2017). With this aim, the present research proposes a new design and generation of interfaces for questionnaires based on SL video presentation.
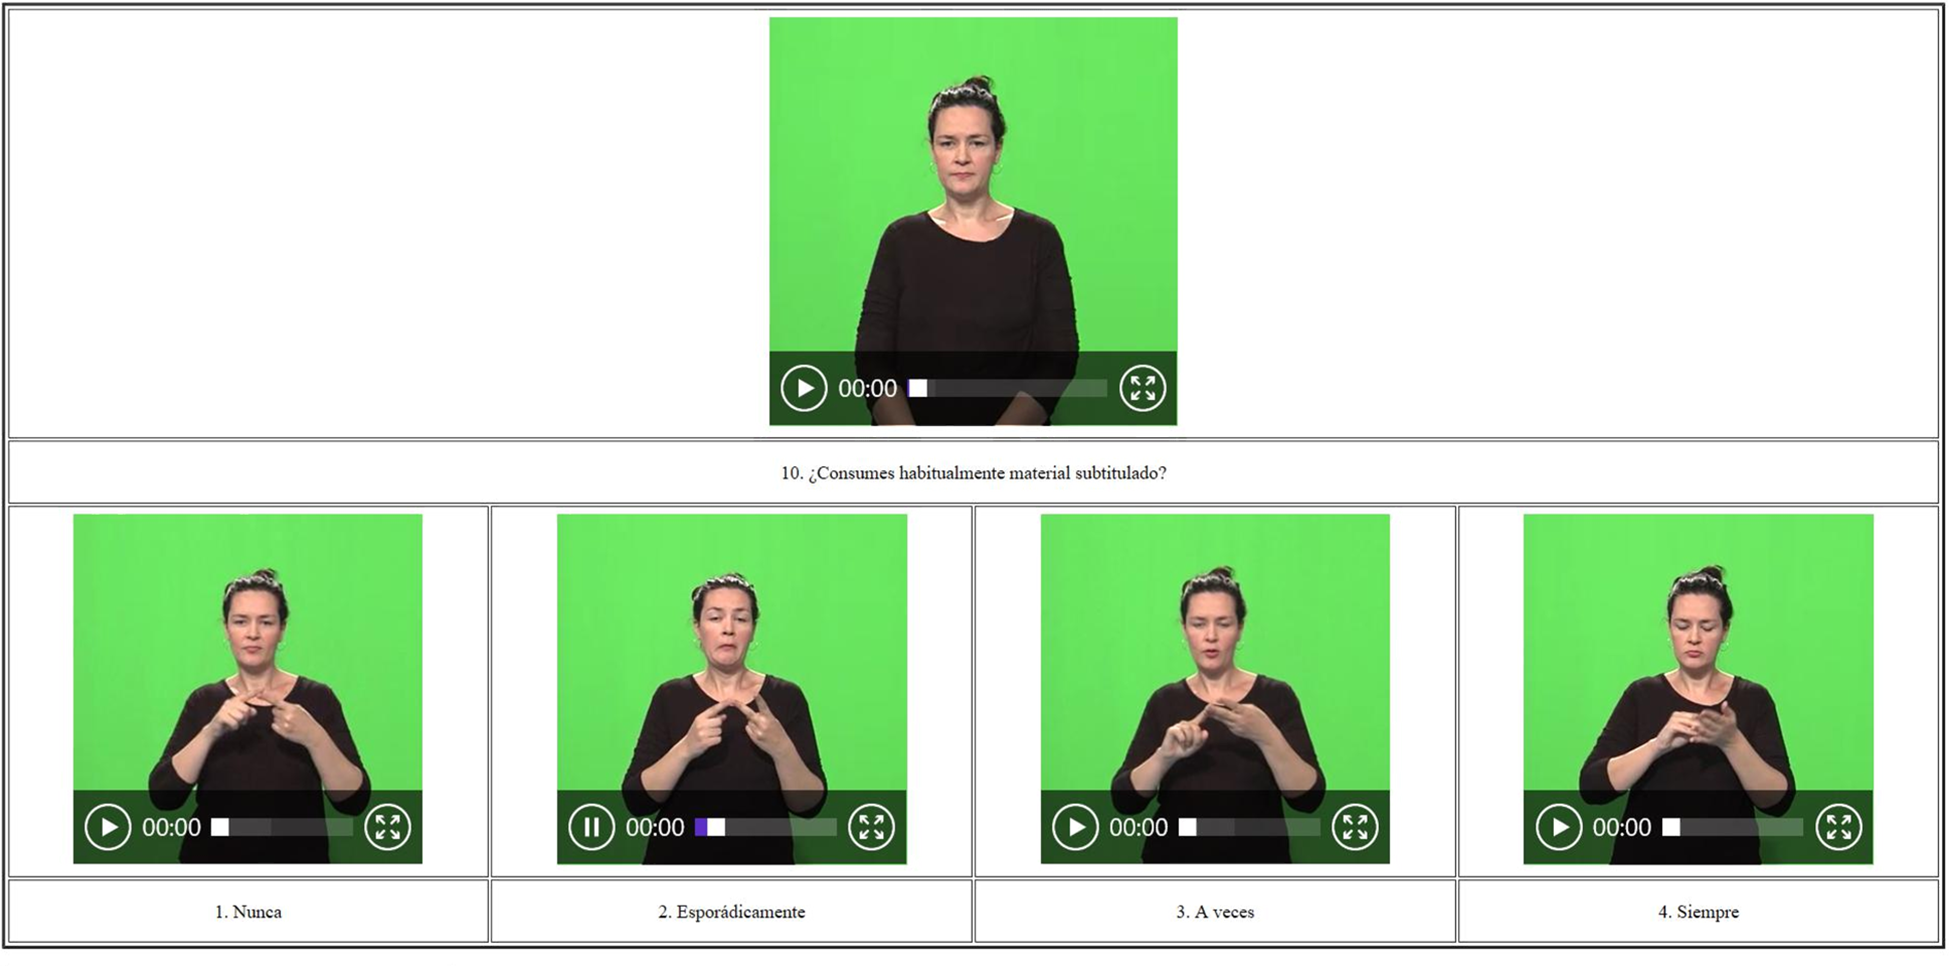
The questionnaire presented here is an online tool developed as a data collection tool for research activities on SL tests with deaf SL participants. The design of cross-modal, bilingual SL/written language, grants the accessibility of content for deaf users whose preferred means of communication is SL, and controls bias by the use of an SL interpreter during the tests. This accessible design also provides better linguistic and cultural concordance between researchers and participants (McKee et al., Reference McKee, Schlehofer and Thew2013) and promotes inclusive research (Guardino and Cannon, Reference Guardino and Cannon2016). An example of the cross-modal, bilingual questionnaire appears in Figure 1, in the version implemented for the pairing of Spanish/Spanish SL.
Example of SL Questionnaire interface for Spanish/LSE languages.

Usability assessment is a challenging issue in various areas, such as eLearning platforms and web interfaces, especially in cases where accessibility is specifically required (Oztekin et al., Reference Oztekin, Delen, Turkyilmaz and Zaim2013). Machine learning based evaluation methodologies are used for assessing the usability of applications and online systems because these techniques are flexible and effective, as well as scalable when the number of users increases (Bibal and Frénay, Reference Bibal and Frénay2016). Typical outputs for statistical measurement of usability include the number of errors and success rate or the average time to complete tasks (McGlinn et al., Reference McGlinn, Yuce, Wicaksono, Howell and Rezgui2017). For that reason, the inclusion of estimation models for assessing usability proposed in this paper employs demographic data, timestamps, and tracking the interaction for predicting the average time to complete a questionnaire or each individual question.
Objectives and methodology
The objective of this research is towards the creation of machine learning estimation models for assessing the usability of a system based on SL questionnaires that are created to facilitate SL understanding during activities in environments, such as education or research. These activities include a wide variety of functionalities. For example, the testing of new configurations for presenting SL interpreting on television, or the assessment of the acceptance of a new 3D SL avatar, with the advantage of avoiding the intervention of an interpreter while employing user native language and fulfilling the informational needs. The storage of tracking interaction in relation to the sociodemographic data answered by the user allows the creation of Artificial Intelligence models, used for estimating the usability of SL questionnaires. The questionnaire, which is easily available via web browsers, uses translations on SL recorded in video and displayed with HTML5 players. With this innovative tool, it is possible to generate an integrated testing environment accepted by the deaf community.
The process included the following phases:
1. Definition of requirements. The preliminary set of requirements of the system has been defined after interviews with SL-native users and from the experience acquired by members of the interdisciplinary research group after working with the targeted end-users. The basic requirements of the system include: (a) a need for creating systems adapted to users who consider SL as their native language, (b) a generation of interpreter-independent systems for increasing the volume of signed contents, (c) the utilization of human interpreters instead of 3D avatars or other kinds of virtual models, (d) high usability and accessibility for a variety of audiences. And, with regards to the SL questionnaire itself: (a) fluidity in the playback of the contents, (b) intelligibility of SL videos through a good perception of the face and upper-body, (c) the development of human–computer interaction (HCI) techniques for the improvement of usability.
2. Definition of the questionnaire structure. The structure of the questionnaire involves different types of questions for obtaining qualitative and quantitative data.
3. First approach for the interface development. A first version of the interface based on web technologies was developed with the inclusion of databases for the storage of answers and information about tracking in order to obtain feedback from user interaction.
4. Pre-test for refinement of the interface. Based on feedback obtained after usability and accessibility tests with target users with the aim to improve the final result.
5. Design and development of a testing plan that allows the assessment of the system. The testing plan with the target end-users is defined for training the ML models and assessing the system.
6. Final test performance with the targeted end-users. A set of users completes the SL questionnaires in order to train and test the ML models, assessing the validity of the system.
7. Definition of predictive algorithms for assessing usability. The use of demographic and interaction data from the users as features of the machine learning model allows the estimation of the system's usability. The data obtained in the tests performed are used as input for the training for the models and as a consequence, for testing these ML models.
8. Drawing conclusions about the successful or unsuccessful fulfillment of the initial hypotheses.
For testing the estimation models, two experiments involving SL are designed as questionnaire prototypes, in order to simulate an environment as realistic as possible:
1. Experiment 1: Documentary “Joining the dots”. Four videos with their corresponding SL translation with different configurations of size and position are presented to the user for an analysis of the level of comprehension in each of these configurations.
2. Experiment 2: Avatar (virtual model). A weather forecast program with a corresponding SL video developed by a 3D-model avatar is presented to the user to assess the quality and comprehension related to the expressiveness of the animation.
Related work
The evolution of methodologies used for empirical research requires valid and replicable tests (Orero et al., Reference Orero, Doherty, Kruger, Matamala, Pedersen, Perego and Szarkowska2018). For that reason, in empirical research related to audiovisual content, it is mandatory to apply direct translation, especially in multilingual environments where the language is the target and factor to be considered in this research. A typical human interaction with a computer is conducted in the native language, and the same should happen during the interaction from the point of view of the deaf community (Smith et al., Reference Smith, Morrissey and Somers2010). Nowadays, the creation of deaf-friendly interfaces and applications that allow access to information for all is a challenge for the Information and Communication Technologies (ICT) society. There is a need to improve the designs for the translation and adaptation of content, avoiding stereotypes, and the lack of involvement of people with disabilities in the requirements definition phase in most designs (Lazar et al., Reference Lazar, Feng and Hochheiser2017). The design of interfaces applied to ICT systems must encompass human factors, computer science, and cognitive sciences for improving the interaction with content and information (Helms et al., Reference Helms, Arthur, Hix and Rex Hartson2006).
The iterative refinement during the design of these communication systems requires a process of feedback from the target users (native signers and interpreters) to help developers improve the accuracy and efficiency of the system. Unlike other developments, the proposed system relied on collaboration with real end-users so as to obtain the best refinement based on real feedback. This, in turn, helped to improve its application and adaptation to their basic needs.
Videos with human signers are generally the preferred media to present SLs (Tran et al., Reference Tran, Flowers, Risken, Ladner and Wobbrock2014). It allows for the application of different techniques in order to increase the ontologies and variety of sentences in the systems. Intelligibility associated with this type of technique is important in order to transmit SL content, including video encoding analysis and quality assessment, especially in environments with limited bandwidth such as mobile streaming (Cavender et al., Reference Cavender, Ladner and Riskin2006; Tran et al., Reference Tran, Kim, Chon, Riskin, Ladner and Wobbrock2011). Intelligibility of SL videos must be assessed in different environments, including television, mobile phones, or tablets, to ensure encoding quality processes and resolutions for end-users (Ciaramello and Hemami, Reference Ciaramello and Hemami2011). As the proposed system is based on SL videos, the intelligibility of these videos should be carefully analyzed, according to state-of-the-art developments in this field and to previous research (Tran et al., Reference Tran, Riskin, Ladner and Wobbrock2015). Issues such as size, resolution, and encoding quality of the videos should be considered, allowing for different configurations adapted to user preferences with optional, full-screen playback and not excessive compression, as it reduces loading time but at the expense of viewing quality.
Some researchers (Haug and Mann, Reference Haug and Mann2007; Haug, Reference Haug2011, Reference Haug2015) have analyzed the adaptation of tests for SL environments based on a mixture of concepts that include linguistic, cultural, and psychometric factors. The design of solutions corresponding to teaching and research environments is important in order to equate the SL with the written language through full bilingual systems. This improves learner motivation in terms of vocabulary and conversational matters. The aim of bilingualism in accessible tools oriented to experimental designs and surveys is to minimize the error in comprehension and, consequently, the nonresponse bias, that is, the rate of “DK/NA” (“I Do not Know, No Answer”) answers. The design of interfaces with social objectives should never overlook leisure and amusement factors (Shneiderman, Reference Shneiderman2004) and the advantages of Connected TV and interactive platforms could contribute to this goal (Vinayagamoorthy et al., Reference Vinayagamoorthy, Allen, Hammond and Evans2012). Proposals for these types of tools are scarce and adapted to the target environment. Our proposal allows adaptation to different environments and is based on generic software tools resulting in a powerful system, adaptable for different purposes and configurations; similarly, a web interface makes it easier to access the network without requiring new technological demands on the user.
Machine learning provides the basis of data mining, extracting information from data, and organizing it in structural descriptions, which are used for prediction, explanation, or understanding of existing problems. The result of this process of learning is a description of a structure that is valid for classifying new examples (Witten et al., Reference Witten, Frank, Hall and Pal2016).
The machine-learning methodologies are employed for different purposes based on the creation of models for solving existing problems in a variety of environments. The development of these models focuses on establishing quantitative structure–activity relationships (Liu et al., Reference Liu, Zhao, Ju and Shi2017).
Assessing the usability of interfaces in the fields of web design and interaction requires the inclusion of features related to end-users and the context of application. The perception of usability can be treated as a classification problem that employs supervised machine learning methodologies (Longo, Reference Longo2017). Supervised ML classification techniques are used in usability environments and other research fields in order to produce computational, data-driven models for prediction of output features, such as mental workload measurement (Moustafa et al., Reference Moustafa, Luz and Longo2017) or human cognitive performance in problem solving (Yoshida et al., Reference Yoshida, Ohwada, Mizoguchi and Iwasaki2014).
For the correct characterization of participants and definition of models for the estimation of usability, it is necessary to include demographic questions regarding the age at which they became deaf and their knowledge of signed or written languages. These data are used for classification purposes in the process of training the model. This research counted on the collaboration of end-users from prestigious associations for deaf people, testing HCI issues, and using their feedback as input for the system improvement process, as well as the input data for the trained ML models.
Implementation of SL questionnaires
This section describes concepts about the implementation of the SL questionnaire, from the structural design of the questions in Section “questionnaire design”, to the technical proposals put forth in sections “HCI and intelligibility of SL videos”, for improving HCI and intelligibility of the videos, topics which are necessary to introduce before understanding the ML models for estimation of usability corresponding to Section “definition of models for estimating elapsed time based on demographic data”.
Questionnaire design
Different methodologies were analyzed towards creating surveys involving both people with disabilities and multilingual environments. Extensive, state-of-the-art research defines the techniques for obtaining qualitative and quantitative information, considering factors such as question type, the type of collected data, and the target population (Ferber et al., Reference Ferber, Sheatsley, Turner and Waksberg1980). Fontaine (Reference Fontaine2012) proposed the use of mixed-mode methodologies with different types of questions for assessing multiple factors in quantitative research surveys. Finally, as the research employs the use of web technologies, it is necessary to follow methodologies applied to HCI in the SL questionnaire (Lazar et al., Reference Lazar, Feng and Hochheiser2017).
With these premises, the content of the questionnaire is designed in four sections:
• Section Introduction: Welcome Video. This section introduces the questionnaire to the user through a video that contains instructions to be followed during the process, while presenting relevant information about the research for obtaining informed consent. This section is mandatory for motivating and engaging users in the completion of the questionnaire, as well as for ethical requirements.
• Section Objectives and methodology: Demographic Questionnaire. The demographic questions have two aims: (a) obtaining statistical information about the user and (b) collecting data from the user, which are needed for the classification in the creation of ML models, in order to understand the influence of user environment and features in the usability of the system. These questions seek to obtain information about:
o gender
o age
o technological experience
o level of studies
o age at which the person became deaf
o level of understanding of each specific SL or written language, accessibility tools experience, especially those associated with multimedia content (device used for the completion of the SL questionnaire)
• Section Related work: Targeted Video and Memory Questionnaire. The memory questionnaire is designed to evaluate the recalled information after watching complex, on-screen, visual stimuli. This includes the information offered by the SL video and the content images on the main screen. A recommended set of 5–20 different memory questions (10 in our experiments) is associated with each targeted video. Each question is intended to recall the sign-interpreted content in the interpreter window. This is focused on the visual recall of non-verbal information from the main video clip.
• Section Implementation of SL Questionnaires: User-experience Questionnaire. After the memory test, a set of user-experience questions is presented in order to obtain the feedback on the usability and readability of each screen configuration. Feedback is also obtained from user interaction, the difficulties found during the completion of the questionnaire, and their personal opinion about the test and its development.
Technical design and implementation
Having introduced the aspects of SL surveys and the HCI goals, the design and development process of the SL questionnaire and its functioning will be presented.
The interface is based on HTML5 technology, while the interaction and programming of the interfaces are based on JavaScript language capacities. HTML5 (HyperText Markup Language, version 5) (World Wide Web Consortium, 2017) contains libraries and is fully equipped to show different types of videos in an organized way, adjusting the sizes and order of the videos in the interface. JavaScript language (MDN Web Docs, 2019) presents different tools for the automatic playback of videos, including playing, pausing, or forwarding of the content, and other advanced functions, such as displaying contents in full-screen by using the basic commands of the platform.
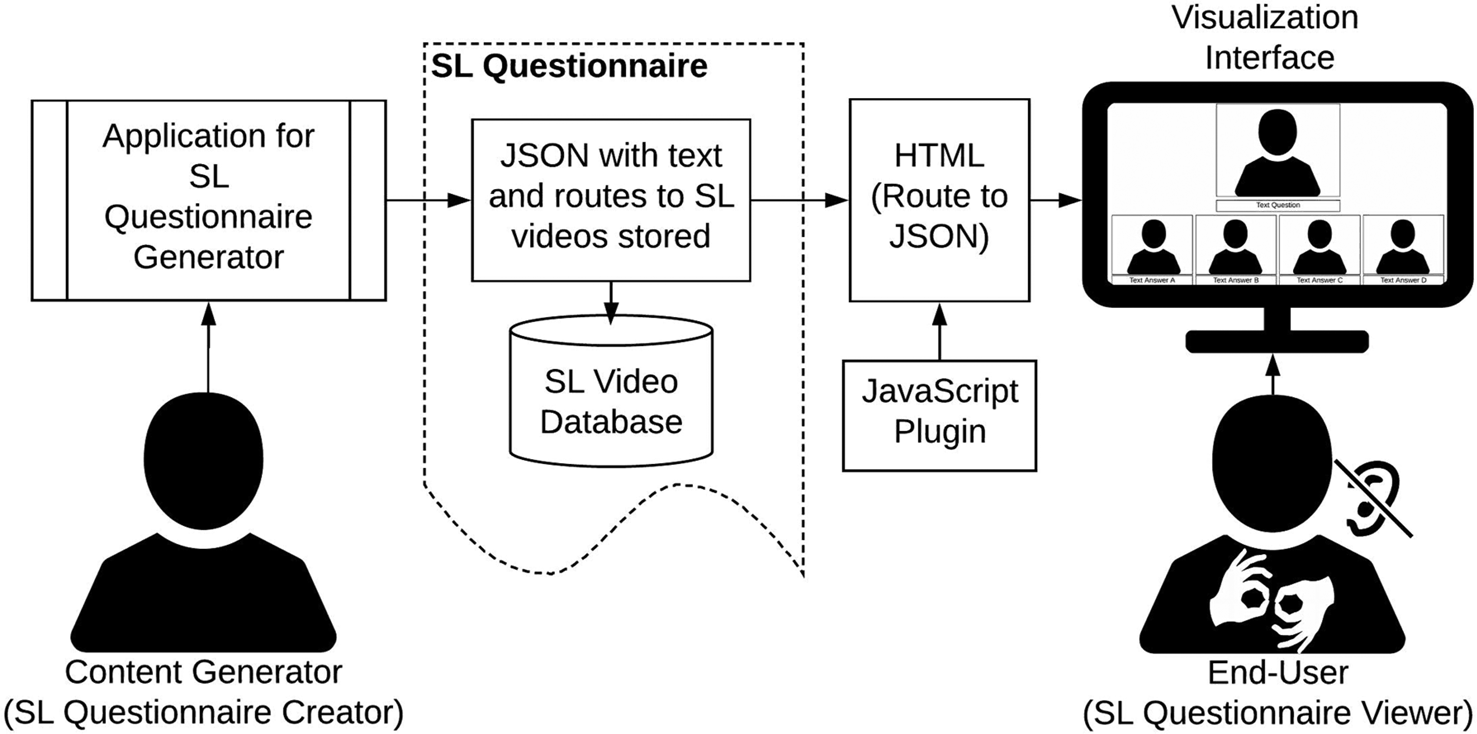
The questionnaire is based on a JSON (JavaScript Object Notation) (Internet Engineering Task Force, 2014) file that contains all the specific content related to the video and to the written information of the questionnaire. This content is organized into a set of questions. The questionnaire is defined by general attributes, including the author and title of the questionnaire, the language used, and the objective. These attributes contribute to the multilingual character of the experiment in one file, which is useful for international research where countries with different, official written and SLs are concerned. The instrument components are designed to be self-administered.
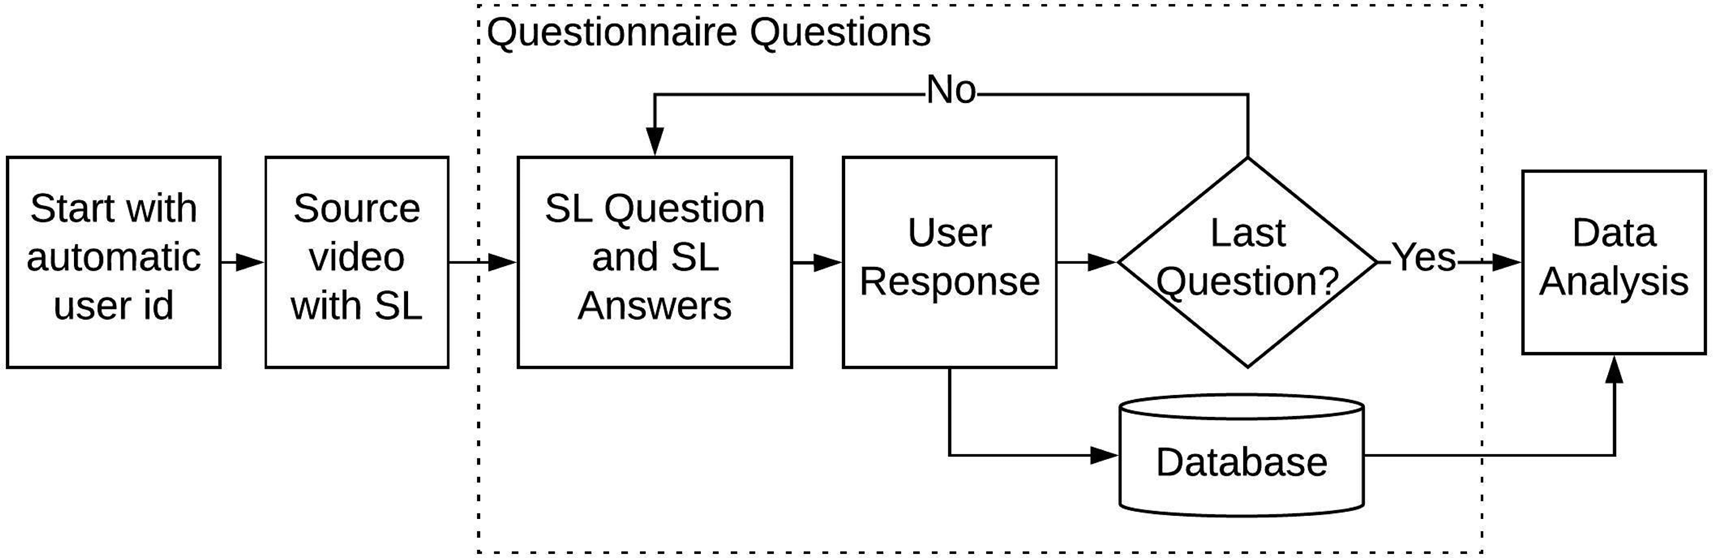
The function of each questionnaire is summarized in Figure 2. Firstly, a random identifier (“id”) is assigned in order to guarantee the anonymity and confidentiality of the user. The “id” is associated with the initial temporal instant (timestamp), with the aim of tracking the time taken to complete the questionnaire. If the questionnaire presents different models, such as a multilingual character or multiple choice, as in “Experiment 1”, where four different configurations are available, the selection is automatically randomized and assigned at the beginning of the session.
Questionnaire functioning scheme.

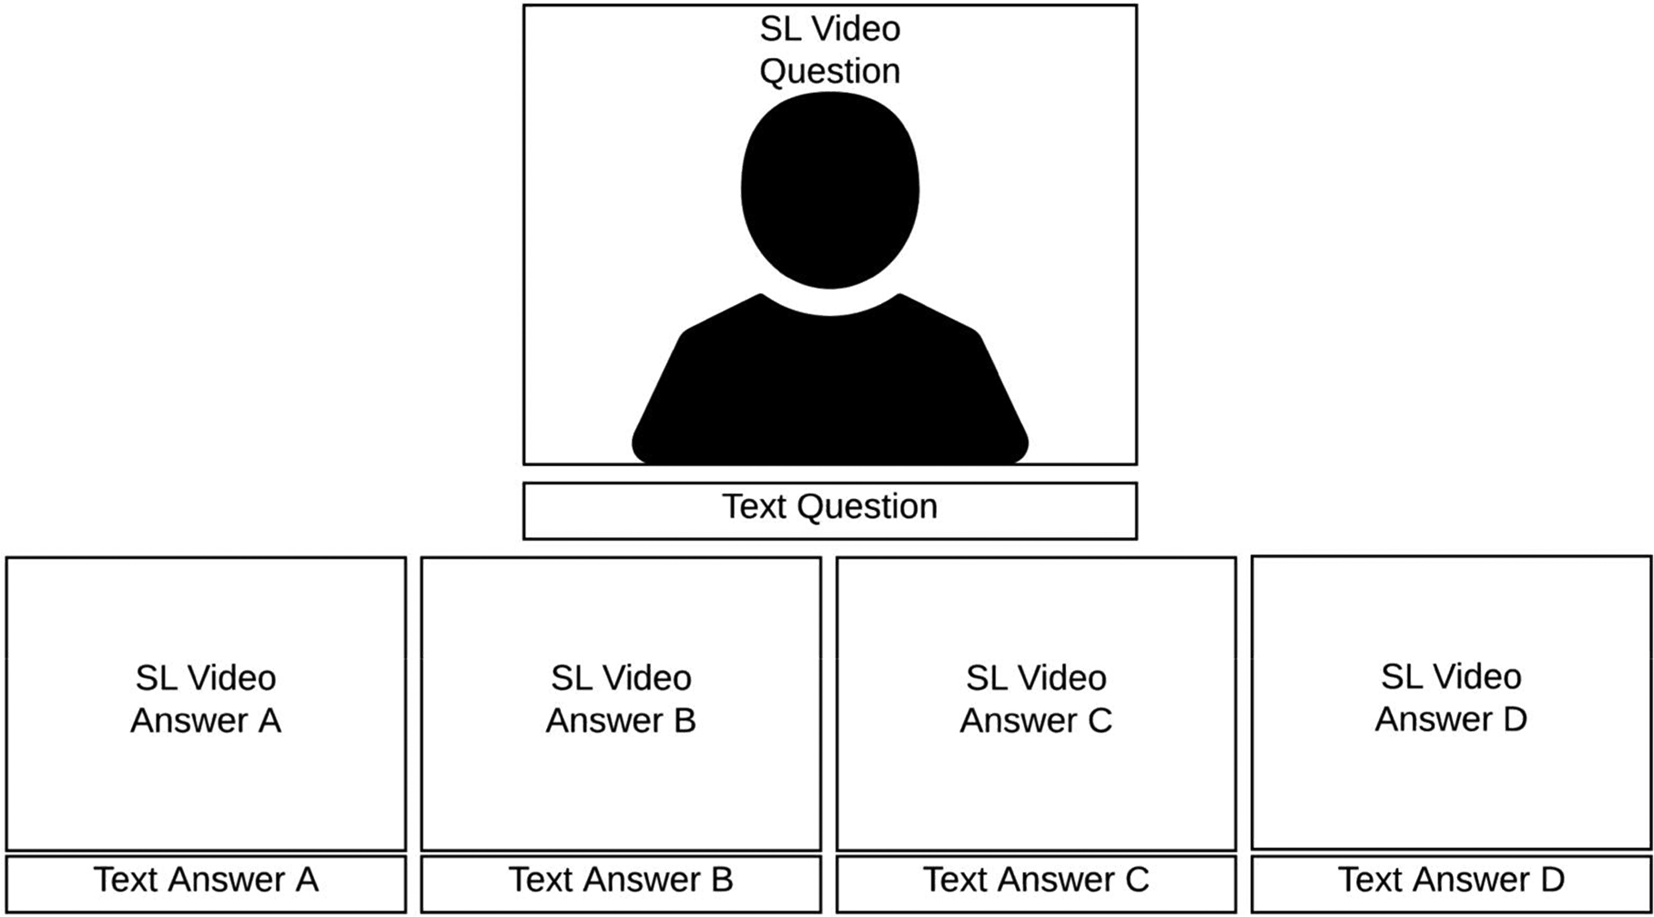
According to Tran et al. (Reference Tran, Riskin, Ladner and Wobbrock2015), the success of an online survey depends on its accessibility and usability. For this reason, it was mandatory to cover different factors related to the target audience, composed of deaf signers, and to the linguistic structure of the SL grammar and lexicon, as it is different from the structure of written language. The interface had to meet the requirements of usability and intuitiveness. Thus, the basic question interface was designed to present the bilingual content in both SL and its corresponding written language. The generation of bilingual survey instruments increases the target audience, including both native and non-native signers, regardless of their literacy and SL skills. For example, some users might prefer the written text, as is the case with hard-of-hearing and late-deafened individuals. The font of the text should fulfill the requirements of W3C Guidelines (Cooper et al., Reference Cooper, Reid, Vanderheiden and Caldwell2016, section G17), presenting enough contrast, in this case, black over white, in a readable size and with a “sans serif” font (Arial or Helvetica, for example). The computerized video questionnaire requires a specific layout and technical design. An example of the implemented bilingual question formats is included in Figure 3.
Example of interface for SL question with four answers adapted to 16:9 screen.

Human–computer interaction
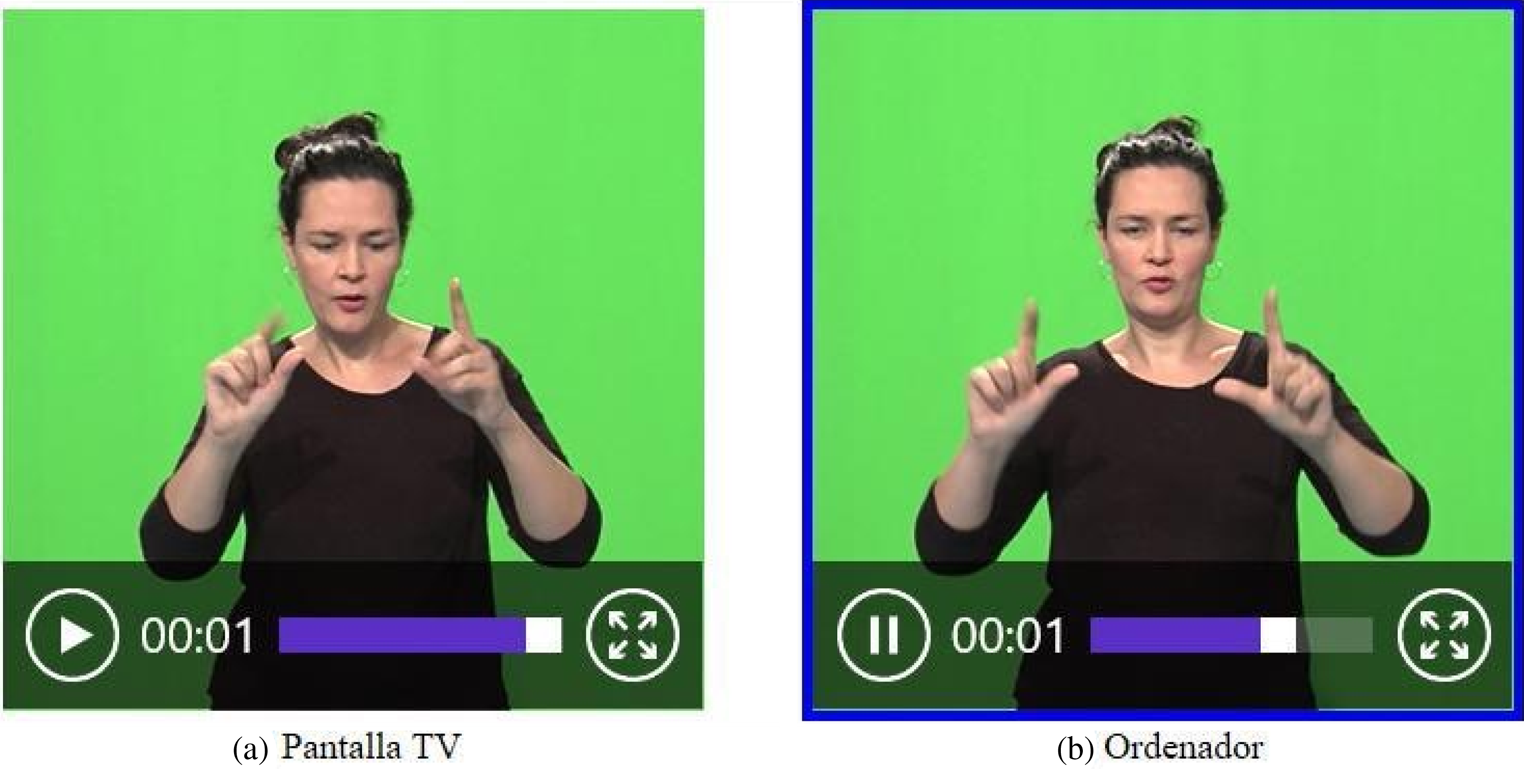
The techniques for creating an easy and intuitive method of interaction will now be presented. The first question that needed solving was the input of the interaction with the questionnaire. As the questionnaires were designed to be answered via computers or laptops, it was considered that users would interact through a conventional, manual mouse. A methodology was thus designed for saving time in the process of interacting with the visual interface: when the mouse pointer hovers over the framework of a video, the video is played; when the mouse pointer moves away from the video framework, the video playback pauses.
Questions are answered by clicking on either the video or the text box of the selected answer. Once the choice has been made, the interface displays a blue box surrounding the framework, as in Figure 4. The user can change the answer by clicking on a different option and also by clicking once more on the previously selected response item in order to deselect it.
Example of interaction when answering a question in the SL Questionnaire.

The methodology for playing video and clicking on the answer was tested in pre-tests. Testers, during the pre-test period, showed confidence in the use of this technique, which was considered acceptable to the users. Initially, the interface included an automatic video-playback loop, but some users complained about this, so it was discarded. It is important to mention that, as the system is a multi-screen web interface, the computerized questionnaire is available on conventional browsers on all different types of devices, including computers, laptops, televisions, mobile phones, and smartphones. Testing was conducted in controlled environments on computers with 17-inch screens.
Additionally, the W3C Guidelines (Cooper et al., Reference Cooper, Reid, Vanderheiden and Caldwell2016, section G54) recommend including “a mechanism to play the video stream full-screen in the accessibility-supported content technology”. Consequently, an interactive, easy-to-use menu was included in the videos. This allowed each video in full-screen to be played and repeated or paused if necessary.
Another remarkable aspect of the interface design is the ability to work online, as the questionnaire is based on HTML5 and JavaScript libraries and available on conventional browsers. When online research is carried out, it becomes easier to increase the participation in the recruiting process and to reach users that would have been difficult to contact through face-to-face interviews, especially in the case of people with disabilities (Petrie et al., Reference Petrie, Hamilton, King and Pavan2006). The online questionnaires' anonymity and privacy is an advantage, which avoids the influence of the interviewer during the process (Lazar et al., Reference Lazar, Feng and Hochheiser2017).
Intelligibility of SL videos
Video SL Intelligibility is necessary for a correct visualization. For that reason, the SL videos were professionally filmed at a Spanish Broadcasting studio. Attention was paid to lighting and contrast with the background of the picture. A green panel for chroma-key was used to add transparency to the background or a change in the color if needed. Green offers enough contrast with the black outfit of the signer in order to make the face and hands distinguishable from the background.
According to the W3C Guidelines for SL video creation (Cooper et al., Reference Cooper, Reid, Vanderheiden and Caldwell2016, section G54), “If the video is too small, the SL interpreter will be indiscernible”. For that reason, unnecessary space in the image was reduced and human content was highlighted. Determining the signing space was carried out with care, that is, how much of the signer was visible in the video frame was carefully assessed. Following this section G54 of the W3C guidelines, it was decided that only the area extending from the top of the head to the hips would be filmed, rather than the full body of the signer (Reference Pyfers, Robinson and SchmalingPyfers et al., n.d.).
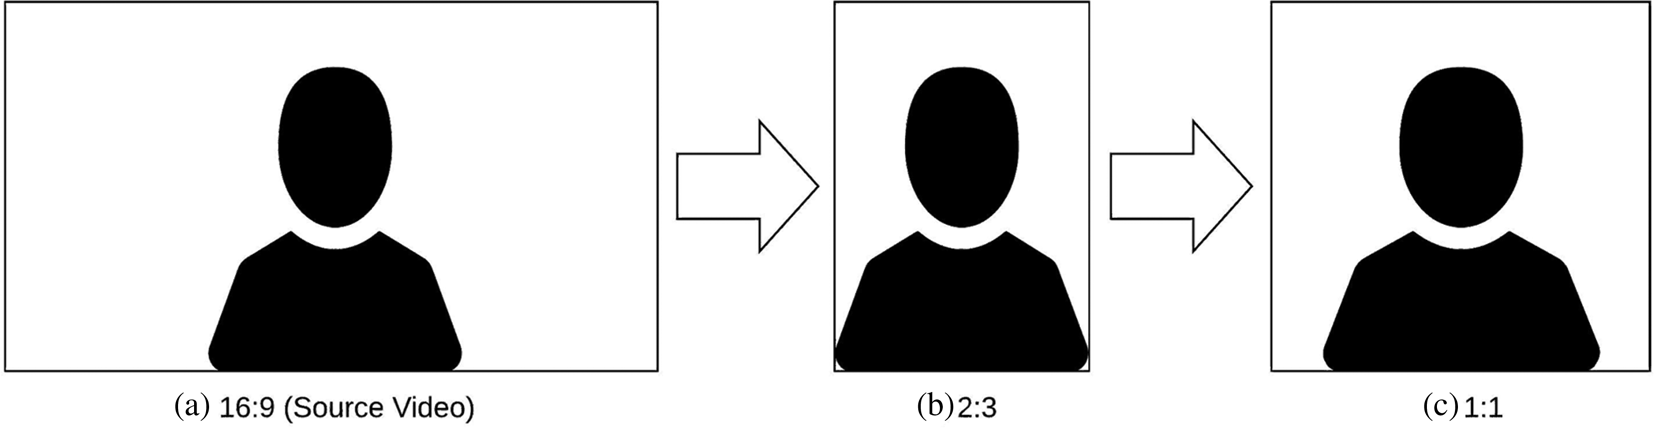
Videos were originally recorded with the aspect ratio 16:9 at resolution 1920 × 1080 at 25 frames per second (fps) and at an interlaced rate. This is one of the most common formats of high definition video. In the post-production phase, a decision was taken to crop the lateral air of the source images in order to reduce the number of display pixels. In the first approach, the content was adapted by cropping the image to an aspect ratio of 2:3 and by not introducing any kind of distortion or deformation of the content, only cropping. The first iterative testing with users suggested that the lateral air was not acceptable because the arms of the signer were not visible the whole time. For that reason, the image was cropped to obtain square frames, that is, aspect ratio 1:1. This was well received by the end-users when queried during the testing process. The changes in the presentation of SL videos are summarized in Figure 5.
Aspect ratio changes for the creation of content: (a) Source video filmed in 16:9, (b) first approach cropping to 2:3, (c) second approach cropping to 1:1.

Due to limitations of bandwidth and device display features, encoding was also an issue. Compression and distortion factors should be taken into account when assessing video quality so as to prevent the appearance of artifacts due to motion and high frequencies in the face and arms of the interpreter. It is also necessary to reduce the size and use compression for reducing the video encoding bitrate. This will allow for a faster video loading time, even when the user suffers poor network conditions. Videos were encoded in H.264 standard at a minimum encoding bitrate of 1 Mbps, and the resolution was reduced to 320 × 320 pixels, in accordance with the minimum requirements demanded in similar studies (Tran et al., Reference Tran, Riskin, Ladner and Wobbrock2015). Testing with users revealed that the quality in these conditions was enough for intelligibility requirements.
Question design and technical formats
Different types of questions and responses are used in the survey. The type of questions can be classified in different categories depending on the content (demographics, memory, and user experience) and the question format. Question formats vary according to the number of answers (in enumerated or fixed choice response options), the number of eligible answers (single-choice or multiple-choice), and the type of answer (close-ended, a number, a percentage, versus open-ended, such as a short sentence, phrase, or free text).
Different technical format designs are implemented for survey questions depending on the type of answer and responses items offered to the users. The interface must be adapted to a high-definition resolution of 16:9 aspect ratio, as a basic requirement used in laptops and commercial televisions. Following this premise, the layout is divided into two horizontal rows. The top row includes the SL video for the question and its corresponding written translation. The bottom row contains the answers, including both text and video response items. In all surveys, the question is displayed more prominently than the response options.
The layout is simple, avoiding any extra information that could distract, introduce bias, or further increase reading time. Only the button for “next question” is included at the bottom of the screen. The user has to click it to submit an answer. Clicking this button before selecting a response will prompt an error so as to prevent missed questions. This basic layout may be further adjusted and formatted for specific question and response types. Most question formats displayed several video clips for both the question and the response. However, questions with a number scale response, open-ended text response, and multi-part questions (e.g., day/month/year) only display one signed video clip.
Definition of models for estimating elapsed time based on demographic data
The main motivation for the use of machine learning models is based on finding a robust prediction for the usability of the interface through the generation of patterns associated with the different features of the end-users, such as age, level of studies, or knowledge of a language, based on the patterns found in the process of completion of the SL questionnaire. The completion of the questionnaire is parameterized by calculating a weighted average for the prediction, based on the estimations provided by the different models.
Assessment of the user's interaction gives essential information regarding the analysis and prediction of a usability evaluation paradigm based on the concept that the more data stored, the higher the accuracy of the results.
The analysis obtained by the application of SL questionnaires is not only related to the answers of the questions themselves. Data mining techniques enable the acquisition of information from data generated by the users during the process of interaction, which is relevant for understanding the problems and issues that may be presented to the user. The analysis of the time it takes to complete the survey and each individual question can reveal important information about the difficulties found, the level of user attention in the answering process, as well as the usability during the process.
A database based on SQL (structured query language) technologies is used for storing the data. Simple queries developed by the analyzer of the survey can be used to access the information extracted from each questionnaire, for comparison, other user responses with similar or differing profiles which can then determine trends in the use of technology and usability of the system.
The generation of time estimation models is based on the exhaustive analysis of test results. The dataset containing more than 60 users with demographic values, such as age, level of studies, knowledge of SL and written languages, or the consumption of accessibility contents, was used to find patterns in the analysis of time spent in the process of completion of the SL questionnaire. The analysis of time is important because it reveals the usability and intuitiveness of the interface.
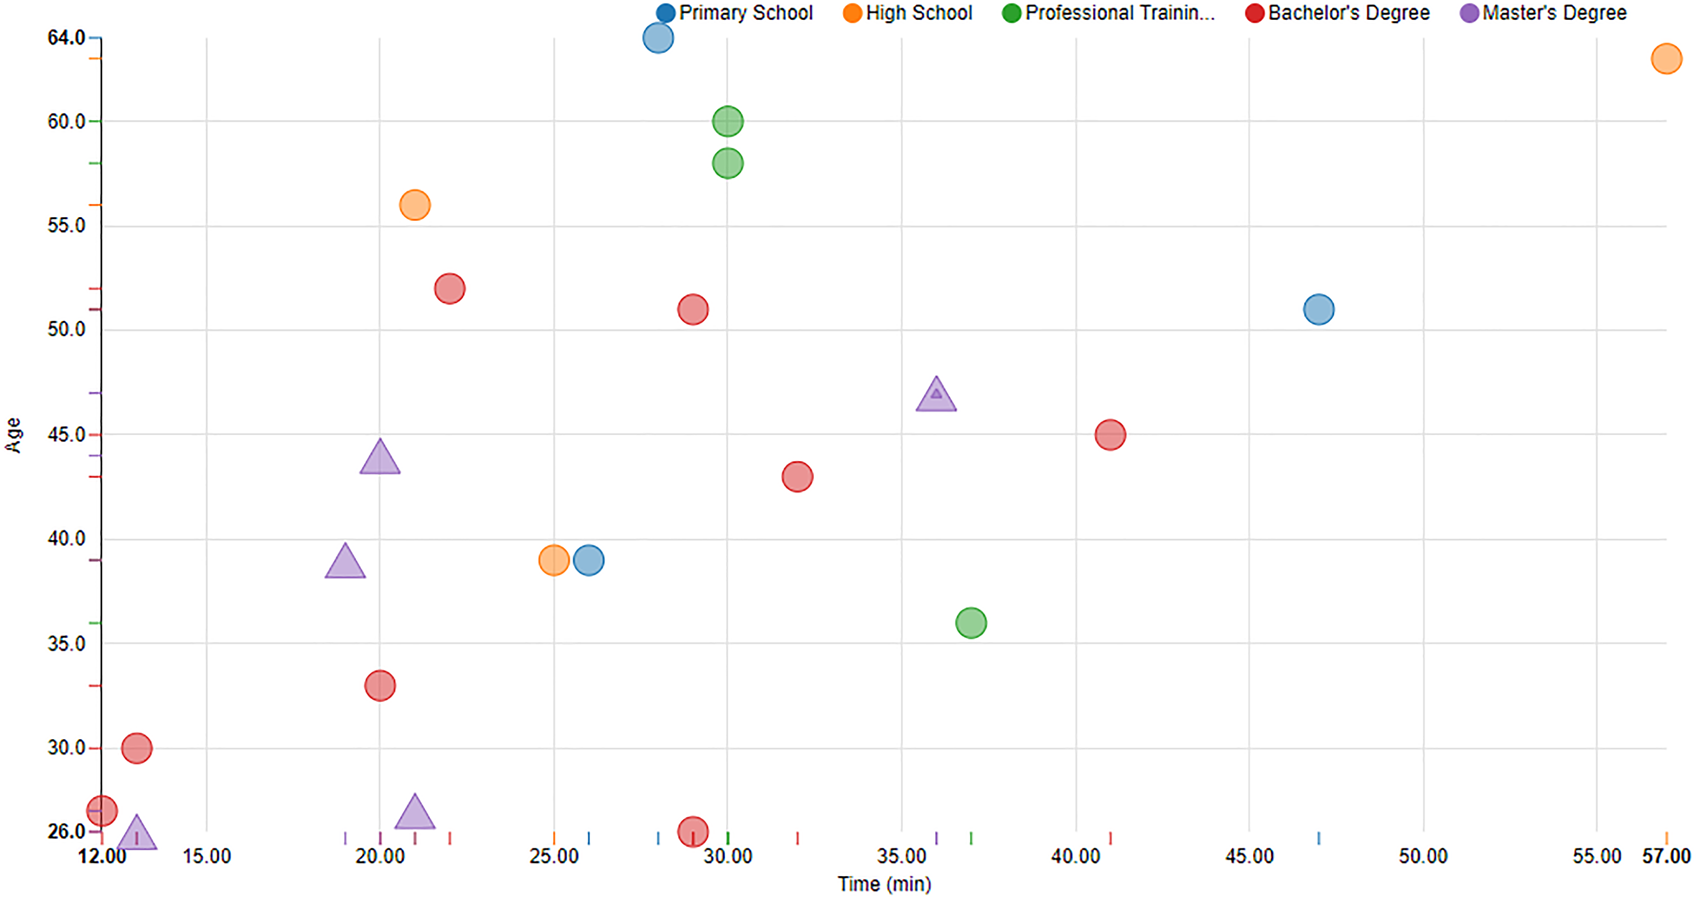
By removing the data of outliers and variance timings, a cleaning process was developed from the original database. Sixty samples were available for analysis with 18 non-categorical features corresponding to each of the answers in the demographic questionnaire. These features are used for selecting the most relevant responses in order to reduce the complexity of the machine learning models. In order to highlight the most relevant features, a univariate feature selection is performed on the data by finding patterns from the demographic set. Through this process of cross-validation (Kohavi, Reference Kohavi1995), the selection of the most useful parameters was based on reducing error and finding linearity before applying mathematical models to the process. As demonstrated in Figure 6, the most relevant parameters in the analysis of the time of completion of the SL questionnaire are associated with age and level of studies.
Questionnaire completion time in minutes related to age and level of studies.

The use of a non-linear regression model based on one or two of these features was initially contemplated, but the technique was discarded due to a need for a more robust estimation, relative to the increased information in demographics. A coefficient associated with each feature selected from the list of demographic answers after the cleaning process was found by following the Lasso regression modeling developed by Eq. (1).
 $${ \hat{\rm \Upsilon}} = \beta _1\mathop \sum \limits_{i = 1}^N \beta _{i\;} x_i + \lambda \; \mathop \sum \limits_{\,j = 1}^M \vert {\beta_j} \vert $$
λ represents the parameter of a penalty and β 1. …., β i, β j indicate the set of coefficients associated with each demographic answer of the model after the training development procedure.
A second approach to increase the complexity of the estimation of the usability model consisted of a XGBoosting (Xtreme Gradient Boosting) procedure; gradient Boosting benefits from the addition of regression models in order to fit simple, parameterized functions following a sequential tree structure. Iterations aim to reduce the residual error following Eq. (2) as defined in (Friedman, Reference Friedman2002).
 $$F^{^\ast}\; \lpar x \rpar = \arg \;{\rm mi}{\rm n}_{F\lpar x \rpar }\; E_{y\comma \,\; X\;} {\rm \Gamma} \lpar {y\comma \,\; F\lpar X \rpar } \rpar $$
 $\lcub {y_i\;\comma \, \; X_i} \rcub _1^N$ represents a set of training samples, made up of varied features corresponding to the demographic answers identified as X = {x 1, …, x k}, k being the number of questions. On the other hand, F*(X) is the goal function obtained by mapping each pair (y, X) with the gradient boosting algorithms, to find the combination where the loss function Γ(y, F(X)) is minimized.
Finally, an approach based on artificial neural networks was developed. The neurons are processing units that interconnect through different coefficients or weights and organize the set of parameters into different layers. Layers combine the inputs corresponding to the answers of the 18 demographic questions in order to obtain timings associated with usability during the selection process.
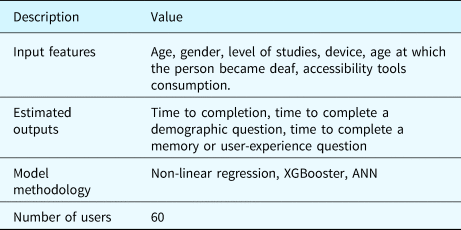
The models generated for estimation of usability employ a set of input features based on demographic data collected during the completion of the questionnaire. On the other side, the estimated outputs correspond to times for completion of the questionnaire and times for completing each individual question, distinguishing demographic questions from the rest, due to the immediacy aspect in the response of this type of question. The summary of the characteristics of the models is included in Table 1.
Summary of usability estimation models

Empirical results and discussion
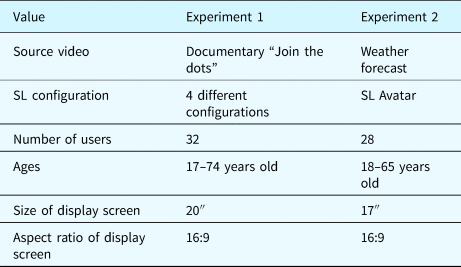
The effectiveness of SL questionnaires depends on the way in which users are able to interact with the interface and, consequently, on the time spent completing each individual question. The feedback obtained in pre-tests with targeted users helped in the design of two experiments used to evaluate this effectiveness, which is strongly linked to usability. These two experiments aim to collect information about user satisfaction with the interface by tracking their interaction. Additionally, the design is able to test their capacity for observation and retention of content when visualizing the main source video with a simultaneous, corresponding SL translation, as well as assessing the loss of information as a result of this process. The accuracy of the answers to the “Memory Questionnaire” (as described in Section “questionnaire design”) is not the subject of study in this investigation, but the inclusion of this type of question is needed to fulfill the initial requirements and to help assess the usability of the SL interface. A summary of the basic description of the experiments is included in Table 2, along with the demographic data about the users involved in the process and additional information about their environment.
Description of experiments developed with SL Questionnaires

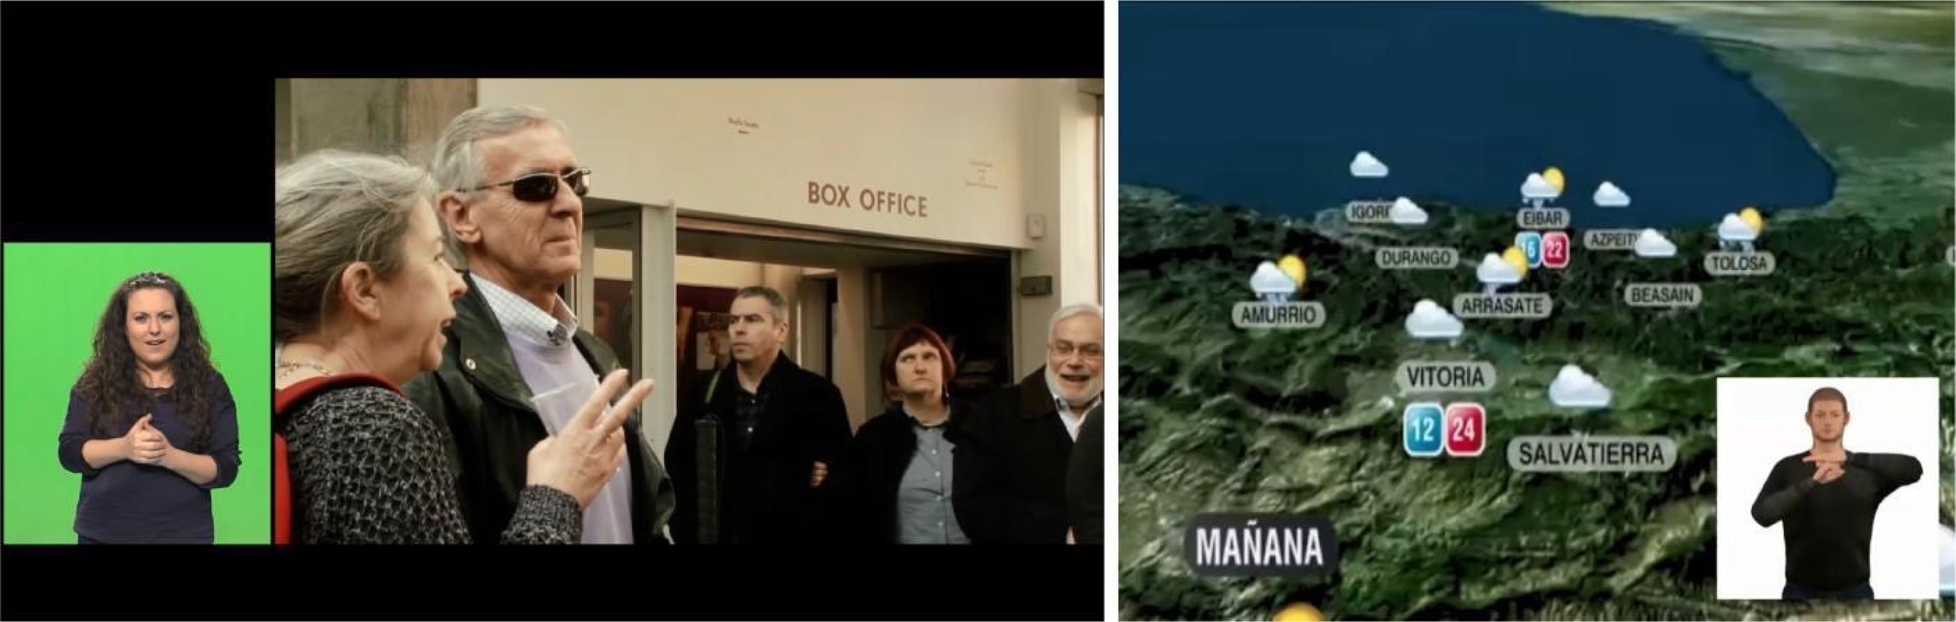
Experiment 1 consisted of presenting fragments of the documentary Joining the dots in parallel with the video corresponding to the SL translation in four different configurations of positioning and size. Figure 7 (left) shows an example of this first experiment. The SL questionnaire for this experiment consisted of 18 demographic questions including gender, age, level of studies, knowledge of textual and SL languages, consumption of accessibility tools or age of becoming deaf, among others; 10 retention/observation questions including both verbal and visual memory questions; and, finally, 12 experience related questions. A sample of 32 deaf users from the metropolitan area of Barcelona participated in this study, ranging in age from 17 to 76, all of whom have knowledge of and frequently use LSC (Catalan Sign Language) to communicate.
Images from the videos in the experiments: joining the dots (left), weather forecast (right).

On the other hand, Experiment 2 presented fragments of a weather forecast simultaneously with a video that included the SL translation developed by a virtual avatar. An example is shown in Figure 7 (right). The questionnaire for this experiment included queries of the following sort: 18 demographic questions similar to the ones used in the questionnaire in Experiment 1; 10 retention and observation questions, including both verbal and visual memory questions; and 13 experience related questions designed to obtain information about the quality of the SL avatar. A sample of 28 deaf users from the metropolitan area of Madrid participated in this study with an age range of 26–54. All of them had knowledge of LSE.
Results obtained through tracking data and interaction
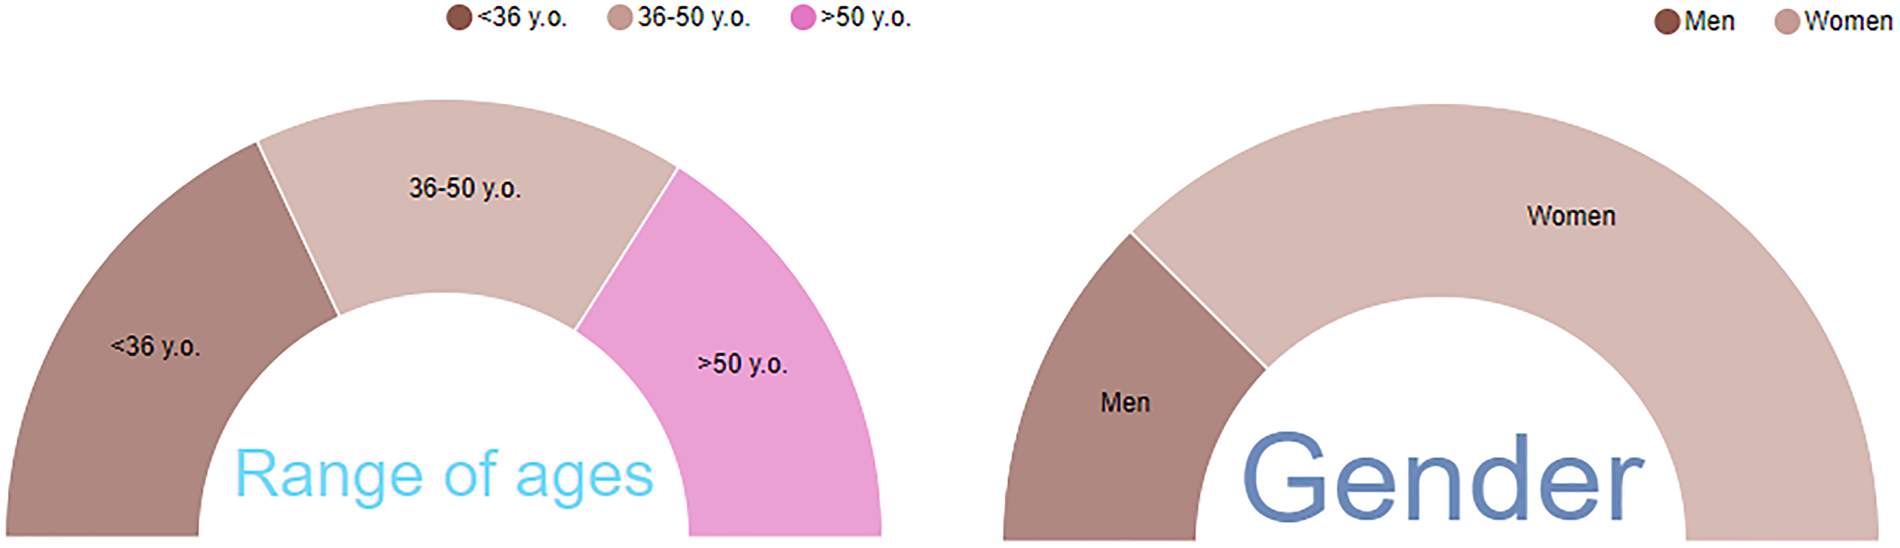
This section collects the results extracted after carrying out the experiments on a sample of users from two different locations. The demographic information associated with the sample of users is shown in Figure 8 revealing the characteristics of the sample. According to the demographic questionnaire, a majority of female users participated in the experiments for the SL questionnaires [Fig. 8 (right)]. The users were divided into three different groups according to age range [Fig. 8 (left)]: the youngest population was considered under 36 years old, while the advanced age users were considered from 50 and upwards. The distribution of users into these three groups assures the variety of populations necessary for this type of study. The selected ages allow for the differentiation of three user groups with different technological skills, which are representative enough for the analysis. In accordance with the times taken to answer the questions, it can be inferred that the younger population is more experienced with technology use. For this reason, the range of ages is a mandatory feature because it is related to experience in the use of technologies.
Demographic data of users participating in the experiments with SL Questionnaires: age ranges and gender.

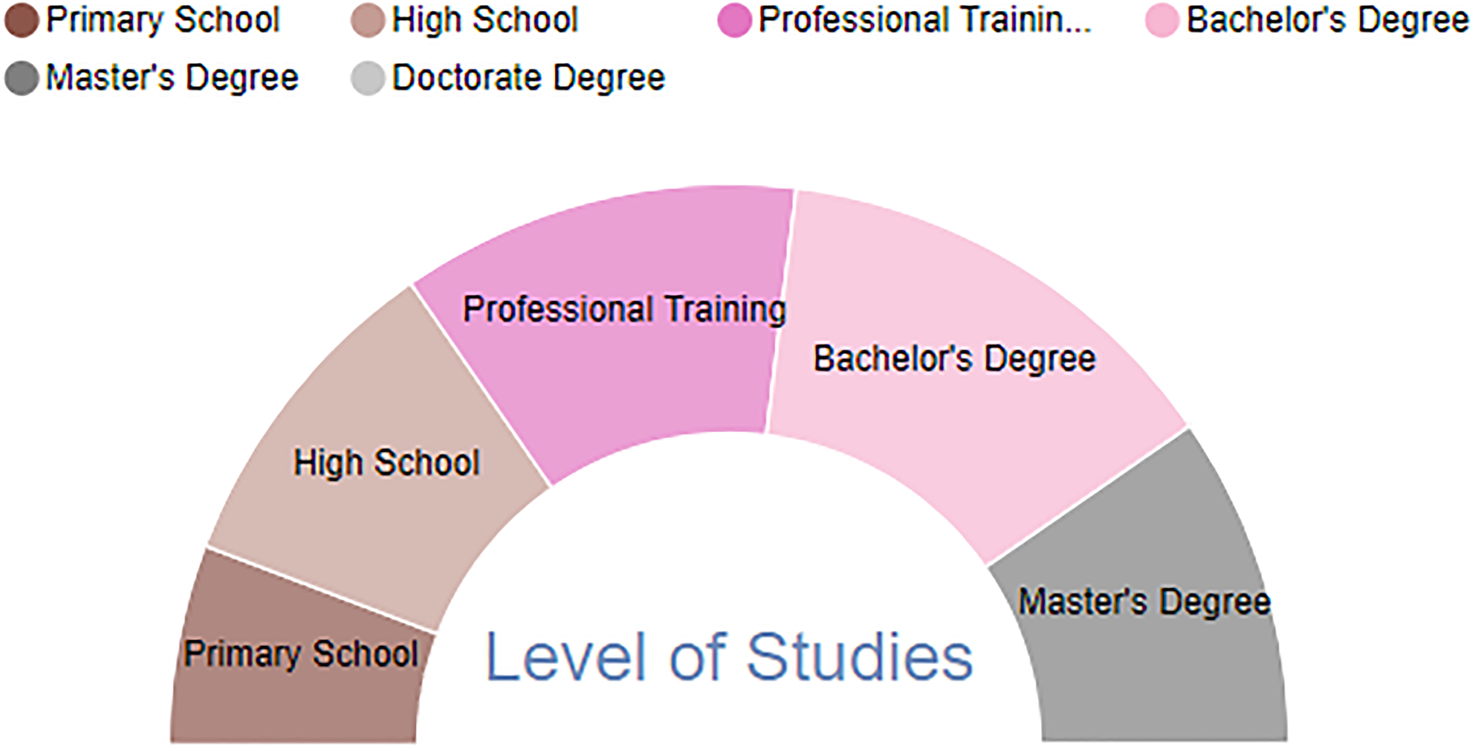
Another parameter to highlight in the assessment is the level of studies (Fig. 9), which is a mandatory feature for classifying the users. Based on an initial hypothesis, the formative level is decisive when estimating the usability and facility for interaction with the interface. Adaptations in the SL questionnaires are recommendable for people with different levels of studies or in a higher age range in order to improve the statistical results of future approaches.
Demographic data of users participating in the experiments with SL Questionnaires: level of studies.

Data mining and the analysis of information regarding user interaction is one of the most powerful aspects of the architecture of SL questionnaires, because it presents the researcher with extra information that could not be processed by hand. Storage of timing associated with each interaction produced by SL questionnaire completion when clicking a button or playing a video is necessary in order to draw conclusions, which would be difficult to obtain without this tracking information. It is important to emphasize that to draw reliable conclusions regarding this experiment, development of the tests in controlled environments is recommended. This fact requires verification if the user is observing the SL videos or just reading the text associated with each SL video. In other test environments, such as sending the questionnaire online to users belonging to the deaf community, it is recommended to observe the user-experience answers to ensure that the questionnaire has been adequately filled in.
The general time of completion in the SL questionnaire is part of the preliminary data, highlighting relevant information that is interesting to analyze when doing the final research (Fig. 10). As empirical data, the average end-user needs between 20 and 30 min to complete the survey in a controlled environment. However, users with less technological experience tend to present more difficulties in the completion of the survey and spend between 30 and 40 min on this task. Furthermore, there are users that need less than 20 min to complete the full SL questionnaire, because they consider it more efficient not to watch all the videos and thus save time, making a second visualization unnecessary. Finally, a small group of users spent more than 40 min on this task, representatively more than the average time. This occurred due to external factors affecting the users, which should be factored in order to have them potentially considered as outliers.
Distribution of time to completion of the SL Questionnaire about the avatar.

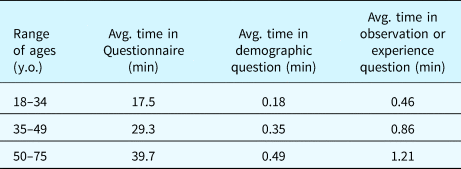
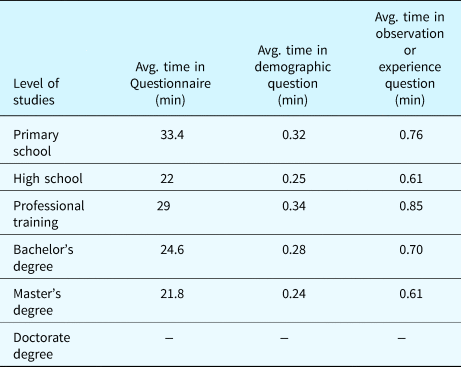
These data can also be interpreted in a context where the age range or level of studies is considered in order to corroborate the initial hypothesis that these two factors affect the usability of the interface. The average time for completing the SL questionnaire and the average individual times for answering the demographic, observation/retention, and experience questions revealed an increase in the time for solving this task, which corresponded with age (Table 3) and level of studies (Table 4). Younger users and those with higher formative levels needed less time to answer the SL questionnaire and each individual question, as demonstrated with empirical data. Finally, it is necessary to mention that no users with a Doctorate Degree completed the survey, for that reason there is no data for this case study. Reflecting on the absence of this type of population, it is hoped that this is not due to the difficulty of integration in this field.
Average time to completion for the Avatar SL Questionnaire per age range

Average time to completion for the Avatar SL Questionnaire per level of studies

The accuracy of the three ML models generated for the purpose of estimating usability is over 80%, when using 80% of the SL questionnaires for training and the remaining 20% for testing the algorithms, while considering the three fundamental demographic parameters (age, gender, and level of studies) as input features for the models. This fact indicates the trends in behavior of these features in the system. For assessing the usability of the interface, the three output features correspond with the time spent in the completion of the SL questionnaire, the time spent in answering each demographic question, and the time spent in answering any other type of question. In the case of a new user completing the SL questionnaire, the system estimates the time of completion and the time of answering each question in accordance with their demographic features with an accuracy of 80%.
Conclusions
SL Questionnaires received a good reception among the deaf and hard-of-hearing audiences that communicate in SL languages and that consider this way of communication in their native language. Most users during the testing phase highlighted the necessity of this type of tool as a symbol of integration and diversity in the access to information.
The techniques employed in HCI demonstrated the improvement in usability and intuitiveness that the presented interface offers. The organization of contents and interaction with the video for playing, pausing, or clicking the correct answer was well received during the iterative testing phase, and in the subsequent experiments based on the feedback transmitted by participants. The online character of the interface and the structure of the SL questionnaires facilitate multilingualism and the expansion of this survey in order to reach a higher number of users, although the first tests were developed in controlled environments with supervised attention.
The demographic information classifies users with a set of features helping to draw conclusions about usability, which is very important in the definition of ML models. In that sense, the data stored in the database on interaction and timing of the process is very helpful for understanding the process of HCI in this environment, allowing for estimations to be made about the quality and usability for the user in accordance with the SL questionnaires.
The generation of estimation models based on patterns found in the process of computing data according to the demographic data, such as level of studies or age, is an important issue derived from the use of this type of tool. The time spent on answering a demographic or memory question can be assessed in relation to the regression function, using different machine learning techniques, including Lasso Regression that includes a model based on the weight of different demographic parameters; XGBoosting (Xtreme Gradient Boosting) following a sequential tree structure to compute these parameters or Artificial Neural Networks.
As demonstrated by the empirical results (Fig. 6 and Tables 3 and 4), the age and level of studies of the end-user influence the time of completion of the questionnaire, because the formation and familiarization with technologies are paramount in regards to the usability of the interface. Nevertheless, users with little education and of an advanced age were capable of interacting with the application, indicating good interface usability.
For future work, the use of this tool is anticipated for the generation of SL questionnaires, to create new surveys about the consumption and use of innovative accessibility tools associated with multimedia contents. The online character of this survey will allow the distribution across different countries in Europe and will include a presentation in four different languages simultaneously.
Acknowledgments
This work has been partially supported by the EU project “Easy TV: Easing the access of Europeans with disabilities to converging media and content” (grant agreement no. 761699) (EasyTV Consortium, 2018), within the H2020 program, and the European funds for the project “HBB4ALL” (HBB4ALL Consortium, 2017) FP7 CIP-ICT-PSP.2013.5.1 (grant agreement no. 621014), within the CIP program. The authors would like to acknowledge the Spanish broadcaster RTVE for their collaboration in the development of video recordings for this research, the company Vicomtech for the development of the SL Avatar, the members of the CNSE (“Confederación Estatal De Personas Sordas”) State Foundation for the Deaf, for their support and collaboration in the testing process and the SL interpreters who kindly co-operated.
Juan Pedro López has been a Telecommunication Engineer since 2007, he received the International Doctor's Degree at Universidad Politécnica de Madrid in 2016 with his thesis focused on quality assessment for 2D and 3D stereoscopic video. His professional interests include video encoding, compression formats, high- and ultra-high-definition television, signal processing, and innovation that relates to technology with environments, such as accessibility, education, healthcare, and art. Since 2008, he has complemented teaching with working in national and international research projects focussed on video encoding, quality of experience, broadcasting, accessibility, and HbbTV technologies. He received the Bachelor of History of Art from UNED University in 2017.
Marta Bosch-Baliarda is a sign language linguist and interpreter who has worked as a trainer for sign language interpreters, sign language teachers, and communication support workers. She has been involved in the Catalan deaf community since 1998 and specialized in Deaf studies at the University of Barcelona. She is currently a research assistant for TransMedia Catalonia, a research group working on audiovisual translation and media accessibility at Universitat Autònoma de Barcelona. She is studying for a PhD on sign language accessibility and SL interpretation on TV and works with deaf-blind people within the vocational training program for communication support workers.
Carlos Alberto Martín obtained the telecommunication engineering MS (ABET accredited) in 2004 by UPM and the Master of Advanced Studies in the PhD programme of signals, systems, and radio communications at the same University in 2007. In 2014, he graduated in social and cultural anthropology at UCM. Currently, he is expanding his PhD thesis on media accessibility for people with disabilities. During his career, he has been involved in more than 50 research and development projects, including European, national and private contracts, formerly in the Visual Telecommunication Application Group (GATV) of UPM and currently in Atos Research Innovation.
José Manuel Menéndez is a professor at the Signal, Systems and Radio communications department at E.T.S. Ingenieros de Telecomunicación of the Universidad Politécnica de Madrid. Director of the Visual Telecommunication Application Research Group – GATV since 2004, and director of the chair of the Spanish public broadcaster RTVE at UPM since 2015. He has extensive experience in participation and coordination of research projects (more than 150), both at Spanish and European level, in topics dealing with Communications, Digital TV, and Computer Vision. He has more than 200 international scientific publications and has attended more than 70 conferences as invited speaker.
Pilar Orero, PhD, teaches at the Universitat Autònoma de Barcelona (Spain). Member of the TransMedia Catalonia research group. Recent publications include two co-edited books on audio description (with Maszerowska and Matamala, 2014, Benjamins; with Matamala, 2016, Palgrave Macmillan). Pilar Orero participates in ITU IRG-AVA and is a member of ISO/IEC JTC1/SC35 and Spanish UNE working group on accessibility. Leader of EU projects HBB4ALL, ACT, UMAQ, and partner in EasyTV and ImAC (2017–2021). She is an active external evaluator for many worldwide, national agencies (South Africa, Australia, Lithuania, Belgium, US, UK, etc.). Co-founder of MAP (Media Accessibility Platform).
Olga Soler is an Associate Professor at Universitat Autònoma de Barcelona, where she teaches psycholinguistics and cognitive processing to undergraduates in Psychology and Speech Therapy. With a background in language processing, her research has focused on online measures of handwriting in preschool and school children, and she is connected to international networks working in literacy (COST IS1401). Within the Transmedia projects, she is currently setting up experiments on different accessibility services: quality of perception of Sign Language on TV and emotional involvement of users of Audiodescription and AudioSubtitling.
Federico Álvarez is a Telecom Engineer (2003) and PhD (2009), both by the Universidad Politécnica de Madrid. He is working as Assistant Professor lecturing in UPM and he develops his research within the GATV. He is currently the coordinator of EasyTV and FI-GLOBAL and technical coordinator of ICT4LIFE in H2020. In the last 10 years, he has also been leading the UPM participation in several EU-funded projects, such as the SEA, SIMPLE, AWISSENET, RESCUER, FI-PPP project XIFI, etc. and coordinated the projects nextMEDIA, INFINITY, and FI-LINKS. He is the author and co-author of (70+) papers in journals, congresses, and books.