Nomenclature
- A
-
surface area
- CARE
-
crew module atmospheric re-entry experiment
-
 ${C_d}$
-
drag coefficient
- CFD
-
computational fluid mechanics
-
${C_h}$
-
heat transfer coefficient
-
${C_\tau }$
-
skin friction coefficient
- D
-
drag force
- DSMC
-
direct simulation Monte Carlo
-
${e_R}$
-
rotational energy
-
${e_V}$
-
vibrational energy
-
${F_N}$
-
number of real molecules
- Kn
-
Kundsen number
- L/D
-
length to depth
- NTC
-
no-time-counter
-
${q_w}$
-
wall heat flux
- SPARTA
-
Stochastic PArallel Rarefied-gas Time-accurate Analyzer
-
${U_\infty }$
-
freestream velocity
- VHS
-
variable hard sphere
-
${\delta _t}$
-
timestep
-
${\rho _\infty }$
-
freestream density
-
$\tau $
-
shear stress


1.0 Introdution
Aerothermodynamic analysis of the re-entry/planetary vehicle helps in understanding vehicle performance, as well as consequently can improve the efficacy of the planetary vehicle at hypersonic speeds by accurately predicting the heat loads and the aerodynamic forces. The re-entry vehicle passes through various fluid regimes, ranging from continuum to free molecular. The fluid flow regimes are classified based on the Knudsen number as follows: (1) Kn < 0.001 is a continuum flow regime; (2) 0.001 < Kn < 0.1 is slip flow regime; (3) 0.1 < Kn < 10 is a transient regime; and (4) Kn
 $ \gt $
10 is a free molecular flow regime [Reference Mizzi1]. To perfectly analyse the planetary vehicles, the traditional computational fluid mechanics (CFD), which solves the Navier-Stokes equation, is highly efficient only at continuum regimes and fails to find accurate solutions at rarefied regimes [Reference Casseau2]. The Navier-Stokes equation-based CFD solver overpredicts the values of the aerothermodynamic properties for the slip, transition, and free molecular regimes [Reference Xiao and He3–Reference Wang and Boyd5]. On the other hand, the direct simulation Monte Carlo (DSMC [Reference Bird6]) method gives accurate solutions at rarefied regimes [Reference Bird7–Reference Moss and Bird9]. The planetary vehicles need an optimum design to eliminate the aerothermodynamic failures at high Mach numbers. At high Mach numbers, the effect of rarefaction influences the flow field far upstream and therefore the effect depends on the Knudsen number and the altitude [Reference Tseng, Wu and Boyd10, Reference Mungiguerra, Zuppardi and Savino11]. At high-altitude regimes, the capsule experiences peak pressure over the frontal (stagnation) part and have the peak temperature at low-dense regions with lower energy interactions over the frontal surfaces [Reference Lal and Reji12]. The low-dense regions are formed behind the bow shock [Reference Boyd13] and the shock stand-off distance depends on the frontal geometry of the re-entry vehicle [Reference Kutkan and Eyi14]. The re-entry vehicle tends to experience high heating rate at stagnation point, which is a strong compression zone [Reference Sampaio and Santos15] compared to other surfaces. The aerodynamic force coefficients of the planetary vehicle increase with an increase in free-stream velocity especially, the drag coefficient increases with an increase in the Mach number and the aerodynamic force coefficients decrease as altitude decreases [Reference Moss, Glass and Greene16]. With an increase in effect of the rarefaction, the aerothermal properties tend to increase on the frontal part of the re-entry vehicle, i.e. the heat flux increases at the stagnation point [Reference Chinnappan, Malaikannan and Kumar17–Reference Huang19] and is more sensitive to peak amplitude of the hypersonic flow in the velocity probability density function. Reducing the peak amplitude of the hypersonic flow in the velocity probability density function by changing the shape of frontal part of the re-entry vehicle leads to lower the heat flux [Reference Han20]. Thereby having a cavity [Reference Huang21] on the frontal part greatly influence the aerothermodynamic performance of the planetary vehicles at high (hypersonic) speed. The aerodynamic properties tend to increase with an increase in the Knudsen number, and there will be a uniform distribution of the aerodynamic surface properties inside the cavity [Reference Jin22]. The cavities greatly alter the flow properties over the re-entry vehicle [Reference Bharghava23] and it differs for different Knudsen numbers [Reference Nabapure24–Reference Ahangar, Ayani and Esfahani26]. The cavities are characterised based on length to depth ratios, and it is very much important that the depth of the cavity should be smaller than the nose radius of the planetary vehicle where the region of re-circulation inside the cavity is the function of length to depth ratios [Reference Palharini and Santos27, Reference Guo28]. The L/D (length/depth) ratio plays a crucial role in reducing the heat flux on the lip of the cavity [Reference Sudarshan, Jagadeesh and Saravanan29] and on the surface area as well. Palharini et al. [Reference Palharini, Scanlon and Reese30] studied the hypersonic flow over the cavities with different length-to-depth ratios and found that heat flux and pressure over the cavity is maximum in the forward face of the cavity. An experimental study over a blunt body with cylindrical and parabolic cavity shows that the overall heat flux reduction by parabolic cavity is more than the cylindrical cavity [Reference Sudarshan, Jagadeesh and Saravanan29], which is because of the lowest velocity region found at centre of the cavity called recirculation zone [Reference Sun31]. The hypersonic flow inside the cavity causes multiple recirculation regions [Reference Guo and Luo32–Reference Guo, Gong and Zhang34] and its length depends on the amount of rarefaction. Some recirculation regions inside the cavity cannot be completely eliminated, but by increasing the inclination angle of the forward and rear face of the cavity can eliminate some of the recirculations and leads to decrease in the heat transfer coefficient [Reference Guo and Luo35, Reference Jin36]. The heat and pressure loads experienced on the cavity shoulder will tend to increase with increase in freestream Mach number [Reference Leite and Santos37, Reference Guo and Luo38]. Rounding the corners of the cavity is one technique, which makes the gas to flow easily into the cavity and reduces the pressure and heat flux at the corners and leads to overall peak pressure and heat flux reduction [Reference Jin39]. Increasing the angle-of-attack to particular extent promotes momentum and energy exchange between molecules and surface of the cavity, which leads to high heat flux and pressure on the cavity base [Reference Ivanov40]. Therefore, to understand the complex phenomena and influence on the aerothermodynamics of the re-entry vehicle, we have performed the DSMC simulation over the re-entry vehicle with trapezoidal and semicircular cavities with different L/D ratios with sharp and round corners. The present simulation utilises the Stochastic PArallel Rarefied-gas Time-accurate Analyzer (SPARTA) DSMC solver. SPARTA shows a very good agreement [Reference Klothakis41, Reference Plimpton and Gallis42] in obtaining the aerothermal properties of the re-entry vehicle in hypersonic rarefied flows.
The remaining parts of the paper are organised as follows. The simulation methodology employed in this research is detailed in Section 2. Grid sensitivity analysis and time-step sensitivity analysis are addressed in Sections 3 and 4, respectively. Validation is discussed in Section 5. The results and discussion about the re-entry vehicle with a trapezoidal cavity are presented in Section 6.1, while those pertaining to the semicircular cavity are found in Section 6.2. Conclusions are presented in Section 7.
2.0 Methodology
The DSMC [Reference Bird6, Reference Bird43, Reference Bird44] method consists simulated particles, each of which represents a fixed number (typically, 1
 $ \times $
 ${10^6}$
) of real molecules, and the simulation begins with setting up cell network and intial particle state. The particles get distributed into the grid cells with their initial position and velocity. The individual particles move and interact with boundaries and the particles get indexed into the cells. Then the selection of collision pairs and intermolecular collisions occurs. Finally, the flow properties are sampled and results are obtained. The time step selection for simulation is very much important and it should be less than the mean collison time. The size of the single cell should be less than the mean-free-path (
 $\lambda $
)/3 [Reference Prasanth and Kakkassery45]. SPARTA is an open source simulator with probabilistic simulation of real molecules represented by simulation particles where they are simulated in a physical space coupled with physical time. SPARTA DSMC code models rarefied gases using collisions, chemical reactions and the boundary conditions. It uses a hierarchical cartesian grid to track and group particles for 2d or 3d and axisymmetric models. SPARTA runs effectively on parallel computers, and it can model systems with a few particles to millions and billions. It exclusively captures the flow characteristics of high-velocity and low-density flows. The DSMC method provides results as similar to the Boltzmann equation and thus it predicts accurate results at rarefied regimes. SPARTA initialise with the predefined boundary conditions, velocity, number density and time step etc., which is based on the free stream condition of particular altitude. SPARTA follows regular DSMC procedure of move, collision, indexing and sampling of the microscopic properties to macroscopic properties. VHS [Reference Nanbu46] model is used for the particle–particle collision modeling whereas the Maxwell model is used for the modeling of gas-surface interaction with diffuse reflection. The parameters of VHS model can be referred from Ref. [Reference Nanbu46–Reference Plimpton48]. Similarly, the Larsen-Borgnakke model [Reference Borgnakke and Larsen49, Reference Nanbu, Honda and Igarashi50] is used for the rotational-translational and vibrational energy transfer. The number of collisions per time step in a cell is computed using Bird’s [Reference Bird51] no-time-counter (NTC) scheme. We used air, which comprises 78.90% of N
 ${}_2$
and 21.91% of O
 ${}_2$
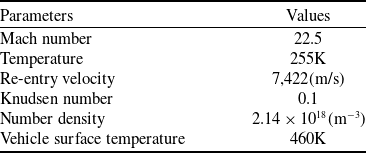
as simulation gas. The properties of the simulation gas are given in the Table 1. The wall temperature of the re-entry capsule is 460K. The wall effects are modeled using the Maxwell model by considering diffuse reflection condition. Specifically, when a particle collides with the wall, it reflects off with a velocity distribution that corresponds to the temperature of the wall. The direction of the reflected velocity is randomised according to a Maxwellian distribution. The simulation domain considered for the present simulation is 10 m
 $ \times $
10 m. The number of cells in the x and y directions are 1,000
 $ \times $
1,000, and the total number of cells are 1,000,000. We simulated with a sufficiently large number of particles, approximately 40,000,000, and ensured that there are roughly 35–40 particles per cell. This is more than adequate for any DSMC simulations. The time step considered for the simulation is
 $ 1 \times 10^{-5}$
s. The free stream parameters are tabulated and shown in Table 2.
Gas properties

Freestream parameters

3.0 Grid sensitivity analysis
Grid independent study is performed to ensure that the results are not influenced by the grid size. Three different grid sizes, such as
 $ 1,000 \times 1,000$
,
 $ 1,500 \times 1,500$
,
 $ 2,000 \times 2,000$
, are simulated for the freestream conditions and the same is given in the Table 2. Fig. 1 shows grid sensitivity analysis of heat transfer coefficent for the C1 type cavity. The results of all the grid sizes matches with each other. As a result, a grid size of 1,000
 $ \times $
1,000 is selected for all the simulations.
Grid independence study for heat transfer coefficient.

4.0 Time-step sensitivity analysis
We performed DSMC simulations over the re-entry vehicle with C1 type cavity for three different time-steps to find the effect of time-step on solutions. The three different time-steps are 1
 $ \times $
10
 ${{}^{ - 5}}$
, 1
 $ \times $
10
 ${{}^{ - 6}}$
and 1
 $ \times $
10
 ${{}^{ - 7}}$
. All the three time steps considered are less than the mean collision time. The comparison of heatflux at different time steps over the re-entry vehicle and the cavity surface is shown in Fig. 2. There is no change in the heat transfer coefficient obtained for simulation with time steps 1
 $ \times $
10
 ${{}^{ - 5}}$
and 1
 $ \times $
10
 ${{}^{ - 6}}$
. Therefore, all the simulations are carried out with time step of 1
 $ \times $
10
 ${{}^{ - 5}}$
.
Time-step sensitivity analysis for heat transfer coefficient.

Validation plot for temperature along the stagnation streamline and the heat transfer coefficient along the surface of the cavity.

5.0 Validation
In order to validate the current study, we performed a validation simulation of a problem involving hypersonic flow over the cavity. The freestream conditions and cavity dimensions utilised for validation are obtained from the Ref. [Reference Jiang25]. The trapezoidal cavity, C3 was validated against the Ref. [Reference Jiang25], as its shape is similar to that of the reference cavity. Thus, we validate by comparing our C3 type cavity, which is scaled down by a ratio of 1:100, with the cavity with a sidewall angle of 15 degrees from Ref. [Reference Jiang25]. The C3 cavity is reduced in size due to the fact that its original dimensions are larger than those of the reference cavity [Reference Jiang25]. The freestream temperature and velocity are 220 K and 7,456 m/s respectively, whereas the freestream number density is 1.8209
 $ \times $
 ${10^{21}}$
 ${{\rm{m}}^{ - 3}}$
. The present simulation results are well match with Plume Work Station (PWS) software [Reference Jiang25], DSMC solver for both flow properties and surface properties. Figure 3 shows the temperature distribution at a distance of 1 mm above the surface of the cavity and the heat transfer coefficient along the surface of the cavity. From Fig. 3, it is very well evident that the present simulation is very good agreement with Ref. [Reference Jiang25]. Figure 4 shows the comparison of temperature along the stagnation streamline for flow over a 12-inch diameter sphere. The present study is validated against the DSMC simulation for the freestream Mach number of 10 and Knudsen number of 0.01 from the Ref. [Reference Holman and Boyd52]. The plot shows both the simulations are similar to each other.
Validation plot for temperature along the stagnation streamline for flow over a sphere.

6.0 Results and discussion
In the present work, we have studied two different types of cavities on the re-entry vehicle with different length to depth ratios. The effect of a cavity with sharp and round corners also elaborately studied. The cavities are named with C1 to C14 as shown in Fig. 5, in which C1 to C6 are the trapezoidal cavities with the same depth (D = 500 mm) and different length. The cavities C1 and C2 correspond to L/D ratio of 0.5 (L/D = 0.5). Similarly, cavities C3 and C4 have L/D ratio of 1 (L/D = 1) whereas cavities C5 and C6 correspond to L/D =1.5. In contrast cavities C7 to C10 are trapezoidal cavities with the same length (L = 500 mm) and different depth. The cavities C7 and C8 with L/D = 1.5. Similarly, the cavities C9 and C10 correspond to L/D = 0.5. The semicircular cavities are named by C11 to C14 with different radius and having L/D = 2. The cavities C1, C3, C5, C7, C9, C11, and C13 are the cavities with sharp corners whereas cavities C2, C4, C6, C8, C10, C12, and C14 are the cavities with rounded corners. The cavities C2 and C12 have the rounded corner radius of 100 mm, and all other cavities have rounded corner radius of 200 mm. The flow properties such as velocity, temperature pressure and the surface properties such as heat flux, skin friction coefficient and the drag coefficient were obtained and examined in detail in the subsequent subsections. The aerothermodynamic characteristics such as heat flux, heat transfer coefficient, drag coefficient and skin friction coefficient are obtained using the following formulas.
 \begin{equation}{q_w} = {q_l} - {q_r} = {{{F_N}} \over {A{\rm{\Delta }}t}}\left\{ {\mathop \sum \limits_{j = 1}^N {{\left[ {{1 \over 2}{m_j}c_j^2 + {e_R} + {e_V}} \right]}_j} - \mathop \sum \limits_{j = 1}^N {{\left[ {{1 \over 2}{m_j}c_j^2 + {e_R} + {e_V}} \right]}_r}} \right\}\end{equation}
 \begin{equation}{C_h} = \frac{{{q_w}}}{{\frac{1}{2}{\rho _\infty }U_\infty ^3}}\end{equation}
 \begin{equation} d = \frac{D}{{\frac{1}{2}{\rho _\infty }U_\infty ^2A}}\end{equation}
 \begin{equation}{C_\tau } = \frac{\tau }{{\frac{1}{2}{\rho _\infty }U_\infty ^2}}\end{equation}
The heat flux is calculated using Equation (1), the wall heat flux
 ${q_w}$
is found by calculating the net energy flux of impinging molecules on the surface, with the flux being positive toward the surface. The net flux is the sum of the translational, rotational and vibrational energies of both incident and reflected molecules. Where,
 ${F_N}$
is the number of real molecules represented by the simulated molecules, A is the surface area,
 ${\rm{\Delta }}t$
is the time step,
 $\frac{1}{2}{m_j}c_j^2$
is the translational energy,
 ${e_R}$
is the rotational energy and
 ${e_V}$
is the vibrational energy of the molecule. The heat transfer coefficient
 ${C_h}$
, the drag coefficient
 ${C_d}$
and the skin friction coefficient
 ${C_\tau }$
is calculated using Equations (2), (3) and (4). Where D is the drag force,
 $\tau $
is the shear stress acting on the surface,
 ${\rho _\infty }$
and
 ${U_\infty }$
are freestream density and the freestream velocity. The drag coefficient, heat transfer coefficient and the skin friction coefficient are obtained for both the re-entry capsule and the cavity surface. A lot of points on the surface of the capsule and cavity are created and at the respective points, the aforementioned coefficients are computed and presented.
2D CAD model of re-entry capsules with and without cavity (all dimensions are in mm).

6.1 Re-entry vehicle with trapezoidal cavity
The flow properties and surface properties over the re-entry capsule with sharp and rounded trapezodial cavities are discussed in detail on the subsection 6.1.1 and 6.1.2.
6.1.1 Flow properties of trapezoidal cavity capsules
The trapezoidal cavities (C1 to C10) are shown in Fig. 5. The C1-type cavity from Fig. 6 shows the smaller recirculation regions are formed at the lip of the cavity, whereas from Fig. 7, the C2-type cavity, the recirculation regions are not visible due to the corner roundings. Figure 8 shows the velocity contour for the C3-type cavity, in which two recirculation regions are found at the base of the cavity surface. The velocity contour of the C4-type cavity shown in Fig. 9 from which the recirculation regions are not at the base of the cavity surface, instead the two re-circulation regions are at the lip of the cavity itself. Similar to the C3 and C4 type, the C5 and C6 cavities also follow the same trend, but the recirculation is wider compared to C3 and C4 cavities as shown in Figs 10 and 11. From Fig. 12 the velocity contour for C7-type cavity shows that there are no recirculation regions at base of the cavity but recirculation regions are formed at the lip of the cavities. Figure 13 shows the C8-type cavity, in which recirculation regions are at the base of the cavity; this is mainly due to the effect of a smaller depth of the cavity and the corner roundings. Figures 14 and 15 show the velocity contour of C9- and C10-type cavity, both C9 and C10 cavities follow the same trend as the C7- and C8-type cavity. The corners of the cavity play a larger role in the recirculation regions inside the cavity. The recirculation region is located at the base of the cavity for those with sharp corners, while it is located at the lip of the cavity for those with rounded corners.
Velocity contour for C1-type cavity.

Velocity contour for C2-type cavity.

Velocity contour for C3-type cavity.

Velocity contour for C4-type cavity.

Velocity contour for C5-type cavity.

Velocity contour for C6-type cavity.

Velocity contour for C7-type cavity.

Velocity contour for C8-type cavity.

Velocity contour for C9-type cavity.

Velocity contour for C10-type cavity.

The velocity contours of re-entry capsules with trapezoidal cavities are shown in Figs 6 to 15. For all trapezoidal cavities, the shock standoff distance is 2.9 m ahead of the frontal face of the re-entry vehicle. Figure 17(a) to (j) shows the temperature contours, and the maximum temperature is found to be around 28,000K, which is behind the shock wave. The velocity and temperature along the stagnation line is shown in Figs 16(a) to (b) and 18(a) to (b). The peak temperature observed behind a standing shockwave of C7-type cavity. The pressure contours are shown in Fig. 20(a) to (j) and the peak pressure observed inside the cavities compared to all other surfaces. Figure 19 shows the pressure along stagnation line of the re-entry capsule. From Fig. 19(a) C1 type is obtained with maximum pressure value and comparatively C7 is obtained with minimum pressure value because there is no considerable amount of recirculation regions found in the case of C7-type cavity. Similarly, from Fig. 19(b) the pressure plot for the cavity with rounded corner shows C2 type is with maximum pressure value and C6 is with minimum pressure value at the stagnation point. The pressure for C6 type is lower due to the absence of recirculation region at the base of the cavity, instead the re-circulation regions were at the lip of the cavity.
Comparison of velocity along the stagnation streamline of re-entry capsule with trapezoidal cavities.

Temperature contour of re-entry capsule with trapezoidal cavities.

Comparison of temperature along the stagnation streamline of re-entry capsule with trapezoidal cavities.

Comparison of pressure along the stagnation streamline of re-entry capsule with trapezoidal cavities.

Pressure contour of re-entry capsule with trapezoidal cavities.

Figure 21 shows the comparison of number density along the stagnation streamline over the re-entry capsule with sharp and rounded corner trapezoidal cavity. From Fig. 21(a) the number density for the C9 cavity is increases as the depth of the cavity exceeds that of others. The decreased number density seen in the C3 and C5 cavities can be attributed to the presence of a strong recirculation region located at the base of these cavities. From Fig. 21(b) the number density for the C8-type cavity exhibited a peak. The value of number density is lower for the C4 cavity. The number density for the C3 and C4 is observed lower than other cavity capsules since the length and depth of the cavity are same, i.e. L/D = 1. For sharp-corner cavities when the L/D ratio is low, the number density is high. For rounded corner when the depth of the cavity is low, the number density is found to be high. The base capsule (without cavity) has a very low number density value compared to all other cavities.
Comparison of number density along the stagnation streamline over the re-entry capsule with trapezoidal cavity.

6.1.2 Surface properties of trapezoidal cavity capsules
The comparison plot of drag coefficient of trapezoidal cavity with sharp and rounded corners is shown in Figs 22 and 23. From the Fig. 22(a), the drag coefficient is very low for C5-type cavity of L/D = 1.5, which has drag coefficient value of 0.036. It is also observed that the C7-type cavity has the same L/D ratio as C5, and the drag coefficient value is 0.042 which is slightly higher than C5. The reduction in the drag coefficient is mainly due to the formation of strong recirculation region at the base of cavity. By comparing the C1 and C9 cavity, which has the same L/D ratios, the C9 has a low drag coefficient which, primarily due to increasing the depth of the cavity, will decrease the drag coefficient. It is also observed that when the L/D ratio increases the drag coefficient decreases. From the drag coefficient plot it is also evident that the cavities with corner roundings have lower drag coefficient compared to the sharp corners. The comparison plot of the drag coefficient along the cavity surface is shown in Fig. 22(b), which shows the C5-type cavity has a low drag coefficient of 0.019 at the stagnation point. The comparison of drag coefficient over surface of the re-entry capsule with rounded trapezoidal cavities in Fig. 23(a) shows that the C6-type cavity capsule has a drag coefficient value of 0.03 at the start of the cavity, which is slightly less than the sharp trapezoidal cavity. From Fig. 23(b) at the stagnation point the drag coefficient of C6 type is very low compared to other cavities. In contrast to the sharp cavity capsule, the capsule with rounded corners has the same drag coefficient at the stagnation point. The comparison plot of heat transfer coefficient over the re-entry capsule with sharp trapezoidal cavity is shown in Fig. 24. There is no significant change in the heat transfer coefficient along the surface of the re-entry capsule as shown in Fig. 24a. Whereas, there are significant changes in the heat transfer coefficient along the cavity surface and the same is given in Fig. 24b. The heat transfer coefficient at the stagnation point is very low for the C1- and C9-type cavity. Figure 25 shows the comparison plot for the heat transfer coefficient over the re-entry capsule with trapezoidal cavity with rounded corner. From Fig. 25 similar to the sharp cavity case, along the surface of the re-entry capsule there is no significant change in heat transfer coefficient but from Fig. 25(b), the comparison plot for heat transfer coefficient along the cavity surface shows that C2- and C8-type cavities have very low heat transfer coefficient at the stagnation point. In the case of cavity with rounded corners C2 (L/D = 0.5) and C8 (L/D = 1.5), the strength of recirculation is very low and this will be the reason for the low heat transfer coefficient. It is observed that for the capsule with sharp cavity, decreasing the L/D leads to decrease in the heat transfer coefficient. Whereas, in the case of capsules with rounded corners, a lower heat transfer coefficient is observed due to the rounded corners, and in particular for the C8 type, the depth is less than the length, and the flow is easily diverted from the cavity’s base due to the rounding corners. Figure 26(a) shows the comparison plot for skin friction coefficient over the capsule with trapezoidal cavity with sharp corners. From the plot (26a) it is evident that the capsule with sharp cavities, the skin friction coefficient value is high in the side walls of cavities for higher L/D ratio. Whereas from Fig. 27(b) for the cavity with rounded corners, the values of skin friction coefficient are high for lower L/D ratios.
Comparison of drag coefficient over the re-entry capsule with trapezoidal cavity with sharp corner.

Comparison of drag coefficient over the re-entry capsule with trapezoidal cavity with rounded corner.

Comparison of heat tranfser coefficient over the re-entry capsule with trapezoidal cavity with sharp corner.

Comparison of heat transfer coefficient over the re-entry capsule with trapezoidal cavity with rounded corner.

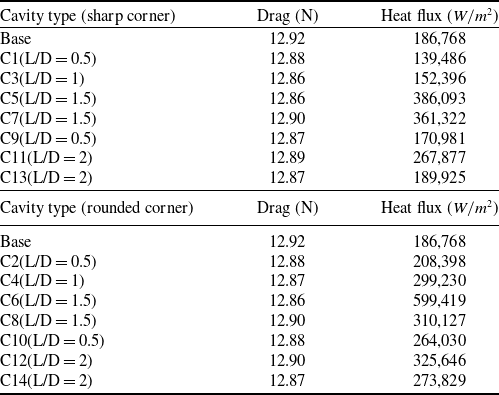
Table 3 shows overall drag force and the heat flux acting on the re-entry capsule for all the cases. The drag force for all the capsules with cavities are found to be in the range from 12.86N to 12.92N, whereas, the heat flux value shows the vast difference for each case. Comparing the capsule with sharp cavities, C1 and C9 have the L/D ratio of 0.5, and the heat flux values of 139,486 and 170,981 W/
 ${m^2}$
respectively. Similarly, for the capsule with rounded corners C2 and C10, the heat flux values are obtained as 208,395 and 264,030 W/
 ${{\rm{m}}^2}$
. The re-entry capsule without the cavity is obtained with a heat flux value of 186,768 W/
 ${{\rm{m}}^2}$
which emphasis that the sharp cavity capsule of L/D ratio 0.5 produce heat flux lower than the re-entry capsule without the cavity. The heat flux value for C3 capsule with L/D = 1 is 152,396 W/
 ${{\rm{m}}^2}$
which is also lesser than the heat flux value of the re-entry capsule without cavity. Heat flux value is high for remaining cavities compared to the re-entry capsule without cavity. From the comparison it is observed that for larger L/D ratios like L/D = 1.5 increasing the length of the cavity increase the heat flux. It can also be observed that the heat flux in a cavity with rounded corners is greater than that in one with sharp ones. Smooth cavities allow for more efficient heat transfer because of the increased energy exchange between the fluid and the cavity surface.
Comparison of skin friction coefficient over the re-entry capsule with trapezoidal cavity with sharp corner.

Comparison of skin friction coefficient over the re-entry capsule with trapezoidal cavity with rounded corner.

Comparison of drag and overall heat flux for all types of cavities

6.2 Re-entry vehicle with semicircular cavity
The flow properties and the surface properties of the re-entry capsule with sharp and rounded semicircular cavities are discussed in the following subsections 6.2.1 and 6.2.2.
6.2.1 Flow properties of semiciruclar cavity capsule
The semicircular cavities (C11 to C14) are shown in Fig. 5. Similar to trapezoidal-shaped cavities, semicircular cavities exhibit recirculation regions at the lip of the cavity for cavities with sharp corners, and recirculation formed at the base of the cavity surface for cavities with rounded corners. The velocity contours of re-entry capsules with semicircular cavities are shown in Figs 28, 29, 30 and 31.
The length of the recirculation zone is observed as 0.15 m for the C12-type cavity and 0.3 m for the C14-type cavity. This implies that for the capsule with semicircular cavities, increasing the radius of the cavity leads to increases in the length of recirculation zone. Semicircular cavities showed the same shock standoff distance and peak temperature as trapezoidal cavities. The shock standoff distance is 2.9 m ahead of the frontal face of the re-entry vehicle. Figure 33(a) to (d) shows the temperature contours and the maximum temperature is found to be around 28,000K, which is behind the shock wave and is mainly due to the effect of the rarefaction. The variation of velocity and temperature along the stagnation streamline are shown in Figs 32(a) to (b) and 34(a) to (b). Figure 35(a) and (b) show the pressure along the stagnation streamline. Pressure contours for the semicircular cavities are shown in Fig. 36(a) to (d). The pressure value for capsule with rounded corners are high when compared with the capsule with sharp cavities. This shows that rounding the corners will increase the pressure at the stagnation point of the re-entry capsule.
Velocity contour for C11-type cavity.

Velocity contour for C12-type cavity.

Velocity contour for C13-type cavity.

Velocity contour for C14 type cavity.

Comparison of velocity along the stagnation streamline of re-entry capsule with semicircular cavities.

Temperature contour for the re-entry capsule with semicircular cavities.

Comparison of temperature along the stagnation streamline of re-entry capsule with semicircular cavities.

Comparison of pressure along the stagnation streamline of re-entry capsule with semicircular cavities.

Pressure contour for the re-entry capsule with semicircular cavities.

Figure 37 shows the comparison of number density along the stagnation streamline over the re-entry capsule with semicircular cavities. From the plot shown in Fig. 37(a), the number density of the C11-type cavity capsule is rather low, with the highest value observed in the C13 cavity capsule. This observation demonstrates that in the case of sharp corner cavities, a smaller radius of the semicircular cavity corresponds to a lower value of number density, whereas a larger radius results in a higher number density. Figure 37(b) indicates that the number density of C12 is higher compared to that of C14, which is lower. Hence, it can be observed that as the radius of the semicircular cavity decreases, the number density increases.
Comparison of number density along the stagnation streamline over the re-entry capsule with semicircular cavity.

6.2.2 Surface properties of semicircular cavity capsules
The comparison of drag coefficient for the semicircular cavity with sharp corner is shown in Fig. 38. In comparison to the other types of cavities, the C13 type has a higher drag coefficient along the surface of the re-entry capsule, as shown in Figure 38(a). Figure 38(b) shows, at the stagnation point, the C11-type cavity has a low drag coefficient because of the low strength recirculation region inside the semi-circular cavity compared to the C13 type. Figure 39 shows the drag coefficient for capsule with rounded corner cavities. It is evident from the Fig. 39(b) that the drag coefficient value at the stagnation point for C12 is very low compared to the C14 type. For overall semicircular cases when the radius of the semicircular cavity increases irrespective of whether sharp or rounded corners, the drag coefficient tends to increase. It is also observed that unlike the trapezoidal cavities, the drag coefficient for both sharp and rounded corners of semi-circular cavities are same at the stagnation point. The comparison plot for the heat transfer coefficient of sharp and rounded corner cavities are shown in Figs 40 and 41. The heat transfer coefficient tends to decrease slightly with increase in the radius of the semi-circular cavity at stagnation point. Figures 42 and 43 refers to the comparison plot of skin friction coefficient over sharp and rounded corner cavities, which implies that the skin friction coefficient at the side walls tends to decrease with increase in the radius of the semicircular cavities.
Comparison of drag coefficient over the re-entry capsule with semicircular cavity with sharp corner.

Comparison of drag coefficient over the re-entry capsule with semicircular cavity with rounded corner.

Comparison of heat transfer coefficient over the re-entry capsule over the re-entry capsule with semicircular cavity with sharp corner.

Comparison of heat transfer coefficient over the re-entry capsule with semicircular cavity with rounded corner.

Comparison of skin friction coefficient over the re-entry capsule with semicircular cavity with sharp corner.

7.0 Conclusion
The hypersonic flow over a re-entry capsule with trapezoidal and semicircular cavities of varying length to depth ratio is examined for the transient Knudsen number. The simulations are conducted on cavities with sharp and rounded corners and various L/D ratios. For trapezoidal cavities, the recirculations are observed to develop at the base of the cavity surface with sharp corners. But for capsules with rounded corners, recirculations are observed to form at the lip of the cavity. Conversly for semicircular cavities, the formation of recirculations occurs at the base of the cavity surface when rounded corners are present, but for sharp corners, recirculation regions form at the lip of the cavity. All trapezoidal cavities have two recirculation zones that are not symmetric. While, the recirculations exhibit equal and symmetric characteristics along the axial flow direction for semicircular cavities. Sharp corner trapezoidal cavity capsules exhibit a high number density when the ratio of L/D is low. In the case of sharp semicircular cavity capsules, a smaller radius of the cavity corresponds to a lower number density. Conversely, for rounded semicircular cavity capsules, a smaller radius results in a higher number density. The drag coefficient decreases as the cavity’s depth increases. The drag reduction of trapezoidal and semicircular cavities decreases as their lengths and depths increase in comparison to a capsule without a cavity. Comparing a capsule with and without a cavity, the heat flux is lowest in the cavity with the smallest L/D ratio for a trapezoidal type cavity of fixed length and depth, and greatest when the cavity length is increased for a large L/D ratio. For semicircular cavities, increasing the radius of the cavity results in an increase in the length of the recirculation. A reduction in the overall heat flux of 25% was seen when comparing the vehicle with a cavity to the vehicle without a cavity. At the stagnation point, the heat transfer coefficient tends to decrease slightly as the radius of the semicircular cavities increases. The cummulative drag coefficient and heat transfer coefficient over the re-entry vehicle is tabulated here.

Comparison of skin friction coefficient over the re-entry capsule with semicircular cavity with rounded corner.

The above results could help significantly on the design of future spacecrafts, to optimise the existing hypersonic vehicles with improved aerodynamic perfomance and designing of thermal protection systems. The present solutions are resticted to the 2D planar case.
Acknowledgments
Authors thank High Performance Computing Center, SRM IST for providing the computational facility and usage of SPARTA DSMC code.