


Introduction
It is easy to measure snow depth (hs), bit other properties less easily measured, like the snow water equivalent (SWE) or the bulk density  , must be known in order to solve many practical problems. These include forecasting snow-melt run-off, predicting over-snow trafficability or inferring the snow thermal conductivity. Unfortunately, only snow depth is measured at enough locations and at frequent enough intervals to provide regional or global coverage. In the United States, for example, SWE and
 are routinely measured at fewer than 1000 sites, while snow depth is measured at more than 15 000 sites nationwide. In order to incorporate snow into regional or global models, some method of estimating the bulk density or SWE from this great wealth of depth data is needed.
One method that has been proposed has been to associate characteristic values of  or more frequently the evolution of
 with time (time-density curves), with specific geographic regions. Reference BilelloBilello (1957, Reference Bilello1969) identified four distinct time-density curves for North American snowpacks, relating these to wind speed and air temperature. Reference McKay and Findlay.McKay and Findlay (1971) recognized characteristic time density curves for 11 separate regions in Canada, each identified by-its vegetation, a proxy indicator of climate. Reference DmitrievaDmitrieva (1954) and Reference Onuchin and Burenina.Onuchin and Burenina (1996) showed an even more direct link between bulk density and climate; in the work of the former,
 was related to the number of winter thaws and high wind-speed events, and in the work of latter,
 was related to the snow depth, the duration the snow was on the ground, and the winter air temperature.
In a recent paper (Reference Sturm, Holmgren and Liston.Sturm and others, 1995), we developed a global seasonal snow-cover classification system. It has six classes, each defined by a suite of physical properties such as the sequence of snow layers, their density, temperature, grain-size and characteristics. Using 0.5° latitude by 0.5° longitude climatologies of winter air temperature, wind speed and precipitation (Reference Legates and Willmott.Legates and Willmott, 1990), the classes have been mapped for the entire Northern Hemisphere and checked against field measurements from Alaska and elsewhere. With this wide coverage, if we could assign to each class in the system a characteristic time density curve, the maps could be used to estimate the bulk density at any Northern Hemisphere location.
In this paper, we begin that process by defining regional time-density curves for three classes of snow based on snow-course data. We assume that differences in these curves are primarily the result of differences in the bulk rheology of the snowpack, พ hich in turn results from differences in climate, through its impact on snow characteristics, load and temperature. Using a viscous-compaction model and the measured curves, we identify the bulk compactive viscosity for each class of snow. We also use the compaction model to investigate what parameters (load, snowfall history and compactive viscosity) are most important in determining the bulk density. Our results suggest that the compaction behavior is more sensitive to the snow characteristics than to snow load or snowfall history. This helps explain why compaction behavior tends to be similar from year-to-year at a specific location, despite large year-to-year variations in snow timing and depth.
Time-Density Curves for Tundra, Taiga and Maritime Snow
Five classes of seasonal snow can be found in Alaska (Reference Sturm, Holmgren and Liston.Sturm and others, 1995); three (tundra, taiga and maritime classes) are accessible along the road system. These differ in ways that directly affect their compaction. Tundra snow (Reference Benson and Sturm.Benson and Sturm, 1993) consists of alternating layers of depth hoar and wind slab, the result of strong winds, sparse vegetation to ameliorate the wind and low air temperatures that create strong temperature gradients. The depth hoar is friable and brittle but the wind slab can have great strength and bridge the depth hoar. Total depth rarely exceeds 0.7 m. Taiga snow (Reference Trabant and Benson.Trabant and Benson, 1972; Reference SturmSturm, 1991) consists primarily of unmetamorphosed recent snow overlying layers of extreme depth hoar. Grain-size exceeds 20 mm at the base of the snow and decreases with height. Depth ranges from 0.6 to 1.5 m. Bonding between grains and the strength of layers can vary markedly but is almost always poor (Reference Sturm and Benson.Sturm and Benson, 1997), making a fragile and brittle snow cover. Maritime snow, the product of a moist and relatively warm climate, ranges from 1 m to more than 4 m in depth. Melt and rain-on-snow events are common, so the layers are often wet or contain a high percentage of icy features. Where the snow does not exhibit wetted or melt features, equilibrium (rounded) grains prevail.
Between 1989 and 1992, we monitored the density of the snowpack at two places within each class. Measurements were made every 5–6 weeks using a 100 cm3 cutter and digital balance. Bulk density was computed by taking a weighted average of layer thicknesses multiplied by layer densities. For the same classes, density has also been obtained from snow courses operated by the United States Department of Agriculture (USDA) National Resource Conservation Service (NRCS). At each snow course, depth and SWE are measured monthly, usually starting in December. The measurements are made by taking several snow cores along a 50 m line and averaging the results. Based on the length and weight of the core, the depth and SWE are computed and published (USDA, 1983–1994a, b). Four or five sites within each snow class have been selected such that they span a wide geographic area. For the selected sites, bulk density  has been calculated for the 11 winters between 1983 and 1994. Unfortunately, NRCS data are not available for the tundra-snow class.
Within each class, time-density curves tend to have similar slopes and initial densities, both from place-to-place and year-to-year. This is illustrated in Figure 1 for taiga snow, where data from an area that spans 200 × 300 km, and 11 years in time, have been plotted. Between classes, however, consistent differences are apparent (Fig. 2). Curves for maritime snow are steep (indicative of rapid compaction) with low initial values. Curves for tundra snow hardly change at all over the winter, because pulverized drift snow tends to be dense right from the start. Taiga snow shows intermediate behavior. To highlight that these are general characteristics, time-density curves for the same three classes fro m sites in other parts of Alaska and Canada (Reference LongleyLongley, 1960; Reference BilelloBilello, 1969; Reference McKay and Findlay.McKay and Findlay, 1971) have been added to Figure 2.
Time-density curves for taiga snow, 1983–1994, including our data and data from the USDA (1983–1994a, b). The average curve (having the average slope and intercept of the 11 lines) is shown as a heavy solid line and the slope (m) and intercept at t = −65 d (b) are listed for each curve.

Time-density curves for maritime, tundra and taiga snow classes, including data from this study, from USDA snow courses, arid from Reference McKay and Findlay.McKay and Findlay (1971), Reference BilelloBilello (1969) and Reference LongleyLongley (1960). See Table 1 for average slope and intercept values.

Slopes and intercepts for time-density curves for three climate classes of snow

To quantify differences in time density curves, each data set has been fitted with a line  where t is time in days measured from 1 January, m is the slope of the curve, and b is the intercept at t = −65dFootnote *, and ρ is measured in kg m −3) (see Fig. 1). While the curves are not always linear, this procedure has the advantage of identifying the major differences in slope between the classes and it is simple. The results are listed in Table 1. We note that for taiga snow, slopes (m) range from 0.43 to 0.72. with a mean value of 0.57 (Table 1), while for maritime snow, slopes range from 0.82 to 2.04, with a substantially different mean value of 1.31. Tundra snow has the lowest slope with a mean value of 0.24.
Intercept values basically indicate the bulk snow density at the start of winter but appear to be distinctive only for tundra snow. Of the two tundra sites where we collected data (Fig. 2b), Imnavait Creek had lower winter wind speeds than Prudhoe Bay (approximately 2 vs 4ms −1 on average). The snow was correspondingly more dense at the windier site. Still higher initial densities (but similar slope) were found by Reference BilelloBilello (1969) in the Canadian Arctic Archipelago, where wind speeds are even higher than for Arctic Alaska. These data suggest an orderly progression for tundra snow in which wind speed must be considered when assigning the intercept value.
In Table 1, average slope and intercept values have been computed for each class using the individual slope and intercept values from each site. The class averages (bold type in Table 1) are assumed to be the coefficients for a general linear regression equation suitable for predicting the bulk density as a function of time for the entire class. We can assess the errors incurred in making estimates using these general regression equations by predicting the bulk density at each site and time in our dataset, then comparing the predictions with the actual measurements. The results (Fig. 3) indicate that at the 90% confidence level, predicted errors in density are ± 62 kg m−3 at the 80% confidence interval, the error shrinks to ± 45 kg m−3.
Distribution of errors in predicted bulk density for maritime snow (top) and taiga smut (bottom) showing the 80% and 90% confidence limits.

Calculating Time-Density Curves Using a Viscous Model
The statistical approach described in the preceding section can be used to estimate the regional bulk density but the approach provides little information about the processes that lead to densification nor does it allow for refinements in which weather or other data might be used to improve predictions. In this section, a compaction model is introduced and used with the time-density curves to identify compactive viscosity values for the three classes of snow. The model is also used to investigate what parameters are most important in determining the bulk density of the snow.
The density of a snowpack is a function of its initial density and the compaction history of each layer of snow. The rate of compaction of a layer is affected by its grain characteristics, density, temperature, liquid-water content and load. These vary with time and height in the snow, so each layer has a unique loading history and set of environmental conditions under which it compacts. Mechanical processes affecting compaction include gravitational settling, grain re-arrangement and creep. Water infiltration and refreezing increase the rate of densification. If temperature and vapor-pressure gradients are large compared to the rate of compaction, vapor transport may also measurably enhance or retard the apparent compaction rate as depth hoar develops (Reference Trabant and Benson.Trabant and Benson, 1972; Reference Sturm and Benson.Sturm and Benson, 1997).
All of these processes can be treated together by making the assumption that the snow behaves as a viscous fluid with an “effective” compactive viscosity, ηc (Reference KeelerKeeler, 1967; Reference Kojima and OuraKojima, 1967; Reference BergenBergen, 1978; Reference QinQin Dahe, 1990):

where h is the thickness of the layer, t is time, ρ is density and σ is the load. Values of ηc have been determined from observations of the settlement of natural snow layers, from uniaxial-strain compressive tests and from depth-density profiles on glaciers and ice sheets. The combined results show a wide scatter (Reference MellorMellor, 1975; Reference Ambach and Eisner.Ambach and Eisner, 1985) but individual sets of data are usually fitted with:
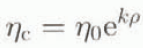
where η0 is the viscosity (Pa s) at ρ (kg m −3) equals zero and k (m3 kg−1) is a factor that depends on the type of snow, its temperature and whether it is wet. When ηc is plotted on a semi-log plot as a function of density, the result is a line with slope k. Values of k vary from less than 0.020 to more than 0.185 (Table 2), depending on the type of snow.
Viscosity k values from studies in which snow type was identified

Equations (1) and (2) can be combined in a finite-difference form to produce an equation that describes the density of a layer of snow at time i + 1, given its density at time i:

Equation (3) has been used, layer-by-layer, to “build-up” or model a snowpack consisting of 30 layers where each layer compacts based on its individual load. Averaging across all layers, the bulk density of the “built up” snowpack has been determined as a function of time and from this the slope and intercept of the time-density curve have been computed (Fig. 4). The model has been run for values of k ranging from 0.011 lo 0.080 m3 kg−1 (all layers in the snowpack assigned the same value of k), total loads ranging from 0.2 to 7.5 kPa, from two to ten snowfalls per winter, and winters ranging in length from 50 to 150 days. Initial density and η0 , while adjustable parameters in the model, were held constant at 75 kg m−3 and 8.5 × 10⁶ Pa s, respectively, for the model runs reported here.
Typical results from the viscous compaction model: (a) load as a function of time, (b) snow depth as a function of time, and (c) bulk density as a function of time, with the slope and intercept of the time-density curve shown.

Model results indicate that the slope of the time-density curve is affected more by the k value than by the load or the snowfall history. In Figure 5, slopes from time-density curves determined using the model are plotted for a wide range of snow loads and intercepts. The slope increases rapidly from 0.86 to 1.30 as the load is increased from 0.5 to approximately 3 kPa (ten snowfalls) but it changes little as the load is further increased to 7.5 kPa. This full-load range corresponds with snow about 10 to 250 cm in depth and spans the range of most seasonal snowpacks. In contrast, when k values are decreased from 0.080 to 0.010 (reading from right to left on Figure 6), the slope increases by more than a factor of ten (slope changes from 0.2 to 2.4), with neither load (ranging from 0.4 to 7.5 kPa) nor snowfall history (ranging from two to ten snowfalls a winter) having as big an effect.
Slopes and intercepts of time-density curves as a function of load.

Time-density slope as a function of k value. Average slopes from Table 1 have been marked on the y axis and for these k values have been determined; they agree reasonably well with published values of k from Table 2. Results for several different snowfall histories (2, 4, 6 and 10 snowfalls/winter) have been computed for each end-of-winter load.

Results for intercept values are more complicated. The intercept is sensitive to the initial density of each snowfall, the total load (Fig. 5), the length of the winter and the number of snowfalls. In general, increasing the total snow load or the initial snowfall density, or decreasing the k value, the length of the winter or the number of snowfalls, results in increased intercept values. Thus, a short winter during which there are a few deep, heavy snowfalls (with low k values) has a higher intercept value than a long winter with many thin, light snowfalls. Competing and possibly subtle effects, such as wind drifting (with its high initial density but many layers), or the fact that short winters tend lo be associated with lower snow loads, may not be represented in the model in an adequate enough fashion to make the prediction of intercepts reliable.
Average slopes for tundra, taiga and maritime snow (Table 1) have been marked on the y axis of Figure 6, and k values corresponding to these slopes have been determined. For each class of snow, there is a distinct k value, which means each class has a unique density-dependent compactive viscosity. The viscosity differences arise from dilferences in grains, bonds, temperature and wetness, and the concomitant compaction processes associated with the particular type of snow. Tundra snow has a k value of 0.072; taiga snow has a k value of 0.039, and maritime snow has a k value of 0.018. For maritime snow, the value determined using the model is close to values determined by Reference Kojima and OuraKojima (1967) (Fig. 6; Table 2). For the other types of snow, the values are consistent, at least in magnitude, with published k values. Unfortunately, in most studies where compactive viscosity has been measured, the snow has not been described in sufficient detail to identify its type or the class from which it came.
Discussion
Our study suggests that differences in the compaction behavior of the three classes of snow are due to climatically controlled differences in grain and bond size, temperature and wetness. As defined by Reference Sturm, Holmgren and Liston.Sturm and others (1995), each of these classes has a distinctive suite of grain, bond and stratigraphic characteristics that are insensitive to minor changes in winter weather and so develop reliably throughout a climate region from one winter to the next. These characteristics combine to create a bulk snow rheology that is manifested as a distinct effective compactive viscosity. This rheology develops reliably from one winter to the next and gives rise to characteristic time density curves (Figs 1 and 2) through the way the snow compacts.
Snow load plays a more limited role in determining the compaction behavior than grain and bond characteristics and temperature. There are two reasons for this: first, though the load can change from one winter to another, in general it is constrained between somewhat narrow limits within a climate region. Secondly, the load has only a linear effect on the bulk density (see Equation (3)), while the grain bond characteristics have an exponential effect through their impact on the k value. Thus, changes in the k value, reflecting changes in grains, bonds, temperature and wetness, have a more pronounced effects on the slope and intercept of the time-density curve than do changes in load. This finding helps explain why studies in which regional snow density has been predicted from air temperature and wind speed alone (Reference DmitrievaDmitrieva, 1954; Reference BilelloBilello, 1957; Reference Bilello1969) have proved successful. Neither load nor snow depth are the primary factors in determining the bulk density.
At the grain scale, our results agree with the findings of Reference BucherBucher (1956). He found that the viscosity of snow increased with (1) increasing grain-size, (2) increasing density and (3) decreasing temperature. Thus, low-temperature tundra snow, with its layers of coarse-grained depth hoar inter-layered with slabs of high initial density, compacts more slowly than relatively high-temperature, fine-grained maritime snow with its low initial density (Fig. 2).
Depth-hoar and wet-snow metamorphism also induce density changes and these are superimposed on the grain-scale effects, further enhancing viscosity contrasts between classes of snow. Depth-hoar metamorphism, which primarily affects tundra and taiga snow, tends to counteract the densification process and therefore increases the effective viscosity. Liquid-water percolation in maritime snow lubricates and facilitates grain re-arrangement and tends to refreeze in pore spaces, increasing the densification rate, thereby lowering the effective viscosity.
Conclusions and Recommendations
This study relates two previously unconnected areas of snow literature. It shows (Fig. 6) that observed differences in the time-density curves from one climatic region to another (Fig. 2) arise directly from differences in the rheological properties of the snowpack in each region. These differences can be expressed directly in terms of differences in k values, which are a measure of the viscosity. The differences in viscosity arise primarily from differences in grain and bond characteristics, and temperature. The viscosity is less sensitive to the snow load or load history than these other parameters, which helps explain why it has been possible to predict the bulk density successfully without considering the snow depth or load.
The bulk density of three climate classes of snow can be predicted from empirically derived regression coefficients given in Table 1 but it should also be possible to make these predictions using the k values listed in Figure 6, plus Equation (3). Using the former procedure is simpler but it can result in errors as large as ± 62 kg m −3 in bulk density, due to the year-to-year variability in the snow. Using the latter method opens the possibility of refining bulk-density predictions by using measurements of air temperature and other common meteorological inputs to adjust the viscosity when computing time-dependent compaction. More work is needed to understand how grain characteristics and temperature affect k values and viscosity (the published literature is somewhat contradictory) but the effort might well improve our prediction capability considerably.
Acknowledgements
We thank R. McClure, G. Clagett, and G. Schaefer of the NRCS for their help in obtaining the snow-course data. S. P. Jones helped to tabulate the NRCS data. D. Hawkins and J. Johnson made valuable suggestions that improved the paper. This work was supported by U.S. Army Contract 4A762784-At42-SS-E07 and U.S. National Science Foundation grant OPP-9415386.



