
I. INTRODUCTION
As a kind of soft magnetic material, the Fe–6.5 wt% Si alloy presents a contribution combining low iron loss with high magnetic induction, widely used as the choke coil, high-frequency transformer, as well as the high-frequency motor. Reference Ros-Yáñez, Ruiz, Barros and Houbaert1 Owing to the two ordered structures (B2 and DO3) with high brittleness, it is almost impossible that Fe–6.5 wt% Si sheets are manufactured using the conventional cold rolling process Reference Wu, Fan, Wang, Li, Gan and Zhang2 ; then attention has been accorded to the impact of B2 and DO3 ordered structures on mechanical characterization. Reference Liu, Li, Li, Gao, Liu, Luo, Zhang, Chen, Cao, Liu and Wang3,Reference Zheng, Ye, Liang, Ding, Lin and Chen4 According to the difference in the nucleation rate of B2 and DO3 ordered phases, Reference Viala, Degauque, Fagot, Baricco, Ferrara and Fiorillo5 the transformation of the B2 phase may be affected by means of the cooling process. As a result, it is reasonable to believe that controlling B2 (FeSi) → DO3 (Fe3Si) in the cooling process will be an effective way to reduce the order degree and exert an influence on mechanical characterization of the Fe–6.5 wt% Si alloy. Reference Fu, Yang, Zhang and Xie6
Presently, grain boundary engineering has become a widely applied concept based on the idea of controlling the frequency of coincidence site lattice (CSL) grain boundaries, Reference Bai, Zhao, Xia, Wang, Zhou and Su7 and the research work on mechanical propertiesis of the Fe–6.5 wt% Si alloy is focused on the effect of grain boundary character strongly influenced by the texture evolution. Reference Kobayashi, Kobayashi and Watanabe8 Watanabe et al. Reference Watanabe, Fujji, Oikawa and Arai9 investigated that the fraction of 50–75% of percolation-resistant low-ΣCSL boundaries was required to interrupt the network of degradation susceptible random boundaries, controlling intergranular brittleness and improvement in ductility of the high-performance Fe–6.5 wt% Si alloy. Zhang et al. Reference Zhang, Wang, Zou, Baker, Chen and Liang10 pointed out that controlling the grain boundary character distribution (GBCD) in the Fe–6.5 wt% Si alloy could be utilized as a novel and effective method, and the optimum GBCD was also beneficial for the control of impurity-element segregation-induced brittleness and suppressing the crack formation and propagation along the grain boundary. However, the impacting mechanism of different cooling modes on how to optimize GBCD in the Fe–6.5 wt% Si alloy has not been systematically investigated yet.
As is well known, the crystallographic texture in rolling plate can control grain misorientation and indirectly affect the grain boundary structure and energy depending on the axis of misorientation between grains and textures. Reference Yan, Bi, Li and Xu11 For this reason, sharp and homogeneous distribution of γ-fiber recrystallization texture will increase the high adjacent probability of {112} 〈110〉, {111} 〈110〉, and {111} 〈112〉 orientations, as well as provide more opportunities to form a large fraction of CSL boundaries and affect the crack formation and propagation. Reference Gao, Yu, Misra, Zhang, Zhang and Liu12
In previous work, we had reported on the warm-rolled Fe–6.5 wt% Si alloy Reference Li, Cai, Cai and Wang13 and conducted in-depth discussions on the warm rolling temperature and their impact in microhardness and brittleness, which offered a strong foundation to explore B2 phase transfer and the grain boundary character. This study is dedicated to controlling B2 phase transfer and grain boundary character to improve the mechanical properties of the Fe–6.5 wt% Si alloy by means of different cooling processes; meanwhile, the relationship between the texture evolution and CSL boundaries is discussed by a more detailed analysis.
II. EXPERIMENTAL PROCEDURES
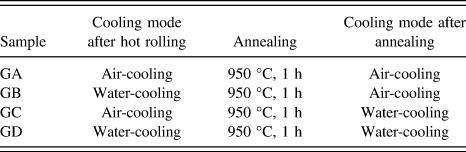
In the vacuum induction furnace, the produce materials of the Fe–6.5 wt% Si alloy consisted of metallic silicon (99 wt%) and pure iron (99.5 wt%) which were smelted and cast into a steel mold to get an ingot of ϕ110 mm2 × 220 mm in the laboratory. Its chemical composition (wt%) was 0.009 C, 0.003 S, 0.007 P, 0.008 Mn, 6.57 Si, and 93.43 Fe. The forged sheet was rolled from 50 to 3.5 mm thickness by 9 passes using a hot rolling mill, and each pass reduction ratio was 30%, 28.6%, 28%, 27.8%, 23.1%, 30%, 28.5%, 20%, 12.5%, respectively. The total reduction ratio in the whole rolling process was 93%, concretely speaking, in the first 7 passes, its reduction ratio was 23–30%, and the rest of the reduction ratio was controlled in 12–20%. Then the annealing treatments were carried out in a tubular-furnace, and four cooling modes were listed in Table I.
Cooling processes of Fe–6.5 wt% Si alloy.

To further verify the roles of grain boundary character, the micro-textures along the longitudinal section were studied using an FEI Quanta 600 scanning electron microscope (SEM; FEI, Eindhoven, the Netherlands) equipped with an OIM 4000 electron backscatter diffraction (EBSD) detector (EDAX Inc., Mahwah, New Jersey). Macro-texture studies had been measured and calculated at different thickness layers based on the X-ray diffraction. Here, the thickness layer can be defined by a parameter S = 2a/d, where a represents the distance away from the center layer and d is the whole thickness of the sheet. S = 0 and S = 1 represent the center layer and the surface layer, respectively.
The alloy phases in annealed samples with different cooling modes were quantitatively performed on Bruker D8 XRD (Bruker AXS GmbH Ltd., Karlsruhe, Germany), and the antiphase domains (APDs) and antiphase boundaries (APBs) were studied by means of Tecnai G2 F30 transmission electron microscopy (TEM; FEI, Eindhoven, the Netherlands). Hysitron Ti950 Ubi nanoindenter with (Hysitron Inc., Minneapolis, Minnesota) a Berkovich diamond tip was used to examine the nano-hardness values at room temperature. The Berkovich diamond tip had a curvature radius of 50 nm, calibrated by a standard reference sample using fused quartz, which could ensure the dependability of the measured data at a depth of 40–2000 nm. After the tensile specimens were cut into a length of 160 mm and a width of 12.5 mm, the tensile tests were carried out on a CMT5105-SANS electronic universal test machine (Temposonics Inc., Eden Prairie, Minnesota) at room temperature, and then the tensile fractures were observed by means of SEM.
III. RESULTS
A. B2 phase transfer in the Fe–6.5 wt% Si sheets
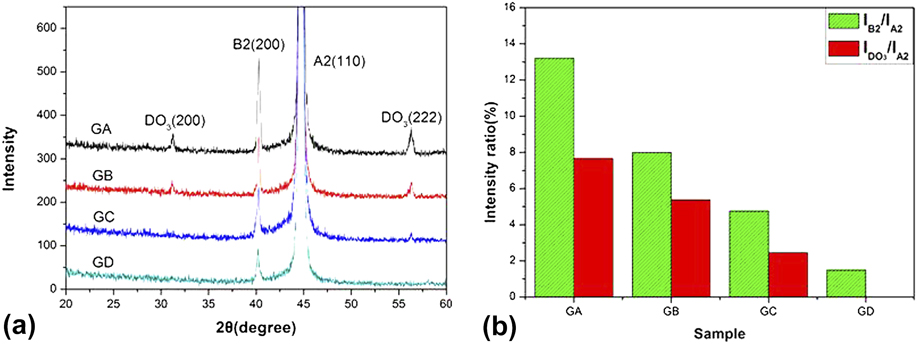
Figure 1 illustrates the XRD patterns and variations of intensity ratios of the Fe–6.5 wt% Si alloy with various cooling modes. As shown in Fig. 1(a), a high number of B2 and DO3 ordered phases occur in sample GA while DO3 ordered phase is not found in sample GD. Based on the XRD patterns, a quantitative calculation is analyzed that there are the maximum values of I
B2/I
A2 and
 ${I_{{\rm{D}}{{\rm{O}}_3}}}{\rm{/}}{I_{{\rm{A}}2}}$
in sample GA, and the minimum values of those in sample GD [Fig. 1(b)]. To validate this, the TEM measurements are performed on Fe–6.5 wt% Si sheets with different cooling modes.
(a) XRD patterns of cooled Fe–6.5 wt% Si sheets and (b) variations of intensity ratios of samples with different cooling modes.

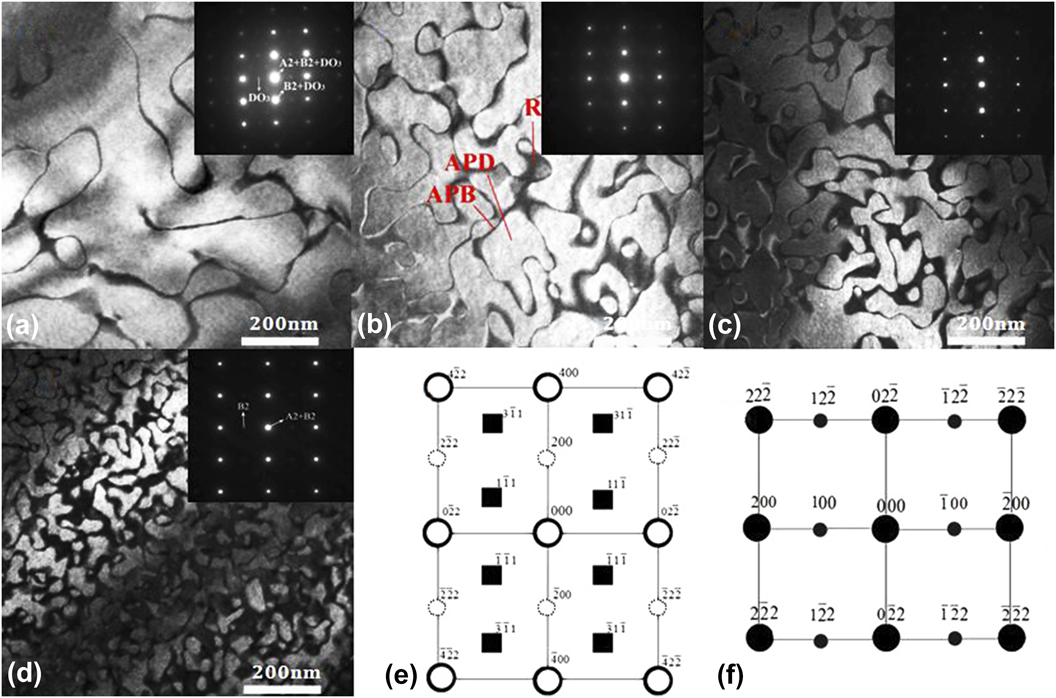
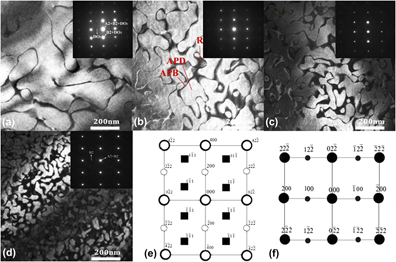
Figure 2 presents APDs and APBs in the [011] zone axis using (200) diffraction spot, as well as SAED pattern. Apparently, the sizes of B2-APDs in sample GA are approximately 500–1000 nm, drastically decrease to 200–300 nm [Fig. 2(b)], and further decrease to only approximately 30–50 nm [Fig. 2(d)]. DO3 phases corresponding in (311) and (111) diffraction spots exist in samples GA [Fig. 2(a)], in contrast, DO3 phase can’t be identified from the SAED pattern of sample GD, which is in accord with the peak intensity of XRD.
APDs and APBs obtained in the [011] zone axis using the (200) diffraction spot: (a) GA, (b) GB, (c) GC, and (d) GD. (e) SAED pattern of sample GA, the solid circle represents A2, B2, and DO3, the dotted circle represents B2 and DO3, and the square represents DO3. (f) SAED pattern of sample GD, the big circle represents A2 and B2, and the small circle represents B2.

B. Characteristics of grain boundaries
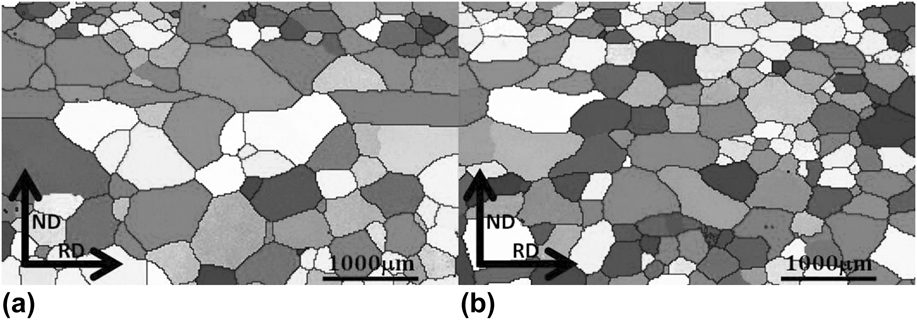
Figure 3 presents the microstructures of annealed sheets. Throughout the scan region, there are the maximum value of grains (1229.6 μm) and the average size of grains (345.58 μm) in sample GA, as present in Fig. 3(a). When the two-step water-cooling process is adopted, the maximum value of grains and the average size of grains drop to 974.95 and 215.06 μm, as shown in Fig. 3(b).
Microstructures of annealed sheets: (a) GA and (b) GD.

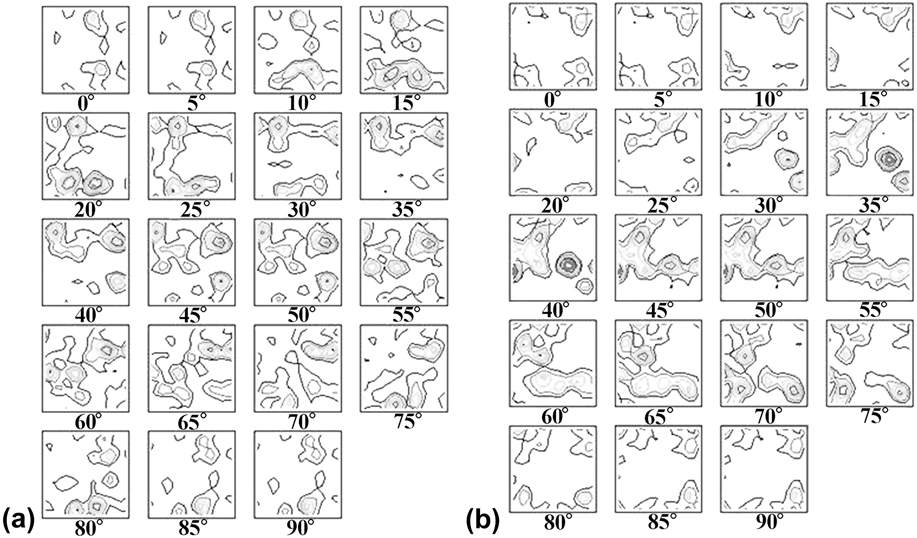
Figure 4 presents the orientation distribution function (ODF) (i.e., Φ2 = 0°–90° sections of the Euler space) of annealed sheets. Comparison of Fig. 4(a) with Fig. 4(b) confirms that relatively weak γ-fiber (〈111〉‖ND) recrystallization texture comprising the {111} 〈110〉 and {111} 〈112〉 components evolve at the sample GA, while the crystallographic orientations of sample GD are characterized by pronounced α-fiber (〈110〉‖RD) texture and γ-fiber texture, which means more severe cooling after being rolled and annealed encourages the formation and development of γ-fiber recrystallization grains in comparison to the sheet which acquired the two-step air-cooling process.
ODF (i.e., Φ2 = 0°–90° sections of the Euler space) of annealed sheets: (a) GA and (b) GD.

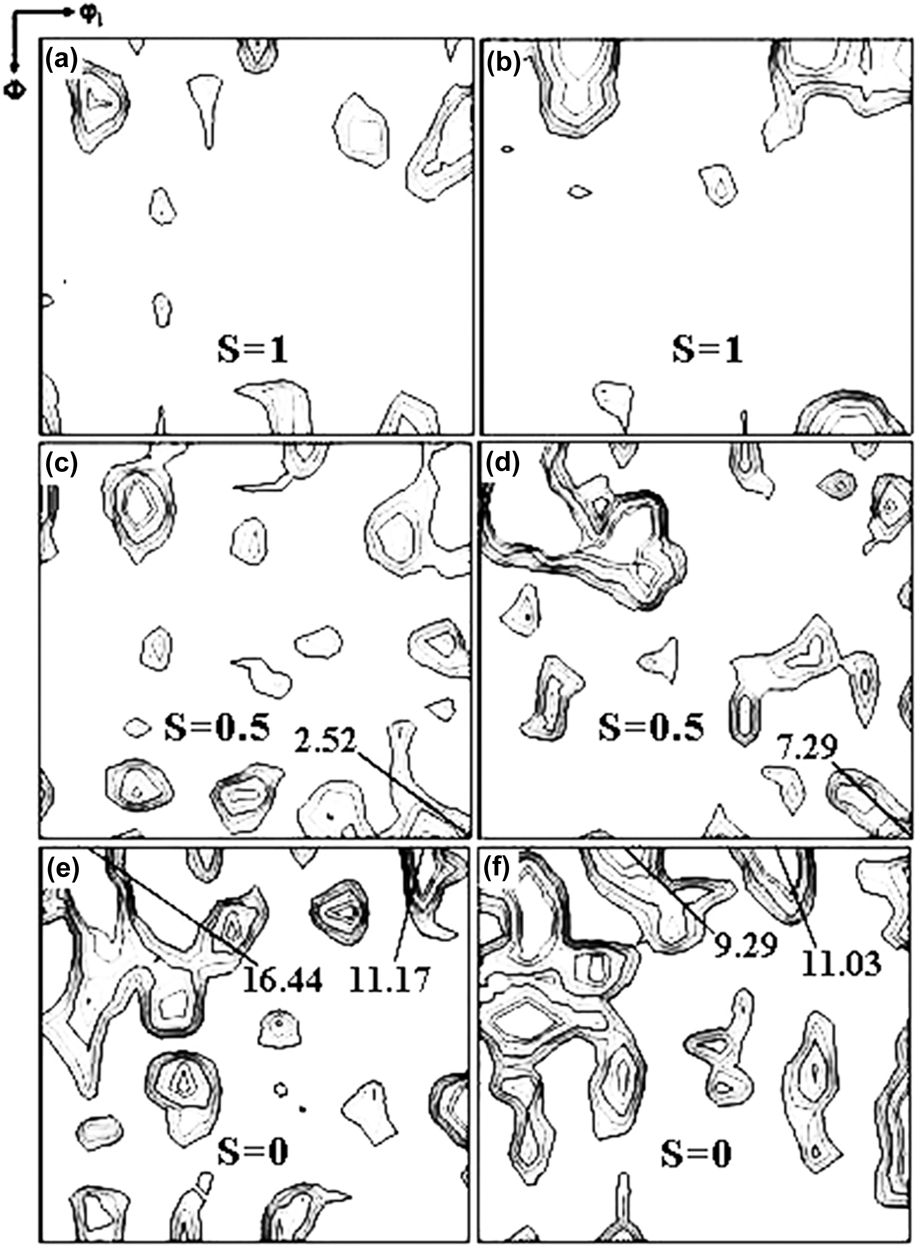
Figure 5 shows the macro-textures at different layers of annealed sheets. And apparently, the textures of annealed sheets are mainly composed of cube orientation {100} 〈001〉 and rotating cube orientation {100} 〈011〉, {l11} 〈110〉, and {l11} 〈l12〉 textures, meanwhile a distribution of macro-textures (S = 1 and S = 0.5 layers) consists of relatively weak α-fiber and γ-fiber textures in contrast to the S = 0 layer. It is worth mentioning here that there is a significant increase in the Goss texture distributing in the subsurface layer [Fig. 5(d)], which may be attributed to a decrease on λ-fiber (〈001〉‖ND) intensity (9.29 and 11.03) of sample GD as compared to that of sample GA (16.44 and 11.17).
Macro-textures (φ2 = 45° section of the ODFs) at different layers of annealed sheets: (a), (c), and (e) GA; (b), (d), and (f) GD.

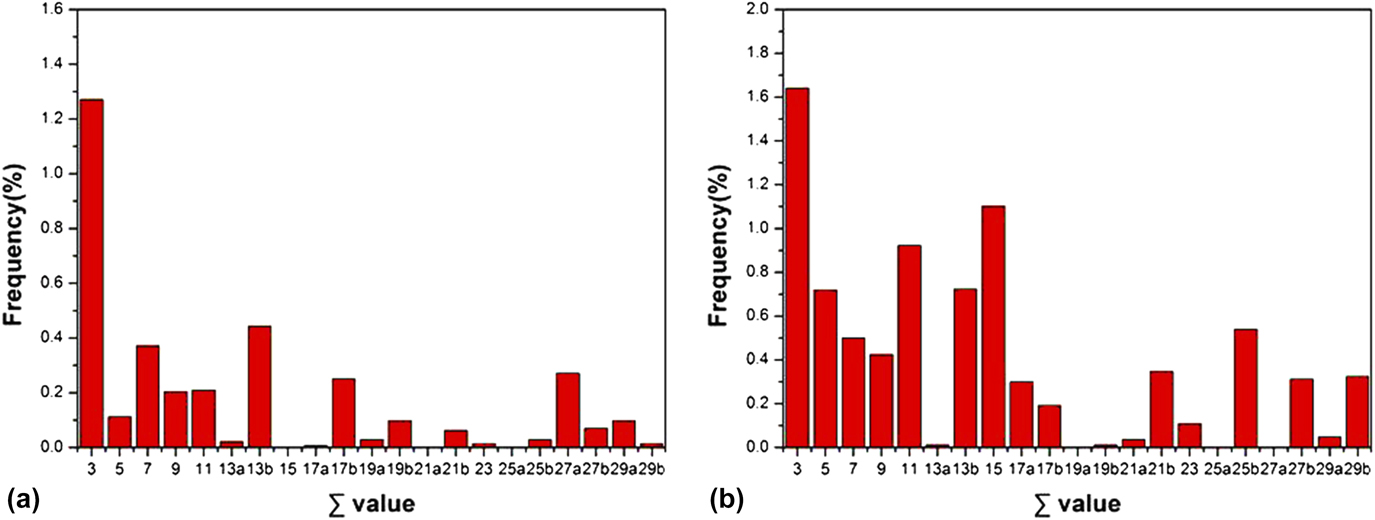
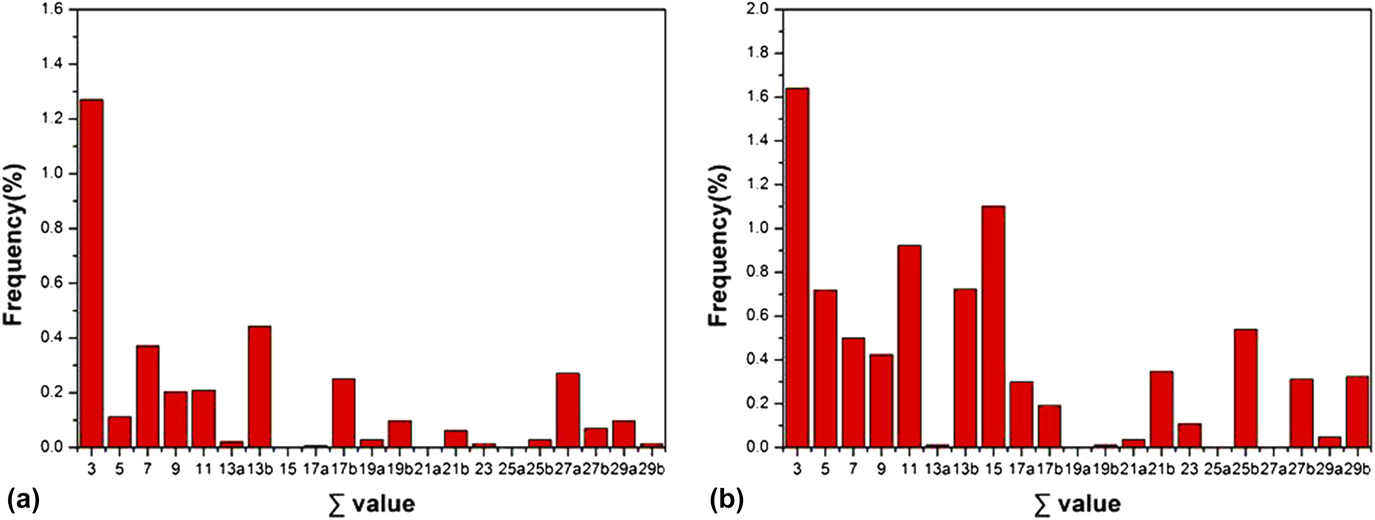
Figure 6 illustrates the frequency distribution of misorientations for annealed sheets. Grain boundary misorientation distributions are calculated along the longitudinal section using the ODF obtained from the EBSD measurements. The special CSL boundaries (3 ≤ Σ ≤ 29) are resistant to the cleavage crack propagating along the grain boundaries, mainly consist of Σ3, Σ7, Σ9, Σ11, Σ13b, Σ17b types, etc. At the same time, the total CSL boundaries satisfying the Brandon’s criterion of maximum angular deviation (Δθ = 15°Σ−1/2) have an increase after adopting the two-step water-cooling process [Fig. 6(b)], and the fraction of Σ3 CSL boundaries is much higher than that of other CSL boundaries in comparison with the sample GA.
Frequency distribution of misorientations for annealed sheets: (a) GA and (b) GD.
C. Nano-hardness and mechanical properties
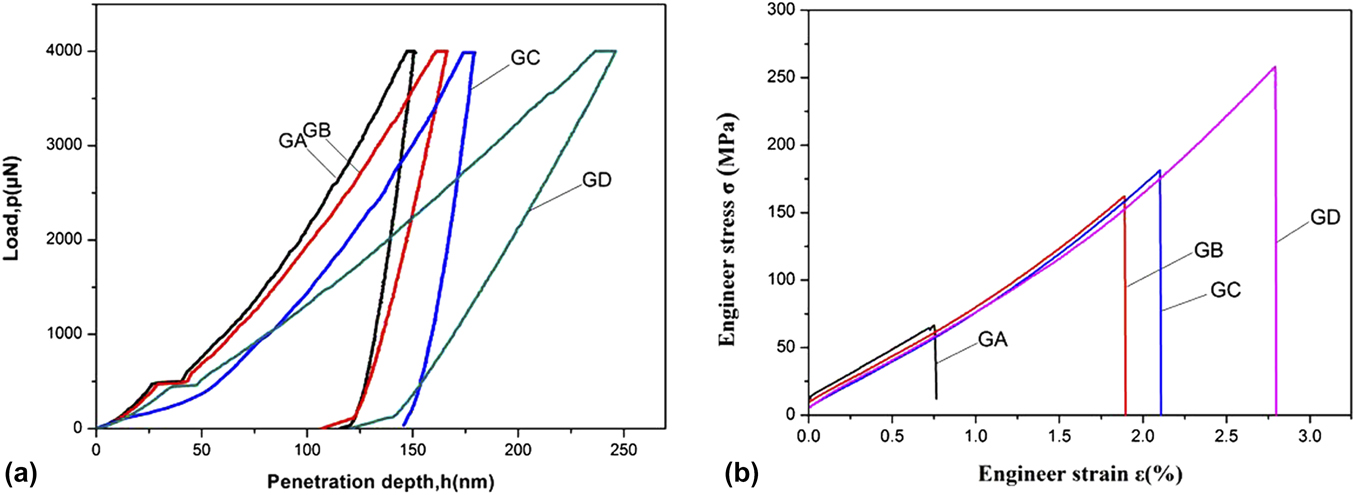
Figure 7 shows the nano-indentation curves and engineering stress–strain curves of the Fe–6.5 wt% Si alloy. According to the previous study, Reference Ye, Matsuoka and Nagashima14 a significant relevance exists between the microhardness and the strain-hardening exponent, and the lower hardness level associated with the lower brittleness is beneficial to plastic deformation. Under the same maximum loading level, the remaining plastic indentation depth increases from 151.4 nm for sample GA to 246.2 nm for sample GD, and the corresponding nano-hardness values are 8.9 GPa and 5.3 GPa, respectively [Fig. 7(a)]. Comparison of the engineering stress–strain curves for annealed sheets with different cooling modes is presented in Fig. 7(b). The brittle fracture occurs at the elastic stage, the tensile testing results show that more severe cooling can induce an increase in the ductility of steels because of the effect of B2 phase transfer and CSL boundaries.
(a) Nano-indentation curves and (b) engineering stress–strain curves of the Fe–6.5 wt% Si alloy.
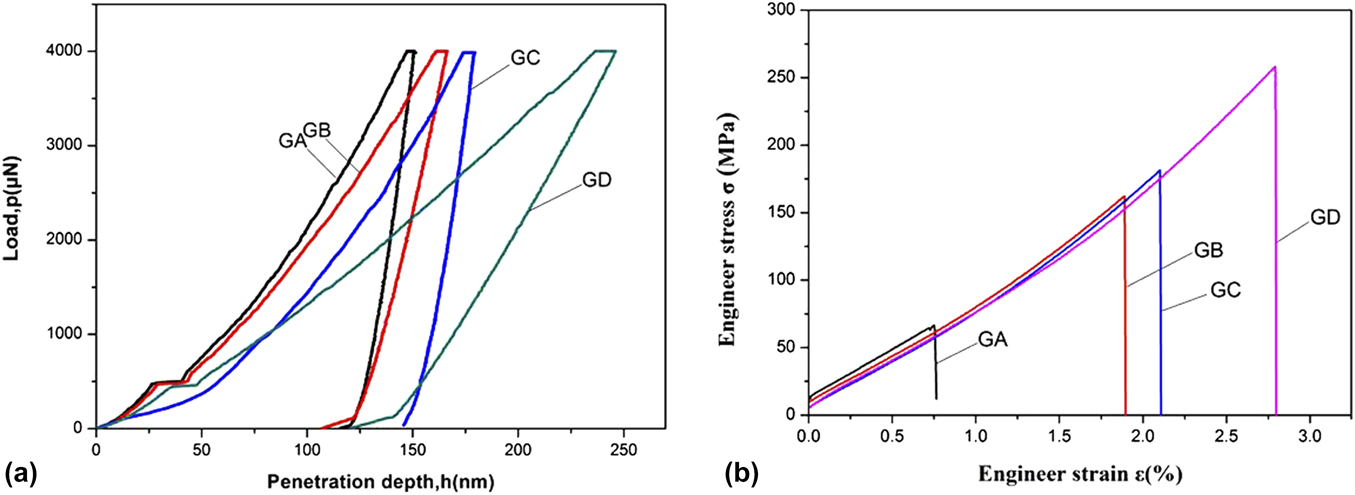
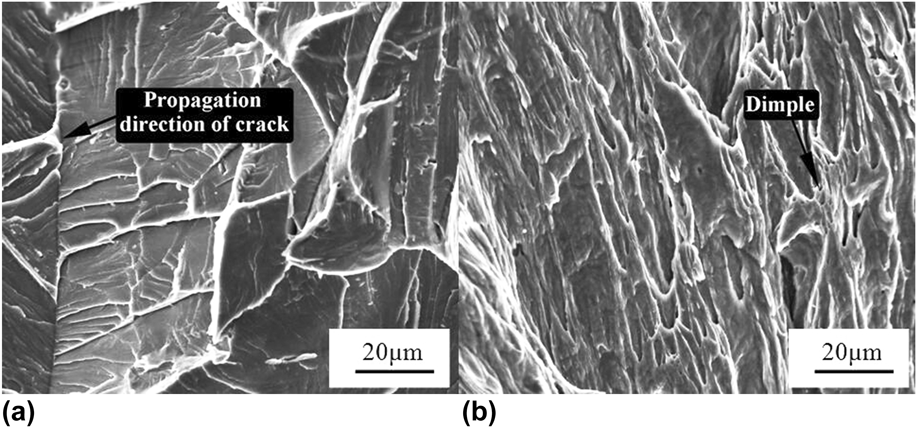
Figure 8 shows the fracture surfaces of central regions in annealed sheets. The tensile fracture of sample GA is characterized by the river patterns occurring on cleavage planes, and the propagation direction of the crack is indicated by the arrow above [Fig. 8(a)]. While the occurrence of some fine dimples shows that more severe cooling after being rolled and annealed can progressively and significantly increase the plastic deformation ability [Fig. 8(b)].
Fracture surfaces of central regions in annealed sheets: (a) GA and (b) GD.

IV. DISCUSSION
A. Effect of B2 phase transfer on mechanical properties
Thus far, the important reasons for the low plasticity of ordered alloys are the long-range ordered structure, the complex dislocation configuration, larger unit cell, and lower symmetry. Reference Ma, Xie, Huang, Yan and Guo15 One should expect that the cooling processes inhibit the nucleation and growth of ordered phases to control the transformation of the B2 ordered phase. A single A2 disordered phase exists in 950 °C annealed sheets; on lowering the temperature, the early activation of the most favorable nucleation sites can contribute to the nucleation and growth of DO3; both B2-and DO3-ordered domains have relatively more energy and time to develop during the slower cooling process [Fig. 2(a)]. While the B2 → DO3 stage cannot happen in the water-cooling process, the decreased B2 phase and completely inhibited DO3 phase may be attributed to more severe cooling processes [Fig. 2(d)].
Besides, the energy of APBs with different ordered structures plays a determining role in the improvement of mechanical properties. Generally, the phase difference for Fe and Si atoms occupation makes intragranular ferrite divided into many areas with complete APD, and the normal pairing status of the coherent lattice is changed into abnormal APBs with low energy. Reference Naito, Nakagawa, Machida, Shigematsu, Nakao and Sudoh16 The APBs act as a kind of plane defect in the ordered alloy and can cause an increase in the whole system energy, and this energy mainly concentrates on APB, called the APB energy (E APB). Reference Koizumi, Allen, Ouchi and Minamino17 Generally, every piece of APDs forming lots of closed curves is surrounded by the APBs, and an increase in APD sizes can induce a decrease in the density of APBs, deteriorating the ductility of steels.
The relationship between E APB and the dislocation width (R) is described as follows Reference Gilles, Hofmann, Johnson, Gao, Mukherji, Hugenschmidt and Pikart18 :
 $${E_{{\rm{APB}}}} = {{G{b^2}} \over {2\pi R}}\left[ {{{\left( {\sin \theta } \right)}^2} + {{{{\left( {\cos \theta } \right)}^2}} \over {1 - \upsilon }}} \right]\quad ,$$
where υ represents the Poisson’s ratio, G is the shear modulus, and θ is an angle between the Burgers vector b and the vertical direction to the dislocation line. For screw superdislocations, θ equals to 90°, and for edge superdislocations, θ equals to 0°.
The average R relating to the movability of dislocation between each APB is measured from Fig. 2, and their values are 8 nm, 18 nm, 22 nm, and 28 nm, respectively. As is well known, R is the wider, and the energy it needs is low when crossing APBs, which makes it easy to overcome obstacles and improve the ability of matrix deformation due to the decrease of slip resistance. Reference Huang, Yang and Sun19 When the air-cooling process is adopted, with the increased sizes of APDs and the corresponding decrease in the density of APBs, the APB energy in the super-dislocation pair of the air-cooling specimen is much higher than that of the water-cooling specimens, triggering a pronounced change in the mechanical characterization of the Fe–6.5 wt% Si alloy.
The intergranular cracks extending along grain boundaries are attributed to the existence of brittle phases, such as B2 and DO3 ordered phases. When the stress concentration caused by different grain orientations is bigger than the cleavage strength, the initiation of cracks generating the river patterns can cause the cleavage fracture. The cleavage plane is a crystal plane with minimum surface energy and low index, a priority with the microcrack propagation under normal stress, considered to have poor ductility. Reference Depover, Pérez Escobar, Wallaert, Zermout and Verbeken20 The intersecting cleavage cracks along two parallel cleavage planes with different heights can induce the microcrack propagation when the cleavage crack and screw dislocation meet [Fig. 8(a)]. In comparison, the occurrence of some fine dimples [Fig. 8(b)] in sample GD means that severe cooling after rolling and annealing has contributed to the improvement of ductility.
B. Effect of texture evolution on CSL boundaries
In BCC materials, Goss texture distributes preferentially on the subsurface layer of the sheets because different arrangements of atoms in each crystal direction cause anisotropy in growth rates. During annealing, oriented nucleation and selective growth mechanisms can be proposed to account for the development of recrystallization texture. Goss texture occurring by the selective growth of Goss grains can predict a relatively high fraction of CSL boundaries when an advancing nucleus comes into contact with other grains that are not immediately adjacent to the nuclei at the onset of grain growth. Therefore, as a dynamic process, an enhancement of CSL interfaces bounding the growing Goss grains is beneficial for migrating through an adjacent crystal during random growth.
The CSL boundaries act as an intrinsic factor that provides resistance to the initiation and propagation of cracks, and the texture is an external factor whose intensity determines whether the CSL boundaries appear. Concretely speaking, a twin relationship (60°〈111〉) between {111} 〈110〉 and {111} 〈112〉 orientations constitutes Σ3 boundaries, Σ11 (54°〈110〉) CSL boundaries exist between {001} 〈110〉, {111} 〈110〉, and {111} 〈112〉 orientations, and Σ9 (35°〈110〉) CSL boundaries form between {111} 〈110〉 and {112} 〈110〉 orientations. Therefore, more homogeneous distribution of γ-fiber recrystallization texture will increase the high adjacent probability of {112} 〈110〉, {111} 〈110〉, and {111} 〈112〉 orientations that have contributed to more CSL boundaries.
To identify the characteristics of grain boundaries that are susceptible to mechanical properties of steels, further studies are necessary for the detailed understanding on texture formation of annealed sheets with different cooling modes. The order of stored energy is as follows: {110} > {111} > {112} > {100} component, and the nucleation and growth rate of each grain are determined by various deformation stored energy (Taylor factors). Reference Bernier, Leunis, Furtado, Putte and Ban21 According to the oriented-nucleation mechanism, the nucleation of recrystallization grains can form more easily in the orientation grains endowed with a high stored energy. The {001} 〈100〉 orientation will rotate along the following path: {001} 〈100〉 → {001} 〈110〉 → {111} 〈112〉 → {111} 〈110〉 → {112} 〈110〉 components. In case of two-step water-cooling, fast cooling rates ensure the development of a stronger γ-fiber recrystallization texture comprising the {111} 〈110〉 and {111} 〈112〉 components and lead to the rotation of metastable {001} 〈100〉 → {111} 〈112〉 and {111} 〈110〉 components with a high Taylor factor that is prone to recrystallization along the path for rotation [Fig. 4(b)]. Besides, owing to a significant nucleation competition among the orientations, the recrystallization grains with the {111} 〈112〉 orientation will form a nucleus and grow in the deformation matrix containing the {111} 〈110〉 and {112} 〈110〉 orientations. Thus a more stable {112} 〈110〉 orientation and γ-fiber texture comprising the {111} 〈110〉 and {111} 〈112〉 components occur in the texture of sample GD [Fig. 4(b)], further increasing the opportunities for a large fraction of the CSL boundaries.
It is important to note that the coarser recrystallized grains obtained by slow cooling are attributed to the early activation of the most favorable nucleation sites at relatively low temperatures, thus the cooling rate affects the nucleation and growth of Goss grains and formation of Goss texture. When adopting two-step air-cooling, the {110} 〈001〉 component will rotate to λ-fiber texture including the {001} 〈110〉 and {001} 〈100〉 components along the 〈110〉 axis because of the instability of the {110} 〈001〉 Goss texture. Therefore, the sample GA exhibits a significant decrease in the intensity of Goss texture in the S = 0.5 layer [Fig. 5(c)] and an increase in the intensity of λ-fiber texture (16.44 and 11.17) in the S = 0 layer [Fig. 5(e)].
C. Effect of grain boundary character on microstructure and mechanical properties
The obtained coarser recrystallized grains by slow cooling are attributed to the early activation of the most favorable nucleation sites at relatively low temperatures. These recrystallized nuclei can grow and subsequently consume the neighboring less-favored nucleation sites before the temperatures continue to slowly plummet to a large number of nucleation sites. In case of a very fast cooling rate, early activation is difficult as the recrystallization temperature is reached almost instantaneously; as expected, finer recrystallized grains occur in sample GD after the two-step water-cooling process is adopted [Fig. 3(b)], and coarser recrystallized grains are obtained in sample GA [Fig. 3(a)] due to low cooling rates attributed to early activation of the nucleation sites.
Further studies are necessary for understanding of the brittle fracture characterization of the Fe–6.5 wt% Si alloy, and the CSL boundaries with lower Σ values play an important role in extending the discontinuous growth path of the microscopic crack tip. It should be noted that the frequency of grain misorientation angles at 0–15°, 40–45°, and 60–65° is much higher than that of the random distribution. The Σ29 CSL boundaries in the range of 40–45° have a misorientation angle of 43.6°, while the Σ3 CSL boundaries featured as having a misorientation of ∼60° fall into the range of 60–65°. Zikry et al. Reference Wu and Zikry22 reviewed that CSL boundaries affecting the dislocation transmission were prone to a dislocation pile-up and accumulation; the stress relief in the crack tip could be strongly influenced by the dislocation density generation and transmission for the bicrystal with Σ3 (60°〈111〉) CSL boundaries, impeding the growth of accelerated cracks. In the crack propagation process, the plastic deformation produced in the crack tip can induce stress relief at the CSL boundaries and increase the effective surface energy; therefore, the grain boundary character is one of the most important factors influencing the material brittleness tendency. In comparison with the other CSL boundaries, Σ3 CSL boundaries consisting of a stacking disorder of a nonclosed packed face are most beneficial to the toughness required to prevent failure in service. In consideration of the role of the CSL boundaries on the fracture mode, it is witnessed from the fracture modes that with the increased number of Σ3 CSL boundaries, some fine dimples occur on the tensile fracture of the sample GD [Fig. 8(b)], which means that adopting the two-step water-cooling process is conducive to the mechanical properties of alloy.
Sakaguchi et al. Reference Sakaguchi, Ohguchi, Shibayama, Watanabe and Kinoshita23 reported that only a discontinuous cracking was observed on the faceted CSL boundaries, and the other facet planes exhibited high resistance to the crack propagation and also illustrated a relationship between the boundary structures and grain boundary energies which was directly connected to the CSL model. When the coincidence of atomic positions in both adjacent grains is high, the number of broken bonds at the grain boundaries is small, and this type of grain boundary energy is relatively low. The CSL boundaries are also constructed with simpler and smaller structural units, represent more atoms in the perfect structure, and cause smaller excess energy for the grain boundary. Reference Yazdandoost and Mirzaeifar24 Hence, the low-ΣCSL boundaries featured as low-energy and strong bonding forces have the attribute of impeding the cleavage crack propagating along the grain boundaries and result in the decreased brittleness of grain boundaries. A large fraction of CSL boundaries form at the annealed sheet experiencing the two-step water-cooling process after being rolled and annealed due to a uniform and sharp γ-fiber recrystallization texture that induces low susceptibility to working embrittlement and enhances resistance to intercrystalline effect, thereby improving the mechanical properties of the sheet as compared to the two-step air-cooling sample.
V. CONCLUSIONS
In this study, the combined effect of B2 phase transfer and the grain boundary character on the mechanical properties of rapidly cooled Fe–6.5 wt% Si alloy was investigated, and the relationship between the texture evolution and CSL boundaries was determined using various cooling processes. When the two-step water-cooling process is adopted, the content of B2 and DO3 phases is reduced, and the metastable {110} 〈001〉 orientation is transformed into a more stable {112} 〈110〉 orientation and the γ-fiber texture comprising the {111} 〈110〉 and {111} 〈112〉 components. Additionally, the increasing number of CSL boundaries due to more sharp and homogeneous distribution of γ-fiber recrystallization texture can contribute high resistivity to the initiation of cracks, induce low susceptibility to working embrittlement, enhance resistance to intercrystalline effect, and result in the improvement of mechanical properties.
ACKNOWLEDGMENTS
This work was supported by the National Natural Science Foundation Project (51174057 and 51274062), the Specialized Research Fund for the Doctoral Program of Higher Education of China (20130042110040), and the Fundamental Research Funds for the Central Universities (N130607002).