I. INTRODUCTION
The high chromium content, addition of alloying elements such as niobium and titanium, and the reduction of the interstitial elements, viz. carbon and nitrogen (C, N), give high corrosion and thermal fatigue resistance, good mechanical strength, and good weldability for ferritic stainless steels. Reference Lewis and Pickering1–Reference Yazawa, Ozaki, Kato and Furukimi3 Nb-stabilized steel AISI 430 has better weldability and formability than that of nonstabilized grades owing to the formation of Nb carbonitrides evenly distributed throughout the ferritic matrix. Reference Lewis and Pickering1,Reference Huh and Engler2
In contrast with austenitic stainless steels, the ferritic ones present a lower production cost, due to the absence of nickel as an alloying element. Further, such steels have higher yield strength, lower strain hardening exponent, but lower ductility when compared to austenitic stainless steels. Reference Lewis and Pickering1,Reference Lo, Shek and Lai4
Several studies about microstructure and crystallographic texture of ferritic stainless steels have been conducted in recent decades to improve the mechanical properties of such steels, especially their behavior in deep drawing, and to eliminate or reduce the formation of stretch marks, aiming to improve the postforming surface finish. Reference Lo, Shek and Lai4–Reference Gao, Liu, Liu, Zang, Dong, Hao and Wang9 Yazawa et al. postulated that newly developed ferritic stainless steel sheets could be applied in a wide range of automotive parts and in applications requiring corrosion resistance and deep drawability, where anticorrosive austenitic stainless steel SUS304 has previously been used. Reference Yazawa, Ozaki, Kato and Furukimi3
“Crystallographic texture” refers to generating a preferential orientation after plastic deformation, recrystallization, and processing. Reference Humphreys and Hatherly11,Reference Humphreys13 Metal recrystallization may generate a different preferred crystallographic orientation than plastic deformation does or it may not generate any preferential texture. Reference Doherty, Hughes, Humphreys, Jonas, Jensen, Kassner, King, McNelley, McQueen and Rollet10,Reference Humphreys and Hatherly11 The mechanical behavior of polycrystalline materials is considerably affected by their crystallographic texture, which is described by components. A component is represented by a group of a reasonable number of grains oriented in a near-ideal crystal. Reference Humphreys and Hatherly11,Reference Humphreys13 There are various methods of representing the texture of a metal or alloy. Electron backscatter diffraction (EBSD) has recently been used with scanning electron microscopy (SEM) to quickly and effectively determine the individual orientation of each grain, thereby enabling the amount of each grain orientation to be automatically calculated. Reference Humphreys13 Recrystallization kinetics can in turn be quantified using the Johnson–Mehl–Avrami–Kolmogorov (JMAK) model and the sigmoidal curve representing the recrystallized volume fraction versus annealing time. Reference Sellars and Rossi14–Reference Hatherly and Chandra18
The microstructure after cold deformation shows numerous crystal defects in regions of heterogeneity deformation (i.e., shear and transition bands), favorable to nucleation during annealing. Reference Humphreys and Hatherly11,Reference Abbaschian, Abbaschian and Reed-Hill12 Coarse particles (>1 µm on average) promote nucleation during recrystallization. Reference Raabe and Lücke19 Nucleation is also favored by anisotropy, i.e., by a few preferentially oriented grains. Reference Raabe and Lücke20
The typical recrystallization textures of ferritic grade stainless steels have components consisting of α- and γ-fibers, depending on the chemical composition, microstructure, and texture of the initial hot- and cold-rolled steel. Reference Yazawa, Ozaki, Kato and Furukimi3–Reference Gao, Liu, Liu, Zang, Dong, Hao and Wang9 From 1992 to 1996, Raabe Reference Raabe and Lücke19–Reference Raabe21 reported that the recrystallization texture of ferritic steel containing 11% chromium and cold rolled to 80% thickness showed a degraded α-component and more intense γ-fibers with increasing annealing time.
The oriented nucleation and selective growth models have previously been proposed to explain the texture development during recrystallization. Reference Gangli, Jonas and Urabe22–Reference Verbeken, Kestens and Jonas25 Oriented nucleation is based on the view that some grains nucleate more frequently than grains of other orientations and that such grains maintain their initial number advantage in the end recrystallization texture. Reference Verbeken, Kestens and Jonas25 By contrast, selective growth considers that nuclei characterized by certain misorientation relationships with respect to the surrounding matrix will grow faster than other grains and hence will dictate the end recrystallization texture. Reference Kestens and Jonas23,Reference Verbeken, Kestens and Jonas25 The occurrence of either of these mechanisms depends on the intensity and distribution of the initial deformation texture.
The high intensity and uniformity of the γ-fiber recrystallization texture improves the behavior of ferritic stainless steel during stamping and deep drawing. Reference Yan, Bi, Li and Xu6–Reference Gao, Liu, Liu, Zang, Dong, Hao and Wang9 This condition can be achieved using various methods, among them, controlling the chemical composition of the steel and thermomechanical processing. Reference Du, Jiang, Sun, Liu and Zhang26
In this study, we evaluated the recrystallization kinetics, preferred grain orientation during nucleation and growth as well as the formation and uniformity of γ-fibers in hot-rolled annealed (HRA) samples and in hot-rolled nonannealed (HRNA) ones. The restoration was microscopically evaluated to establish a relationship between the crystallographic texture and the microstructure evolution. The methodology used in this work was the combination of conventional hardness measurement techniques and recrystallized volume fraction measurements analyzed using EBSD. The EBSD technique was also used to monitor the texture evolution, i.e., oriented nucleation or selective growth, during annealing. Although this subject has been extensively covered for ultralow carbon (ULC) and interstitial-free (IF) steels, Reference Gangli, Jonas and Urabe22–Reference Zhang, Liu and Wang27 it has seldom been covered for ferritic stainless steels. Reference Huh and Engler2,Reference Maruma, Siyasiva and Stumpf8,Reference Gao, Liu, Liu, Zang, Dong, Hao and Wang9,Reference Raabe and Lücke20,Reference Sinclair, Mithieux, Schmitt and Bréchet28
Although the annealing is conducted in a continuous or batch way, the purpose of this work is not to simulate an industrial processing, but to evaluate the influence of recrystallization phenomena in the crystallographic texture of Nb-stabilized ferritic stainless steel.
II. MATERIALS AND METHODS
Nb-stabilized ferritic stainless steel AISI 430 strips were used as the samples. The HRNA and HRA strips were 4.5 and 4.3 mm thick, respectively, and had the following chemical composition: 0.02% C, 0.20% Mn, 0.03% P, 0.32% Nb, 16.07% Cr, 0.18% Ni, 0.002% Al, 0.004% Ti, 0.0005% S, and 0.024% N.
All the samples were hot rolled in the range 800–1000 °C in a Steckel mill. The HRA samples were then industrially annealed at 1000 °C. The scale was removed from all the samples. The HRNA and HRA samples were then cold rolled in a laboratory mill for 12 and 14 passes to thickness reductions of 77.8 and 76.7%, respectively. The cold-rolled samples were cut into 80 × 10 × 1 mm strips and were isothermally annealed in air in a muffle furnace and then air-cooled.
The annealed strips were cut and prepared using sanding and conventional polishing to examine the microstructure of the longitudinal section (ND × RD plane). Vilella etchant was used to attack the steel strips for the optical (OM) and SEM examinations. Colloidal silica (0.04 µm) was used for 90 min to automatically polish the steel strips for the EBSD examinations.
The grain size was measured using the OIM program version 7.2 developed by TSL/EDAX™ and directly by image analysis, i.e., by measuring the area of at least 200 grains per sample and then extracting the square root of the average value. Vickers microhardness tests were performed with a dwell time of 10 s and a load of 300 gf (2.98 N) to plot microhardness of samples isothermally annealed at 400–1000 °C for 900 s.
The recrystallization kinetics was measured using quantitative metallography, following the procedures of ASTM E562-08 (Ref. 29) and the JMAK model [Eq. (1)]. Reference Sellars and Rossi14–Reference Mohapatra and Sahay17 The recrystallized volume fraction was measured by the point counting method. The Avrami exponent (n) and B parameter was calculated by linearizing X V as a function of time according to the following equation Reference Sellars and Rossi14,Reference Vandermeer and Rath15 :
 $${X_{\rm{V}}} = 1 - {\rm{exp}}\left( {B{t^n}} \right)\quad .$$
The microstructure and texture analysis were performed using EBSD for the samples as-received, cold-rolled, and annealed at 700 °C for 10, 900 and 14,400 s to evaluate the beginning, middle, and end of the recrystallization.
The texture components represented by the orientation distribution function (ODF) correspond to the section φ2 = 45°.
III. RESULTS
A. Microstructure evolution during annealing
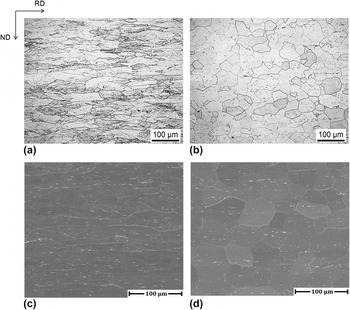
Figure 1 illustrates the microstructure of the as-supplied samples. The micrographs were obtained using OM [Figs. 1(a) and 1(b)] and SEM [Figs. 1(c) and 1(d)]. Note that the hot-rolled steel clearly had a partially workhardened microstructure, Figs. 1(a) and 1(c) and, as expected, the HRA steel showed equiaxed grains, Figs. 1(b) and 1(d). The light particles evident in the SEM micrographs are Nb carbonitrides, Figs. 1(c) and 1(d). The HRNA steel clearly shows a larger amount of Nb carbonitrides in the ferritic grain boundaries, Fig. 1(c), and the HRA steel shows them to a lesser extent, Fig. 1(d). The microstructure of the HRA sample has slightly larger, equiaxed grains and a more homogeneous size distribution than the HRNA sample. Further, the precipitates are slightly aligned in the rolling direction and more homogeneously distributed throughout the HRA matrix. The annealing performed after hot rolling provided the largest microstructural homogeneity, Figs. 1(b) and 1(d).
(a, b) Optical micrographs and (c, d) SEM micrographs. (a, c) HRNA and (b, d) HRA samples as received.

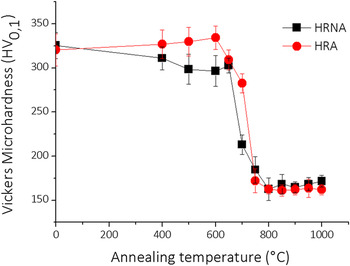
The Vickers microhardness of the HRA and HRNA samples, cold rolled and annealed for 15 min soaking in the range 400–1000 °C was plotted as a function of annealing temperature in Fig. 2. The first data points in Fig. 2, where the temperature is 25 °C, refer to the steel in the workhardening, i.e., cold-rolled state. There was a sharp decrease in hardness for temperatures above 600 °C. Above 800 °C, the hardness behavior stabilized and remained relatively constant until 1000 °C, where the ferrite grains grew. This is how the annealing temperature of 700 °C was chosen for the study of microstructure and texture evolution.
Vickers hardness plotted as a function of annealing temperature for the Nb-stabilized 430 stainless steel samples annealed at different temperatures to a soak time of 900 s.

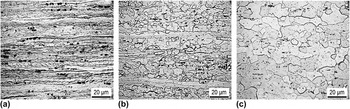
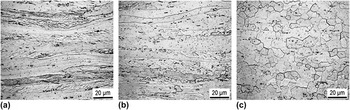
The Vickers microhardness, Fig. 2, together with the OM, Figs. 3 and 4, suggest that owing to the increased amount of stored energy, the sample that was annealed only once (HRNA) started recrystallizing before the sample that was annealed twice (HRA). The premature nucleation of recrystallization in the HRNA sample enabled the recrystallized grains to develop in a greater volume fraction, and they were therefore more refined than those in the sample recrystallized later or at a slightly higher temperature.
Microstructure evolution of HRNA samples annealed for (a) 10, (b) 900 and (c) 14,400 s at 700 °C.

Microstructure evolution of HRA samples annealed for (a) 10, (b) 900 and (c) 14,400 s at 700 °C.

The increased hardness of the HRA sample was due to Nb precipitation in a solid solution. According to the literature, Reference Deschamps, Danoix, De Geuser, Epicier, Leitner and Perez30,Reference Charleux, Poole, Militzer and Deschamps31 the precipitation of Nb carbonitrides in carbon steels at lower temperatures (600 °C) is responsible for an increase in steel strength. When such carbonitrides are partially soluble, the annealing gradually decreases the hardness of the steel during subsequent isochronous annealing.
During annealing, the energy stored during cold deformation acts as a driving force to initiate recrystallization, and new grains nucleate from deformation heterogeneities in the microstructure as shear and transition bands. Reference Yan, Bi, Li and Xu6–Reference Maruma, Siyasiva and Stumpf8,Reference Du, Jiang, Sun, Liu and Zhang26,Reference Zhang, Liu and Wang27 In the micrographs illustrated in Figs. 3(b) and 4(b), the grains are deformed and aligned in the rolling direction. This emphasizes the importance of the length of time by which the sample is annealed at 700 °C for initiating and developing recrystallization (900 s) since it is possible that the state of the workhardened matrix will only partially change during recrystallization because the annealing temperature is low, reducing thereby the recrystallized volume fraction. The start of nucleation in various grains is shown in the micrographs in Figs. 3(b) and 4(b). It should be noted that increasing the annealing temperature by 50 °C significantly accelerated recrystallization, see Fig. 2.
The micrographs shown in Figs. 3(b) and 4(b) feature a partially crystallized state in which the initial nuclei were formed from the deformation bands. The precipitates are distributed almost evenly throughout the matrix and are aligned along the rolling direction.
The micrographs in Figs. 3(c) and 4(c) illustrate a completely recrystallized microstructure. The breakdown of the microstructure evolution and the formation of the texture will be presented below. The distribution of the Nb carbonitrides, i.e., the dark spots in the micrographs in Figs. 3(c) and 4(c), is now clearer.
B. Recrystallization kinetics
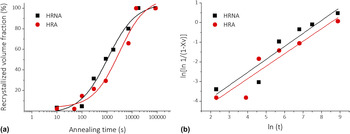
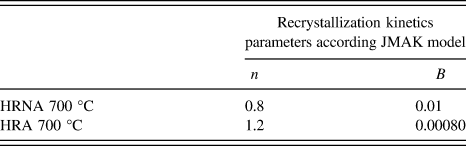
Figure 5 illustrates the sigmoid curve obtained using quantitative metallography and Eq. (1) by linearizing the same for the two sets of samples. The linearized curves for the plots of recrystallized volume fraction versus annealing time enable the Avrami exponents of the recrystallization kinetics of the two series of samples to be compared. The obtained constants (B) and the Avrami exponents (n) are listed in Table I.
(a) Recrystallized volume fraction, X V, plotted as a function of annealing time. (b) Linearization of the data in (a) produced using the JMAK model and quantitative metallography of the HRNA and HRA samples annealed at 700 °C.

Values of n and B for the recrystallization rate of the Nb-stabilized ferritic stainless steel.

The recrystallization kinetics of the Nb-stabilized type 430 stainless steel proceeded through nucleation and grain growth, and the sigmoid curves show an early slow recrystallization, followed by an abrupt increase in the recrystallization rate after 100 s. When the process was near completion; that is, when the material was almost completely recrystallized, the transformation rate is decreased, Fig. 5(a).
The recrystallization started slowly because during the early stage, the microstructural transformations only depend on subgrain growth. The high stacking fault energy of ferritic grade steels in turn leads to the formation of cellular substructures in the crystal lattice rather than regions containing numerous crystalline defects associated with them. Further, Nb precipitates slow recrystallization either by acting as a solute drag in the crystal lattice or as barriers against the movement of grain boundary migration. Reference Yazawa, Ozaki, Kato and Furukimi3,Reference Humphreys13
Annealing the samples after the recovery or even longer causes the grains nucleate and grow rapidly in deformation heterogeneities and at the interfaces of Nb carbonitride particles, a phenomenon known as particle stimulated nucleation. Thus, the energy stored during cold deformation is gradually consumed. The nuclei gradually form over time to use all the potential nucleation sites and then grow nonisotropically until they reach the point of impingement, leading to a reduction in the recrystallization rate at the end of the process, Fig. 5(a). Reference Yazawa, Ozaki, Kato and Furukimi3,Reference Humphreys13
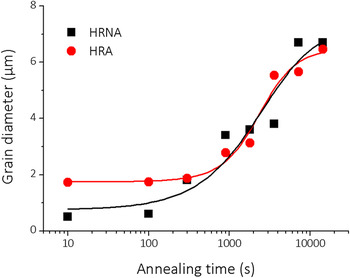
The mean grain diameter, obtained using image analysis software, is plotted as a function of annealing time at 700 °C in Fig. 6. The HRA grains were notably larger than the HRNA ones during about the first 100 s of annealing. However, the grain diameters of both samples converged to 7 µm after about 10,000 s, when it was impossible to differentiate between the two samples, considering the measurement error.
Average grain diameter plotted as a function of annealing time for HRNA and HRA samples annealed at 700 °C.

C. Microtexture
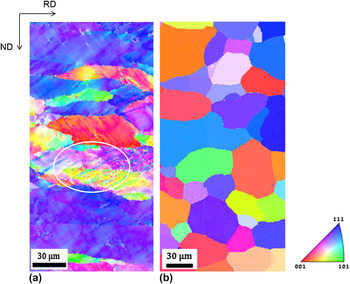
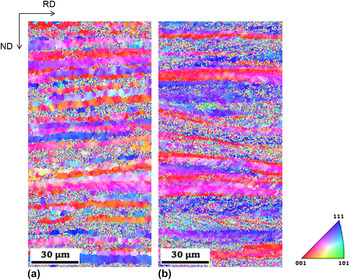
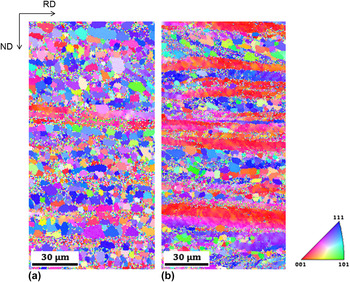
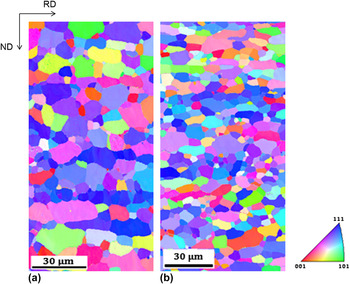
The microstructure evolution and crystallographic texture recorded during annealing are shown in Figs. 7–14 for the HRA and HRNA samples. Figure 7(a) shows the partially workhardened microstructure of the hot-rolled steel. Recrystallization, or more precisely, new grains were ferritically nucleated in the deformation bands, Fig. 7(a). These deformation bands are visible within the deformed grains, i.e., the changes in the morphology of the same are correlated with the variation in the tone in the Inverse Pole Figure (IPF) images. Figure 7(b) shows a profound change in the microstructure, i.e., the steel recrystallization led to equiaxed ferritic grains.
IPF maps for the samples as received: (a) HRNA and (b) HRA.

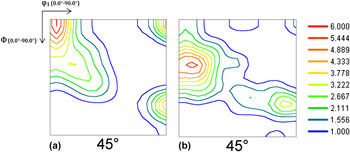
ODF for the samples as received: (a) HRNA and (b) HRA.

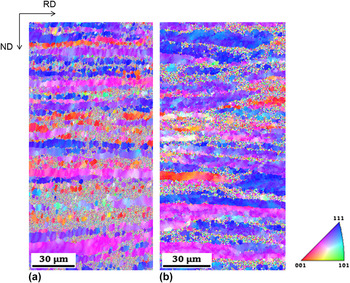
IPF maps for cold-rolled: (a) HRNA and (b) HRA samples.

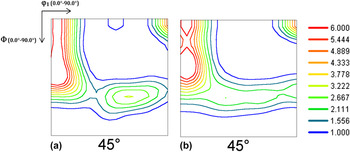
ODF for cold-rolled samples: (a) HRNA and (b) HRA.

IPF maps for cold-rolled samples annealed at 700 °C for 10 s: (a) HRNA and (b) HRA.

IPF maps for cold-rolled samples annealed at 700 °C for 900 s: (a) HRNA and (b) HRA.

IPF maps for cold-rolled samples annealed at 700 °C for 14,400 s: (a) HRNA and (b) HRA.

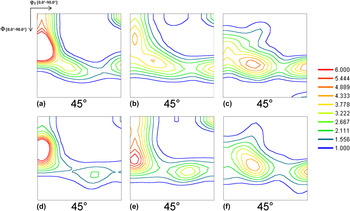
Texture evolution of cold-rolled samples annealed at 700 °C plotted as a function of time (a, d) 10 s, (b, e) 900 s, and (c, f) 14,400 s (a, b, c) HRNA and (d, e, f) HRA.

The texture of the as-received sample, HRNA, illustrated by the ODF in Fig. 8(a), shows the discrete components of an α-fiber and a higher concentration of a rotated-cube component. It also shows the formation of the {332}〈113〉 component. The ODF for the HRA sample, Fig. 8(b), shows an increase in the intensity of the α-fiber and the marked appearance of a slightly shifted {112}〈110〉 component and no rotated-cube component. However, the {332}〈113〉 component is also noted.
The α-fiber was accentuated in the cold-rolled HRNA steel, highlighting the {112}〈110〉 and rotated-cube components, Figs. 9(a) and 10(a). It is quite different from the texture of the cold-rolled HRA. In this case [Figs. 9(b) and 10(b)], the α-fiber was reinforced with components {112}〈110〉 and the rotated-cube and γ-fiber components: {113}〈110〉 and {111}〈121〉 also appeared. A change here was the formation of the {554}〈225〉 component.
The cold-rolled HRNA and HRA samples series both showed the formation of cube-rotated {001}〈110〉 component, with greater intensity at the first series than the second. The grain orientation maps, Figs. 9(a) and 9(b), show the predominance of the grains oriented with the cube-rotated component in red. These were more predominant in the HRNA sample than in the HRA one. Many grains, shown in dark purple and blue, belong to the γ-fiber orientation.
The components of cold-rolled HRNA series [Figs. 10(a) and 10(b)] are the rotated cube, {112}〈110〉 and to a lesser extent {111}〈011〉. The HRA series has the rotated-cube, {223}〈110〉, and {113}〈110〉 components.
The microstructure evolution is shown in Figs. 11–13. The recrystallization was more advanced in the HRNA sample, Fig. 11(a), than in the HRA one, Fig. 11(b). This is because a part of the stored energy was consumed during hot band annealing in HRA samples, as shown in Figs. 12(a) and 12(b) when the steel was annealed for 900 s.
The HRNA and HRA samples were both fully recrystallized after annealing for 14,400 s, Figs. 13(a) and 13(b).
After complete recrystallization, Figs. 14(c) and 14(f), the texture predominantly consisted of the γ-fiber: {111}〈121〉 and the {554}〈225〉 components, which appeared more intense.
Figures 11–13 show that the HRNA and HRA samples predominantly contained the γ-fiber orientation {111}, shown in blue in the orientation maps. The HRNA sample showed a weaker orientation of the {111}〈121〉 and {554}〈225〉 components than the HRA series.
IV. DISCUSSION
The ODF of the HRNA sample annealed for 10 s [Fig. 14(a)] showed that the samples contained predominantly the α-fiber with a very intense {112}〈110〉 component. The rotated-cube component was less intense. The sample soaked for 900 s showed the {113}〈110〉, {111}〈121〉 γ-fiber, and rotated-cube components. The ODF of the HRA sample annealed for 10 s showed the rotated-cube component, and a very intense {112}〈110〉 component related to the α-fiber. The sample soaked for 900 s showed an offset {334}〈110〉 component. The intensity of the α-fiber weakened and the {111}〈011〉 component simultaneously appeared. The HRNA and HRA samples soaked and annealed for 14,400 s only showed the {111}〈121〉 and {554}〈225〉 fibers. The presence of the α-fiber is characteristic of body-centered cubic (bcc) workhardened metals, while that of the γ-fiber is characteristic of the corresponding annealed materials, i.e., it is formed during recrystallization. Reference Gao, Liu, Liu, Zang, Dong, Hao and Wang9,Reference Raabe21–Reference Zhang, Liu and Wang27
The Nb carbonitrides can act as pinning points that affect the growth of the recrystallized grains during the annealing causing the delay of recrystallization process. This pinning effect was observed in Fig. 6, since the grain diameter of both samples increased only of 3–7 µm after about 1000 and 10,000 s, respectively. Capdevila et al. Reference Capdevila, Amigó, Caballero, García de Andrés and Salvador32 observed that the presence of microalloying elements exert an indirect influence on the microstructure evolution through a change in the recrystallization texture.
According to Lewis and Pickering, Reference Lewis and Pickering1 Nb causes the formation of the {111} recrystallized component in cold-worked ferritic stainless steel reduced to 78% thickness. The major recrystallization texture in this steel, containing undissolved particles, was the {111}〈112〉 component at several reductions, and only a minor amount of the {110}〈001〉 texture was observed.
Electron microscopy showed that during the early stages of recrystallization, grains whose {111} planes were parallel to the rolling plane nucleated at matrix-Nb(CN) interfaces owing to the increased lattice curvature and the energy stored adjacent to the large undissolved Nb carbonitride particles. This is called particle-stimulated recrystallization at intragranular sites. Reference Siqueira, Sandim, Oliveira and Raabe33 Because the regions near large undeformable particles store a significant amount of energy, they produce effects similar to an increased cold reduction. Because the order of the energy stored within the textures remains mostly constant; namely, increasing from {100}〈011〉 throughout {110}〈001〉 to {111}〈uvw〉, the amount of energy stored in the {111} component is higher than that stored in the {100}(011) region near the particles and in the matrix generally. The {111}〈112〉 orientation can nucleate more easily within its parent orientation, and because of competition between the {111}〈112〉 and shear band nucleated {110}〈001〉 textures, resulting in the {111} component being almost as strong as in the cold-worked condition. The intensity of the {100} component, on the other hand, decreased relative to that of the {111} component because it had stored less energy. Reference Lewis and Pickering1,Reference Yantaç, Roberts and Wilson34 Raabe and Lücke Reference Raabe and Lücke20 showed that the nucleation was oriented in Nb-stabilized ferritic stainless steels when the high-angle grain boundary nuclei were anchored in Nb carbonitrides, growing with a preferred orientation (i.e., γ-fiber), which remained until the end of recrystallization.
During oriented growth, the newly oriented grains form and as the recrystallization progresses, they assume a new preferred orientation (i.e., a γ-fiber). Similar behavior had previously been observed by Lewis and Pickering. Reference Lewis and Pickering1 However, some authors Reference Huh and Engler2,Reference Maruma, Siyasiva and Stumpf8 have observed that instead of forming the {111}//ND γ-fiber texture typical of recrystallized low-carbon steel sheets, the recrystallization texture can be shifted toward the {334}〈483〉 component. For instance, an intermediate annealing during the cold rolling led to a weaker, more typical bcc rolling texture with less pronounced texture gradients. Reference Huh and Engler2 Accordingly, recrystallization nuclei rise to the characteristic γ-fiber texture primarily in the grain boundaries and within the shear bands of deformed grains. Reference Huh and Engler2 The highly misoriented bands formed during deformation exert direct influence in the final annealing texture. The recrystallization textures are also explained in terms of a preferred nucleation of recrystallization at the preexisting grain boundaries and the subsequent growth selection. Reference Huh and Engler2,Reference Gao, Liu, Liu, Zang, Dong, Hao and Wang9
The gradual increase in the ferritic grain size, changing the distribution of the mean diameter thereof, as shown in Fig. 6, is due to the nucleation and growth during recrystallization. The driving force for nucleation is the energy stored during plastic deformation, and that for grain growth is the energy associated with the grain contour, Reference Doherty, Hughes, Humphreys, Jonas, Jensen, Kassner, King, McNelley, McQueen and Rollet10–Reference Abbaschian, Abbaschian and Reed-Hill12 or the amount of energy required to reduce them. Verbeken et al. Reference Verbeken, Kestens and Jonas25 have studied the effect of the amount of cold deformation on the formation of the recrystallization texture of ULC steels. The texture evolution was analyzed while samples were soaked and cold rolled to 70 and 95% thickness. The nucleation texture was similar in both cases, characterized by the high-intensity γ-fiber. For all the samples deformed by 70%, the texture remained practically constant throughout annealing, indicating a nucleation orientation. However, when they applied severe rolling reduction (i.e., 95%) some specific components; namely, {554}〈225〉 and {113}〈471〉, appeared during the late stages of recrystallization. This coincided with the disappearance of the dominant, {112}〈110〉 γ-fiber component, which is also the finding in the present report. The authors Reference Verbeken, Kestens and Jonas25 and others Reference Huh and Engler2,Reference Maruma, Siyasiva and Stumpf8,Reference Yoshinaga, Vanderschueren, Kestens, Ushioda and Dilewijns24,Reference Yantaç, Roberts and Wilson34,Reference Park, Lee and Gottstein35 have described that the 〈110〉 26.5° misorientation relation between the disappearing deformation component and the two replacement annealing components indicates that selective growth accompanied by variant selection is the controlling mechanism for these changes in orientation. Reference Yoshinaga, Vanderschueren, Kestens, Ushioda and Dilewijns24,Reference Verbeken, Kestens and Jonas25
The cube-rotated component, characteristic of hot rolling, was present in the as-received and cold-rolled samples, and its intensity was greater in the HRNA series than in the HRA one. This component was more intense in the cold-rolled samples than in the as-supplied ones, indicating that it had been retained and was intensified during cold forming. The intensity of this component decreased during annealing until it completely disappeared. Reference Raabe and Lücke20,Reference Yantaç, Roberts and Wilson34 The lack of orientation uniformity in the IPF maps shows that the texture is originated from a combination of nucleation and growth-oriented mechanisms. Gao et al. Reference Gao, Liu, Liu, Zang, Dong, Hao and Wang9 showed similar finding, but the authors used IF (C = 0.0042% and N = 0.0060%) stainless steel and less Nb (0.20%).
Kestens et al. Reference Kestens and Jonas36 studied ULC steel and found that some conditions must be satisfied by the particular selective growth theory, regardless of the nature of the theory itself. They summarized the necessary conditions as follows. (i) Grains that are favored by growth selection must exhibit a larger-than-average diameter after growth. (ii) There must be a close correlation between the increasing intensities of the favored components and the decreasing intensities of the deformation components that are misoriented according to the rapid growth relation. (iii) The growth advantage of the selected component must be attributed to the selection mechanism and not to the size advantage at the start of the growth stage; i.e., early nucleation cannot be responsible for growth selection during the later stages of recrystallization. Reference Park, Lee and Gottstein35 Condition (i) corresponds to 900 s of soaking for the HRNA series, in which the {554}〈225〉 component was much more intense than in the HRA series. Both series also satisfied condition (ii); i.e., the {112}〈110〉 component, which appeared very intense for the samples annealed for 10 s, disappeared owing to the formation of the {111}〈121〉 γ-fiber and their own {554}〈225〉 components. Condition (iii) was satisfied once there was no {554}〈225〉 component in the cold-rolled texture and at the beginning of nucleation [Figs. 14(a) and 14(d)]. Yantaç et al. demonstrated the presence of the {554}〈225〉 component in low-Cr (13 wt%) stainless steel, but Nb was not used as a stabilizing element. Reference Yantaç, Roberts and Wilson34
According to Yazawa et al. Reference Yazawa, Ozaki, Kato and Furukimi3 ferritic stainless steel and low-carbon steels show a positive correlation between the {111} intensity and the average r-value. However, ferritic stainless steel shows higher r-values than mild steel at the same level of {111} intensity. The r-values of the ferritic steels are not determined by texture alone. Cr is assumed to limit some slip systems in bcc metals. Reference Yazawa, Ozaki, Kato and Furukimi3 The texture evolution showed a decrease in the intensity of the α-deformation fibers and an increase in the intensity of the γ-fibers with increasing annealing time. This is expected for the industrial applications of steel because the orientations pertaining to the γ-fiber, especially the {111}〈112〉 component, guarantee better performance in deep drawing; i.e., better formability and less tendency to form ridges during processing and application. Reference Gao, Liu, Liu, Zang, Dong, Hao and Wang9,Reference Zhang, Liu and Wang27
The orientation maps and ODF analysis clearly showed that annealing the hot-rolled HRA samples did not ensure a more uniform γ-fiber than the one in the HRNA samples. Although annealing the hot-rolled samples gave a more homogeneous microstructure, grain size, and precipitate distribution, it did not guarantee that the ferritic recrystallization texture would be more intense after the complete thermomechanical cycle. Thus, according to the results reported, annealing the hot-rolled, laboratory-processed samples to decrease the α-fiber intensity and increase the γ-fiber intensity was quite effective for the samples taken from hot-rolled strip and resulted in good behavior during deep drawing.
V. CONCLUSIONS
The recrystallization texture of both the HRA and HRNA samples was similar, characterized by the presence of γ-fibers. The ODF analysis showed that the HRNA and HRA samples contained the {554}〈225〉 component, suggesting that the texture is originated from a combination of nucleation and growth-oriented mechanisms. Despite a marked difference in the supply conditions, the texture was formed mainly owing to cold rolling and subsequent isothermal annealing, at 700 °C in the present work. The initial microstructure of the milled hot strips was refined using cold deformation and annealing. The diameter of the stainless steel grains decreased from about 30 to 8 µm. The intensity of the γ-fiber increased and that of the deformation α-fiber decreased as the recrystallization proceeded. The HRNA and HRA both showed similar nucleation texture characterized by the presence of γ-fibers.
Annealing the hot-rolled samples provided greater homogeneity in the microstructure and distribution of the Nb precipitates before cold rolling and annealing, but it did not guarantee a more intense γ-fiber. An α-fiber and a strong rotated-cube component were formed in the hot band microstructure of the hot- (warm-) rolled samples, and the components were weakened after hot band annealing. The texture of the cold-rolled samples consisted of a sharp α-fiber whose major components were at {112}〈110〉 and {111}〈110〉, and a nonuniform γ-fiber developed during the late stages of recrystallization. The texture of the annealed cold-rolled samples, on the other hand, was dominated by a weakened α-fiber and a γ-fiber sharpened in the hot-rolled band.
One important result from the present paper is that there was a notable difference between the intensity distributions of the early nucleation and full recrystallization textures. In addition, {554}〈225〉 texture component, which are associated with the largest grains or long annealing times, appeared during the late stages of recrystallization.
The value of the Avrami exponent cannot be used to differentiate the initial nucleation type, i.e., the deformation bands. The n values calculated from the JMAK model (between 0.8 and 1.2) were consistent with those previously reported in the literature, indicating a preferential nucleation on the grain boundary. However, these results do not indicate a preferential nucleation on the shear bands.
ACKNOWLEDGMENTS
The authors thank CAPES-PROEX, FAPEMIG and CNPq for research fellowships and masters made available to students and for their financial support. We also thank the company Aperam South America SA for providing the ferritic stainless steel samples.