


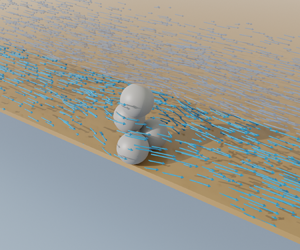





1. Introduction
Particle clogging can be observed in scenarios from dry gravity-driven flows through silos and hoppers (To, Lai & Pak Reference To, Lai and Pak2001; Zuriguel et al. Reference Zuriguel, Garcimartín, Maza, Pugnaloni and Pastor2005), to hydrodynamic fluid-driven flows in bloodstreams (Kang, Kim & Kim Reference Kang, Kim and Kim2018) and porous media (Valdes & Santamarina Reference Valdes and Santamarina2006; Tran, Civan & Robb Reference Tran, Civan and Robb2009), and even in systems such as crowd evacuation (Garcimartın et al. Reference Garcimartın, Parisi, Pastor, Martın-Gómez and Zuriguel2016). Clogging is defined as the ceasing of flow through a constriction, which propagates from the local formation of static arches of particles (Zuriguel & Garcimartín Reference Zuriguel and Garcimartín2020). It should not be confused with jamming, which describes the flow of an assembly of particles transitioning from a fluid-like state to a solid-like state (Nguyen, Reichhardt & Reichhardt Reference Nguyen, Reichhardt and Reichhardt2017; Péter et al. Reference Péter, Libál, Reichhardt and Reichhardt2018). Constrictions that cause clogging can be any shape. Even straight channels can develop clogging if they have sufficient surface roughness (STIM-LAB, Inc. 1995; Sharp & Adrian Reference Sharp and Adrian2005) or contain arrays of obstacles (Nguyen et al. Reference Nguyen, Reichhardt and Reichhardt2017; Chen, Ho-Minh & Tan Reference Chen, Ho-Minh and Tan2018).
Both dry (To et al. Reference To, Lai and Pak2001; Zuriguel et al. Reference Zuriguel, Garcimartín, Maza, Pugnaloni and Pastor2005) and hydrodynamic (Lafond et al. Reference Lafond, Gilmer, Koh, Sloan, Wu and Sum2013; Marin et al. Reference Marin, Lhuissier, Rossi and Kähler2018; López et al. Reference López, Hernández-Delfin, Hidalgo, Maza and Zuriguel2020) clogging can be modelled as Poisson processes. That is, as particles flow through a constriction, the probability of forming a stable arch can be assumed to be the same at every point in time, such that clogging occurs independently of the flow history. In this way, the time to a clogging event exhibits an exponential probability distribution. In the case of dry clogging, this memory independence originates from the innumerable particle collisions that occur at the densely packed clogging condition. In hydrodynamic clogging, on the other hand, particles can be transported at dilute solid volume fractions, and the independence arises from the low frequency of collisions (Marin et al. Reference Marin, Lhuissier, Rossi and Kähler2018). This independence does not disappear for high solid volume fractions; however, jamming and clogging become increasingly connected phenomena (López et al. Reference López, Hernández-Delfin, Hidalgo, Maza and Zuriguel2020). For a comprehensive review of the stochastic nature of clogging in general, the reader is referred to Zuriguel & Garcimartín (Reference Zuriguel and Garcimartín2020).
Fundamentally, the problem of hydrodynamic clogging can therefore be described as the probability of the number of particles required to form a stable arch configuration, n, coming into contact within a sufficiently short interval of time (Ramachandran & Fogler Reference Ramachandran and Fogler1999; Sharp & Adrian Reference Sharp and Adrian2005; Dressaire & Sauret Reference Dressaire and Sauret2017). Indeed, stochastic models have been developed based on this reasoning (Lafond et al. Reference Lafond, Gilmer, Koh, Sloan, Wu and Sum2013; Marin et al. Reference Marin, Lhuissier, Rossi and Kähler2018). The following review of the literature should be interpreted within the context of this fundamental description.
Foremost consideration must be given to the type of arch configurations and their stability. In a stable arch, the normal and tangential contact forces, which are induced by the hydrodynamic forces, remain in static equilibrium, as depicted in figure 1. The stability of an arch configuration is predetermined by the possible angles between the particles (Zuriguel & Garcimartín Reference Zuriguel and Garcimartín2020), which are in turn determined by the channel width. Moreover, a larger friction coefficient increases the range of contact angles and therefore increases  $P$ (To et al. Reference To, Lai and Pak2001; Guariguata et al. Reference Guariguata, Pascall, Gilmer, Sum, Sloan, Koh and Wu2012; Garagash, Osiptsov & Boronin Reference Garagash, Osiptsov and Boronin2019).
Schematic representations of possible (a) two-particle and (b) three-particle arch configurations in two dimensions, where the angle  $\theta$ describes relative particle positions. The small arrows indicate contact forces, and the large arrows indicate the direction of flow.

Hydrodynamic clogging has been studied in three dimensions for both constrictions and straight channels of circular, square and planar cross-sections; however, the vast majority of the literature is concerned with constrictions only. For straight channels, limited works (STIM-LAB, Inc. 1995; Sharp & Adrian Reference Sharp and Adrian2005) have observed dilute hydrodynamic clogging, where the surface must be sufficiently rough to cause the particle retardation required for arching (Barree & Conway Reference Barree and Conway2001; Ray et al. Reference Ray, Lewis, Martysevich, Shetty, Walters, Bai and Ma2017). The characteristic width,  $w$, of either a constriction or a channel is representative of the cross-sectional diameter (circular) or width (square, planar). Although in theory there does not exist a threshold of
 $w$ at which clogging begins to occur (i.e. clogging will occur at any width given sufficient time), there is a maximum
 $w$ for which the probability is observable (Koivisto & Durian Reference Koivisto and Durian2017). This is represented typically by the critical ratio of channel width to nominal particle diameter,
 $w/d^*$. For dry granular flows,
 $w/d^* \approx 5\unicode{x2013}8$ has been observed (To Reference To2005; Zuriguel et al. Reference Zuriguel, Garcimartín, Maza, Pugnaloni and Pastor2005); however, as the friction coefficient decreases,
 $w/d^*$ also decreases (To et al. Reference To, Lai and Pak2001; To Reference To2005). For constrictions, dilute hydrodynamic clogging of spherical particles has been observed frequently for cases
 $1< w/d<2$ and
 $2< w/d<3$, both experimentally (Ramachandran & Fogler Reference Ramachandran and Fogler1999; Valdes & Santamarina Reference Valdes and Santamarina2006; Tran et al. Reference Tran, Civan and Robb2009; Lafond et al. Reference Lafond, Gilmer, Koh, Sloan, Wu and Sum2013; Marin et al. Reference Marin, Lhuissier, Rossi and Kähler2018) and numerically (Mondal, Wu & Sharma Reference Mondal, Wu and Sharma2016; Sun et al. Reference Sun, Xu, Pan, Shi, Geng and Cai2019; Li et al. Reference Li, Qiu, Zhong, Zhao and Huang2020; Xu et al. Reference Xu, Sun, Cai and Geng2020). However,
 $w/d^*=4$ has also been observed experimentally in two (Guariguata et al. Reference Guariguata, Pascall, Gilmer, Sum, Sloan, Koh and Wu2012) and three (Liu, Zhao & Santamarina Reference Liu, Zhao and Santamarina2019) dimensions. Recently, an experimental study that investigated the transition from clogging to jamming for high bulk solid volume fractions (
 $\bar {\phi }=0.5$) in vertical straight pipes reported discontinuous regions of clogging in relation to
 $w/d$, where clogging occurred for
 $w/d \approx 2$ and
 $2.7 < w/d <3$, but not in the ranges
 $2 < w/d < 2.7$ and
 $3 < w/d$ (López et al. Reference López, Hernández-Delfin, Hidalgo, Maza and Zuriguel2020).
An additional consideration in clogging is the number of particles that can compose an arch,  $n$. For hydrodynamic clogging, in principle, as
 $n$ increases, the arch becomes more stable, such that the range of
 $\theta _s$ is maximised, but the probability of the
 $n$ particles coming into contact within the required time interval diminishes. While an analytical model for planar channel arching has assumed the case
 $n=5$ (Garagash et al. Reference Garagash, Osiptsov and Boronin2019), the possible
 $n$ for planar channels has not been defined by observation.
Moving on to the dynamics of hydrodynamic clogging, its effects and implications are either implicitly assumed in the literature, or otherwise not considered in analyses. The following analysis will therefore clarify its dynamic aspects, recalling that  $P$ depends fundamentally on the required number of particles for a stable arch configuration, n, coming into contact within a sufficiently short interval of time. With this in mind,
 $P$ must increase in proportion to the frequency of particle collisions, which in turn increases proportionally with
 $\bar {\phi }$ and the mean suspension velocity,
 $\langle v \rangle$. As
 $\langle v \rangle$ increases, however, so does the hydrodynamic force acting on the arches and its fluctuations, meaning that particles are less likely to remain in a stable arch configuration. As
 $\langle v \rangle$ changes, the collision frequency and arch stability are therefore competing effects that have opposing influences on
 $P$. Studies of clogging at constrictions generally show that
 $P$ increases with increasing
 $\langle v \rangle$ (Dai & Grace Reference Dai and Grace2010; Mondal et al. Reference Mondal, Wu and Sharma2016; Sun et al. Reference Sun, Xu, Pan, Shi, Geng and Cai2019; Li et al. Reference Li, Qiu, Zhong, Zhao and Huang2020). This dependence, however, has been attributed to the increasing collision frequency only, neglecting the role of velocity on decreasing arch stability. A more suitable conclusion would be that the effect of the collision frequency dominates that of the arch stability.
In considering non-Brownian particles at the micron scale, electrostatic phenomena induce long-range attractive and repulsive physicochemical forces between bodies, which become significant relative to hydrodynamic forces, and modify the clogging mechanics discussed thus far. These forces and their implementation in the present work are described in detail in § 2.1; however, in general, their sum can be attractive or repulsive depending on the separation distance. In the majority of cases there exists an attractive force minimum, resulting in both particle–particle and particle–surface attachment (Mitchell & Leonardi Reference Mitchell and Leonardi2016; Huang et al. Reference Huang, Kang, You, You and Xu2017; Chequer et al. Reference Chequer, Carageorgos, Naby, Hussaini, Lee and Bedrikovetsky2021). In particular, this surface attachment causes particles to deposit at surface asperities, resulting in higher  $w/d^*$ and
 $P$ (Sendekie & Bacchin Reference Sendekie and Bacchin2016; Kang et al. Reference Kang, Kim and Kim2018). Moreover,
 $P$ decreases with increasing
 $\langle v \rangle$ because this particle attachment is reduced in frequency (Liu et al. Reference Liu, Zhao and Santamarina2019; Trofa et al. Reference Trofa, D'Avino, Sicignano, Tomaiuolo, Greco, Maffettone and Guido2019). If the electrostatic interaction is strong enough, then the effect of decreasing aggregate stability can override that of collision frequency (Ramachandran & Fogler Reference Ramachandran and Fogler1999), which is the opposite of what is observed in the purely mechanical cases in the literature.
In this study, dilute hydrodynamic clogging in planar channels is investigated using computational fluid dynamics (CFD) for the first time. The novel test cell effectively comprises a series of (small) constrictions and therefore mimics a planar channel with long-wavelength roughness. A number of planar channel clogging behaviours are investigated, including critical channel widths, arch configurations, and the dynamic relationship between collision frequency and arch stability. Electrostatics is incorporated into an existing numerical framework for particle suspensions, and the influence of a number of non-dimensional parameters on the clogging probability of micron-sized particles is investigated both with and without electrostatics.
This paper is structured as follows. In § 2 the inclusion of electrostatics in an existing numerical framework is outlined, with a particular focus on contact modelling and the model's verification. The methodology is described in § 3, which includes the numerical test cell, associated studies of domain dependence and electrostatic surface attachment, and considerations for determining the clogging probability. Next, in § 4, the results are presented and analysed in separate mechanical and electrostatic subsections, along with a description of the stochastic methodology that is used to interpret the results. The conclusions of the work are finally drawn in § 5.
2. Numerical model
In order to investigate hydrodynamic clogging in planar channels, including the influence of the physicochemical phenomena that must be considered for micro-particles, a coupled lattice Boltzmann method-discrete element method (LBM–DEM) model that was developed and validated in prior work (Di Vaira et al. Reference Di Vaira, Łaniewski Wołłk, Johnson, Aminossadati and Leonardi2022) is extended to incorporate electrostatics. Here, the electrostatic and fluid–solid coupling aspects of the numerical model are established first, followed by verification of contact modelling and the electrostatic implementation.
2.1. Electrostatics
At the micro-particle scale, physicochemical forces become significant relative to hydrodynamic forces. Derjaguin–Landau–Verwey–Overbeek (DLVO) theory (Derjaguin & Landau Reference Derjaguin and Landau1941; Verwey & Overbeek Reference Verwey and Overbeek1948) is applied ubiquitously to describe these forces for solid objects interacting in a fluid medium, with its physical validity down to separation distances approximately  $0.1\times 10^{-9}\ {\rm m}$ proven extensively (Israelachvili Reference Israelachvili2011b). DLVO theory states that the total electrostatic potential,
 $V_{e}$, is the superposition of the attractive London–van der Waals (LvdW) potential,
 $V_{LvdW}$, the repulsive electric double layer (EDL) potential,
 $V_{EDL}$, and the repulsive Born potential,
 $V_{BR}$:
 \begin{equation} V_{e} = V_{LvdW} + V_{EDL} + V_{BR}. \end{equation}
In the present work, these potentials are resolved fully according to their analytical expressions, as opposed to a simplified cohesion force model (Vowinckel et al. Reference Vowinckel, Withers, Luzzatto-Fegiz and Meiburg2019), and are incorporated directly into the DEM as forces, as outlined in § 2.2. The primary advantage of this direct numerical simulation (DNS) approach over a simplified model is that it remains physically valid down to the physical limit of Brownian motion (i.e. particle sizes approximately  ${1}\ {\mathrm {\mu }}{\rm m}$, depending on flow conditions). The remainder of this section presents the analytical DLVO forces and parameters employed in this work, and then analyses the physical attributes of these DLVO systems.
The LvdW potential arises when atomic dipole forces, which are weak individually, interact simultaneously between two macroscopic bodies. In a typical system where two different materials interact in a fluid medium, the interaction strength is quantified by the system Hamaker constant,  $A_{132}$, which is calculated from the individual vacuum Hamaker constants of the interacting materials (Khilar & Fogler Reference Khilar and Fogler1998). In this work, subscript 1 denotes the particles, subscript 2 denotes the channel surface, and subscript 3 denotes the fluid. Accordingly, the LvdW interaction force between a sphere (particle) of diameter,
 $d$, and a flat wall, separated by a distance,
 $\zeta$, depends on
 $A_{132}$ (Hamaker Reference Hamaker1937),
 \begin{equation} F_{LvdW,p-w} ={-}\frac{A_{132}}{12}\,\frac{d^3}{(\zeta+d)^2\zeta^2}, \end{equation}
where the negative sign signifies attraction in keeping with convention. Similarly, the interaction force between two spheres (particles) is described by  $A_{131}$,
 \begin{equation} F_{LvdW,p-p} ={-}\frac{A_{131}}{6}\,\frac{d^6}{\left((d+\zeta)^2-d^2\right)^2(d+\zeta)^3}. \end{equation}
It is noted that (2.3) is obtained by differentiating the original expression for potential  $V_{LvdW}$ (Hamaker Reference Hamaker1937) with respect to
 $\zeta$, while (2.2) is obtained by additionally taking the limit of
 $V_{LvdW}$ as the diameter of one sphere approaches infinity. In this work,
 $A_{132}$ and
 $A_{131}$ are the only electrostatic parameters that are varied. Four distinct values are used in this work (presented in table 1), which represent a wide range of materials (Ackler, French & Chiang Reference Ackler, French and Chiang1996; Israelachvili Reference Israelachvili2011a).
The electrostatic parameters and their values employed in this study, with resulting maximum adhesion forces  $F_{a,p-w}$ and
 $F_{a,p-p}$. The physical values presented here are intended to provide an understanding of how
 $F_{a,p-w}$ and
 $F_{a,p-p}$ originate; however, all results are subsequently presented in terms of the non-dimensional parameters
 $Ad_w$ and
 $Ad_p$ (see (2.6) and (2.7)).

Two separate potentials,  $V_{EDL}$ and
 $V_{BR}$, both of which arise due to the dissociation of ions within a fluid, act to oppose the attractive LvdW potential. Here, their origins and force equations are summarised. However, for an in-depth description of the electrostatic potentials that arise in liquids, the interested reader is referred to Israelachvili (Reference Israelachvili2011b). The surface of a solid object becomes negatively charged via a chemical process when submerged in a liquid. The surface then attracts a cloud of dissociated counter-ions, referred to as the EDL, some of which are bound to the surface in what is known as the Stern layer.
When the ion clouds of two surfaces overlap, they mutually repulse, which is the origin of the EDL potential. The decay of this repulsive energy with  $\zeta$ is governed chiefly by the characteristic length of the EDL, known as the inverse Debye length,
 $\kappa$, and scales with the absolute fluid permittivity,
 $\varepsilon$, surface potential,
 $\psi$, and
 $d$. In this work, a simplification of the EDL force when
 $\psi \lesssim {25}\ {\rm mV}$ is employed for two identical spheres,
 \begin{equation} F_{EDL,p-p} = {\rm \pi}\,{d} \varepsilon \kappa \psi^2\,{\rm e}^{-\kappa \zeta}, \end{equation}
and a sphere and a flat wall,
 \begin{equation} F_{EDL,p-w} = 2{\rm \pi} \,{d} \varepsilon \kappa \psi^2\,{\rm e}^{-\kappa \zeta}, \end{equation}
noting that these lose accuracy for  $\zeta < 1/\kappa$ but are useful for efficiently describing a wide variety of situations (Israelachvili Reference Israelachvili2011b). The Debye length depends on the type of electrolyte and the molar concentration of dissolved salt,
 $C_m$. For NaCl solutions,
 $\kappa = 0.73\times 10^{8}\ {\rm m}^{-1}\,\sqrt {1\ {\rm m}^{3}\ {\rm mol}^{-1}\times C_mz^2}$ and
 $z=1$. All EDL parameters used in this work are held constant at the values indicated in table 1.
The short-range Born repulsion arises due to the atomic repulsion of the surface ions residing in two objects’ Stern layers. This short-range atomic repulsion prevents  $F_{LvdW}$ from reaching infinity, instead creating the primary attractive force minimum that is characteristic of electrostatic systems under most conditions. The hard-sphere approximation assumes that the electrostatic force is immediately cut off at some minimum atomic separation and is a common choice for attenuating
 $F_{LvdW}$ in numerical simulations (Mitchell & Leonardi Reference Mitchell and Leonardi2016; Lohaus, Perez & Wessling Reference Lohaus, Perez and Wessling2018; Vowinckel et al. Reference Vowinckel, Withers, Luzzatto-Fegiz and Meiburg2019). A more realistic approximation applies the assumption of pairwise additivity to integrate the repulsive potential of two macroscopic bodies, similar to Hamaker's derivation of the LvdW potential (Feke et al. Reference Feke, Prabhu, Adin Mann and Adin Mann1984). This results in a gradual increase of the Born repulsion with decreasing separation distance. The complete expression for the Born potential obtained from pairwise integration can be found in Feke et al. (Reference Feke, Prabhu, Adin Mann and Adin Mann1984), but is not included here for brevity. In this work, the approach of Feke et al. (Reference Feke, Prabhu, Adin Mann and Adin Mann1984) is applied with a moderate hardness scaling
 $F_{BR} \propto \zeta ^{-6}$ and Stern layer thickness
 $\sigma =0.5\times 10^{-9}\ {\rm m}$.
A difficulty arises when quantifying DLVO forces for physical systems, namely, that the origin of the EDL force is at the surfaces of the counter-ions in the Stern layer, whereas the LvdW force is measured from the centre of the co-ions within the surface of the object (Israelachvili Reference Israelachvili2011b). The resulting force profiles are highly sensitive to these origins, and shifts of just  $0.2\times 10^{-9}\ {\rm m}$ in the EDL force can completely eliminate the primary minimum. As discussed in § 2.2, the macroscopic frictional response of the system is highly sensitive to the normal and tangential particle contact forces. Consequently, clogging results depend strongly on the way that electrostatics is treated at contact. In this work, electrostatics at contact is treated by selecting a separation distance
 $\zeta /\sigma =0.6$ from which the electrostatic force is decreased linearly to
 $F_e=0$ at
 $\zeta =0$, and maintained at
 $F_e=0$ for
 $\zeta \leqslant 0$. This distance is within the primary minimum and is commensurate with minimum contact distances reported in the literature (Visser Reference Visser1995; Israelachvili Reference Israelachvili2011a). In this way, there is no electrostatic force acting when two computational surfaces overlap, which helps to resolve soft-sphere collision accurately in the DEM outlined in § 2.2. Quantifying the uncertainty of the macroscopic friction to this treatment of electrostatics, as well as other contributing factors, is discussed in detail in § 2.2.
The variation of the net electrostatic force,  $F_e = F_{LvdW} + F_{EDL} + F_{BR}$, with respect to separation distance determines whether conditions are favourable or unfavourable for particle–particle and particle–wall attachment. As outlined in § 1, particle–wall attachment in particular has a key influence on clogging (Sendekie & Bacchin Reference Sendekie and Bacchin2016; Kang et al. Reference Kang, Kim and Kim2018) and the behaviour of electrostatic systems in general (Elimelech et al. Reference Elimelech, Gregory, Jia and Williams1995; Khilar & Fogler Reference Khilar and Fogler1998; Israelachvili Reference Israelachvili2011b; Chequer et al. Reference Chequer, Carageorgos, Naby, Hussaini, Lee and Bedrikovetsky2021). One of the primary aims of this work is to therefore determine how particle–wall attachment, and to a lesser degree particle–particle attachment, affect planar channel clogging. The values that influence these primarily are, respectively, the maximum particle–wall adhesion force,
 $F_{a,{p-w}}$, and the maximum particle–particle adhesion force,
 $F_{a,{p-p}}$. To quantify the strength of these adhesion forces in relation to the hydrodynamic drag force, two non-dimensional adhesion numbers are defined, one for particle–wall adhesion,
 \begin{equation} Ad_w=\frac{F_{a,{p-w}}}{3{\rm \pi}\rho_f\nu d \langle v \rangle}, \end{equation}
and the other for particle–particle adhesion,
 \begin{equation} Ad_p=\frac{F_{a,{p-p}}}{3{\rm \pi}\rho_f\nu d \langle v \rangle}, \end{equation}
where  $\rho _f$ and
 $\nu$ are the fluid density and kinematic viscosity, respectively, and
 $\langle v \rangle = Gw^2/(12\rho _f\nu )$ is the superficial mean channel velocity (based on momentum conservation of a pure fluid in a planar channel, where
 $G$ is the applied fluid pressure gradient).
Figure 2 plots the force profiles for the two particle–particle Hamaker constants and four particle–wall Hamaker constants employed in this work, for a representative physical particle size  $d={5}\ {\mathrm {\mu }}{\rm m}$. Noting that
 $F_e$ scales linearly with
 $d$, the range of physical particle sizes and Hamaker constants in this work results in a range of
 $F_{a,{p-w}}$ and
 $F_{a,{p-p}}$ values, which are presented in table 1. The physical values presented in this section are intended to provide the reader with an understanding of where the electrostatic forces originate; however, it is emphasised that the results in § 4 are presented in terms of only the non-dimensional quantities
 $Ad_w$ and
 $Ad_p$ for complete generalisation. For all parameter combinations, however, the primary minimum of the DLVO potential is attractive, corresponding to points of zero force on the force profiles, and also resulting in an attractive force minimum for all. This means that particles will remain attached to a surface when trapped within the potential minimum, unless acted on by a sufficiently large external force. There also exists a repulsive barrier in the potential past the primary minimum, which prevents particles from attaching in the primary minimum unless acted on by a sufficiently large external force. Instead, they can become trapped in the significantly weaker secondary minimum, leading to rolling or sliding along the surface rather than attachment at asperities (Chequer et al. Reference Chequer, Carageorgos, Naby, Hussaini, Lee and Bedrikovetsky2021). The magnitude of the energy barrier is influenced strongly by the fluid salinity; however, here
 $C_m$ is held constant for the aforementioned reasons.
Profiles of the total electrostatic force,  $F_e$, with respect to the separation distance
 $\zeta$ for the two
 $A_{131}$ and four
 $A_{132}$ used in this work. An example physical particle size
 $d={5}\ {\mathrm {\mu }}{\rm m}$ is used; however, the primary force minima remain attractive (
 $Ad_w$ and
 $Ad_p$ remain positive) for all
 $d$ tested in this work since
 $F_e$ scales linearly with
 $d$. (a,b) Close-range interactions (small
 $\zeta$) to illustrate the maximum adhesion force for particle–particle,
 $F_{a,{p-p}}$, and particle–wall,
 $F_{a,{p-p}}$, interactions, respectively. (c,d) Long-range interactions (large
 $\zeta$) to illustrate the secondary force minimum for particle–particle and particle–wall interactions, respectively. Note the significant difference in magnitude between the
 $F_e$ axis scales, indicating the significantly lower magnitude of the secondary minimum.

2.2. Fluid–solid coupling
To explicitly capture the mechanical and physicochemical forces acting on each particle, the DEM is employed in this work. Through the open-source DEM granular media solver LIGGGHTS (Kloss et al. Reference Kloss, Goniva, Hager, Amberger and Pirker2012), the movement of each solid particle is updated at each discrete time step according to a velocity Verlet integration of Newton's second law of motion. The equations of motion of particle  $A$ are
 \begin{equation} \left.\begin{gathered} m_A\,\frac{{\rm d}\boldsymbol{u}_A}{{\rm d}t} = \sum_{B, \zeta<0}\left(\boldsymbol{F}_{c,AB}\right) + \sum_{C, 0<\zeta<\zeta_c}\left(\boldsymbol{F}_{e,AC}\right) + \boldsymbol{F}_{h,A},\\ I_A\,\frac{{\rm d}\boldsymbol{\omega}_A}{{\rm d}t} = \sum_{B, \zeta<0}\left(\frac{d}{2}\,\boldsymbol{n} \times \boldsymbol{F}_{c,AB}\right), \end{gathered}\right\}\end{equation}
where  $B$ therefore represents the set of all particles and walls in contact with particle
 $A$ (
 $\zeta <0$), and
 $C$ represents the set of all particles and walls within the electrostatic cutoff distance
 $\zeta _c$, but not in contact (
 $0<\zeta <\zeta _c$). Hence
 $\boldsymbol {F}_{c,AB}$ accounts for each collision force,
 $\boldsymbol {F}_{e,AC}$ accounts for electrostatic interactions and
 $\boldsymbol {F}_{h,A}$ accounts for hydrodynamic force.
The LvdW, EDL and Born forces are implemented as separate forces in the DEM, but are written in (2.8) as a total electrostatic force. The cutoff distance, which is incorporated to reduce computational load, is set to  $\zeta _c=100\times 10^{-9} \textrm {m}$, at which point
 $\boldsymbol {F}_{e,AC}$ reduces to approximately
 $10^{-5}$ of its maximum value in all cases, as shown in figure 2. Here, this ‘outer’ cutoff distance is distinguished from the ‘inner’ treatment of electrostatics at contact. As described in § 2.1, the latter linearly decreases
 $\boldsymbol {F}_{e,AC}$ to 0 at contact from an ‘inner’ distance
 $\zeta /\sigma =0.6$, so as to not interfere with contact force calculations.
The collision force can be further decomposed into the normal and tangential forces,  $\boldsymbol {F}_{c,AB} = \boldsymbol {F}_n + \boldsymbol {F}_t$, which are resolved via a nonlinear soft-sphere Hertz contact model. Each comprises a stiffness term subtracted from a damping term, which are nonlinearly dependent on the overlap and relative velocity of two bodies, respectively, for which full expressions can be found in Kloss et al. (Reference Kloss, Goniva, Hager, Amberger and Pirker2012). The terms are also dependent on the Young's modulus, Poisson ratio and coefficient of restitution, which are set to values
 $5\times 10^{6}$, 0.5 and 0.8, respectively. In § 2.3, it is verified that the collision model and parameter values reproduce the correct contact behaviour.
As outlined in § 1, friction has a strong influence on arch stability and consequently on the clogging probability. Its numerical implementation is therefore important and requires close attention. In this work, friction is implemented for both particle–particle and particle–wall collisions via the Coulomb friction law,
 \begin{equation} \boldsymbol{F}_t \leqslant \mu \boldsymbol{F}_n, \end{equation}
where  $\boldsymbol {F}_t$ is truncated according to the microscopic Coulomb friction coefficient,
 $\mu$. This microscopic friction coefficient is not equivalent to the macroscopic friction coefficient of the bulk medium, but is a numerical tool used to reproduce it. The macroscopic frictional response of the medium is a property of the system as a whole, and is achieved through resolution of both the normal and tangential forces in all particle contacts in the DEM. The coefficient
 $\mu$ impacts the latter directly, and therefore the bulk friction.
It is noted that particles are able to roll freely along surfaces, and that rolling friction is not included in this implementation. This is reflected in the absence of an additional torque component in (2.8), as opposed to more sophisticated models that distinguish between rolling and sliding. More complex friction models, however, introduce additional numerical parameters that require calibration to experimental data (Syed, Tekeste & White Reference Syed, Tekeste and White2017). This would be in addition to other numerical parameters including the electrostatic inner cutoff distance (introduced in § 2.1) and the lubrication inner cutoff distance (discussed in detail in § 2.3). In general, this type of rigorous calibration would require comparison to experiments of bulk properties, such as rheology or pressure drop in a confined channel, which consider electrostatics and surface roughness as parameters. However, to the best of the authors’ knowledge, such data have not yet appeared in the literature. To circumvent this problem, this work instead opts for a friction model with only one parameter ( $\mu$) and performs a sensitivity analysis with respect to this parameter. Throughout this work,
 $\mu =1$, which represents a high roughness and particle irregularity, but has the advantage of producing clogging in the majority of cases. In the sensitivity analyses, it is reduced to
 $\mu =0.2$. For simplification,
 $\mu$ is set equal for particle–particle and particle–wall collisions.
Finally, the hydrodynamic force contribution from the suspending fluid,  $\boldsymbol {F}_{h,A}$, is resolved using a previously described numerical framework (Di Vaira et al. Reference Di Vaira, Łaniewski Wołłk, Johnson, Aminossadati and Leonardi2022) that couples a single-relaxation-time LBM with the DEM via the partially saturated method (PSM) (Noble & Torczynski Reference Noble and Torczynski1998), using the open-source LBM code-base TCLB (Łaniewski-Wołłk & Rokicki Reference Łaniewski-Wołłk and Rokicki2016). Hydrodynamic torque is not applied to particles in order to reduce computational complexity. The primary effect of hydrodynamic torque would be to decrease arch stability, just as the inclusion of rolling torque would increase arch stability. Therefore, also like the decision to not include rolling friction in favour of computational simplicity, hydrodynamic torque is treated as an additional calibration parameter that is accounted for in the sensitivity analysis to
 $\mu$. While it would also influence surface attachment, § 3.4 demonstrates that the numerical simplifications and geometry reproduce valid critical attachment velocities.
The LBM is employed in this work for two primary reasons. First, the PSM can resolve exactly the momentum exchange between fluids and particles (within the numerical accuracy of the LBM), including when the gap between solid boundaries is less than one lattice spacing (Strack & Cook Reference Strack and Cook2007). While there also exist other methods of particle-resolved DNS, past studies of hydrodynamic particle clogging have applied only classical finite element CFD methods that approximate the solid boundary momentum coupling with drag force correlations (Sun et al. Reference Sun, Xu, Pan, Shi, Geng and Cai2019), the more complex fictitious domain method (Mondal et al. Reference Mondal, Wu and Sharma2016), or a simplified two-fluid Eulerian–Eulerian approach (Li et al. Reference Li, Qiu, Zhong, Zhao and Huang2020). Second, the LBM uses a local and explicit time-stepping scheme that retains the properties of implicit integration (Łaniewski-Wołłk Reference Łaniewski-Wołłk2017), increasing the ease and efficiency of parallel computation on CPU and GPU architectures compared to finite element methods.
Throughout this work, a kinematic LBM lattice viscosity  $\nu ^*=1/6$ is used, and the LBM grid spacing,
 $\delta _x$, is set such that the particle diameters are represented by ten lattice nodes,
 $d/\delta _x=10$. A number of DEM sub-iterations,
 $n_{sub}$, may be computed for every LBM iteration, depending on the time resolution required to capture electrostatic forces during a particle rebound. This issue is explored in detail in § 2.3, along with other important considerations of contact modelling. For a general discussion of the numerical error and stability associated with the spatial and temporal discretisation of this LBM–DEM implementation, the reader is referred to the earlier works of Di Vaira et al. (Reference Di Vaira, Łaniewski Wołłk, Johnson, Aminossadati and Leonardi2022) and Han, Feng & Owen (Reference Han, Feng and Owen2007).
2.3. Verification
The accuracy of fluid–solid momentum exchange for the PSM is well established (Noble & Torczynski Reference Noble and Torczynski1998; Strack & Cook Reference Strack and Cook2007; Owen, Leonardi & Feng Reference Owen, Leonardi and Feng2011), while validation of the present implementation, including second-order convergence and bulk suspension behaviour in channel flows, has been demonstrated previously (Di Vaira et al. Reference Di Vaira, Łaniewski Wołłk, Johnson, Aminossadati and Leonardi2022). As described in § 1, however, hydrodynamic clogging is fundamentally dependent on the formation of arches and electrostatic attachment, both of which depend on individual particle contacts and the interplay of hydrodynamic and electrostatic forces. Specifically, the coupled LBM–DEM model must correctly resolve: particle collisions according to the rebound regime; short-range hydrodynamics; the dynamics of electrostatic–hydrodynamic forces near contact; and electrostatic forces as two surfaces separate.
First, the degree of rebound of a particle is dictated by the Stokes number,  $St$, which may be interpreted as the ratio of the particle inertia to fluid viscous effects. Below a critical Stokes number,
 $St_{cr}$, approximately 10–15, viscous dissipation is large enough such that no rebound occurs (Legendre et al. Reference Legendre, Zenit, Daniel and Guiraud2006). With increasing
 $St$ above
 $St_{cr}$, however, a particle will rebound to an increasing degree, and the DEM contact time of a numerical model must be calibrated to ensure an adequate fluid response and the correct rebound trajectories (Rettinger & Rüde Reference Rettinger and Rüde2022). The task here, then, is to first determine the rebound regime(s) of the simulations in this work, and then ensure that the correct behaviour is reproduced. To do so, the Stokes number is defined as
 \begin{equation} St=\frac{1}{9}\,\frac{\rho_p}{\rho_f}\,\frac{\langle v \rangle d}{\nu}, \end{equation}
where  $\rho _p$ is the particle density. Based on this definition,
 $St=0.026$–0.84 for the range of simulations conducted in this work (note that these values would be reduced further if the reductions in
 $\langle v \rangle$ due to the presence of solids were taken into account). These low
 $St$ are indicative of the micron-scale particles studied here, and suggest that particles should not physically rebound. To verify this, a simplified version of the pendulum experiment of Yang & Hunt (Reference Yang and Hunt2006) is conducted. Two spheres with
 $d/\delta _x=10$ are positioned at an initial
 $x$ separation distance
 $3d$ at the centre of a periodic fluid domain of size
 $10d \times 5d \times 5d$ (
 $x \times y \times z$). A constant acceleration is applied in the
 $x$ direction to sphere 1, which is switched off just prior to contact with sphere 2. The contact is characterised by the velocities of the two particles at contact,
 $u_{c,1}$ and
 $u_{c,2}$, via the binary Stokes number,
 $St_B=(1/9)(\rho _p/\rho _f)(u_{c,1} - u_{c,2})d/\nu$. For
 $St_B=0.4$, figure 3(a) illustrates that the two particles remain touching after contact, verifying that the suspending fluid provides the necessary energy dissipation to prevent particle rebound at lattice resolution
 $d/\delta _x=10$.
Verification of particle contacts for two separate test cases, including (a) the simplified pendulum test, with the trajectories of each particle relative to the point of contact,  $x_c$, and time of contact,
 $t_c$, showing that rebounding does not occur, and (b) the hydrodynamic force,
 $F$, normalised by the Stokes drag force,
 $F_{St}$, for two approaching spheres at small separation distances, demonstrating that the PSM with smooth spheres at resolution
 $d/\delta _x=10$ is equivalent to the analytical solution (sum of Stokes drag and lubrication (2.11)) for particles of effective roughness
 $\eta _e/d=0.034$.

Second, a large repulsive hydrodynamic force is created as fluid is forced out of the small closing gap of two approaching surfaces. This force, commonly termed the lubrication force, must be captured correctly by numerical models. An approximation of the normal lubrication force for two spheres of equal diameter is given by (Brenner Reference Brenner1961; Izard, Bonometti & Lacaze Reference Izard, Bonometti and Lacaze2014)
 \begin{equation} \boldsymbol{F}_{lub} ={-}\frac{6{\rm \pi}\rho_f\nu\bar{\boldsymbol{u}}}{\zeta + \eta_e}\left(\frac{d}{4}\right)^2, \end{equation}
where  $\bar {\boldsymbol {u}}$ is the relative velocity, and
 $\eta _e$ is the effective roughness of the spheres. Incorporating an effective roughness height in this manner is consistent with experimental observations (Izard et al. Reference Izard, Bonometti and Lacaze2014), and prevents the force from diverging as the separation distance
 $\zeta \rightarrow 0$. However, while
 $\eta _e$ is of the same order of magnitude as the physical roughness, it is not exactly equivalent to any standard measure, such as the mean or root mean square of asperity heights (Mongruel et al. Reference Mongruel, Chastel, Asmolov and Vinogradova2013).
In general, the LBM correctly predicts the total hydrodynamic force (drag plus lubrication) for  $\zeta > (2/3)\delta _x$, but then resolves only part of the lubrication force when
 $\zeta < (2/3)\delta _x$ (Ladd & Verberg Reference Ladd and Verberg2001; Rettinger & Rüde Reference Rettinger and Rüde2022). The same problem faces all fluid numerical solvers, therefore a lubrication correction force can be added within distances where the solver underestimates the total hydrodynamic force. To account for roughness, or to prevent divergence, the correction force is typically cut off at a separation distance that is calibrated against experimental results (e.g. particle rebound trajectories for the case
 $St>St_{cr}$; Rettinger & Rüde Reference Rettinger and Rüde2022). In this work, the lubrication correction is not added because at the resolution used, the element size and roughness of the particles are in the same range. In fact, the hydrodynamic force predicted by the PSM matches the analytical hydrodynamic force of rough particles. To demonstrate this, two smooth particles are approached at constant velocity, and the total hydrodynamic force acting on each particle is measured. Figure 3(b) demonstrates that for particles with
 $d/\delta _x=10$, the force obtained from the LBM closely matches the analytical force (Stokes drag plus lubrication) for
 $\eta _e/d=0.034$ over all separation distances. In other words, the computational resolution used throughout this work is representative of particles with effective roughness
 $\eta _e/d=0.034$. For a particle size
 $d=5\times 10^{-6}\ \textrm {m}$, this equates to
 $\eta _e=0.17\times 10^{-6}\ \textrm {m}$, which is commensurate with the mean or root mean square physical roughness of many materials, such as steel, glass and polymers, which commonly fall into the range
 $0.1{-}0.5\times 10^{-6}\ \textrm {m}$ (Gondret, Lance & Petit Reference Gondret, Lance and Petit2002; Yang & Hunt Reference Yang and Hunt2006). It is reiterated, however, that
 $\eta _e$ and the physical roughness are not exactly equal. Any calibration of or sensitivity analysis in relation to
 $\eta _e$ (via changing the grid resolution or adding a lubrication correction) is considered outside the scope of this work. Instead, a sensitivity analysis is performed with respect to
 $\mu$ as discussed in § 2.2.
Third, the implementation of DLVO forces and resulting dynamic behaviour with hydrodynamic forces near contact is verified. As illustrated in figure 4(a), two spheres with  $d/\delta _x=10$ are positioned at an initial separation distance
 $\zeta _0=0.62\sigma$, at the centre of a periodic fluid domain of size
 $5d \times 5d \times 5d$ in a fully coupled LBM–DEM simulation. The full inter-particle DLVO force, as well as a constant gravitational body force,
 $F_g$, are applied to one of the spheres only, such that
 $F_a/F_g=1.22$. The other sphere is fixed. Based on a force balance, the moving sphere should reach an equilibrium position
 $\zeta =0.66\sigma$ when
 $F_e=F_g$. Figure 4(b) shows that the spheres initially move apart and then oscillate to
 $\zeta =0.66\sigma$ due to damping from the fluid. In other words, the spheres behave as a nonlinear spring–damper system. For reference, the non-damped DEM-only simulation is also plotted. Overall, this verifies first that the DEM correctly calculates the analytical DLVO forces presented in § 2.1, and second that the LBM coupling introduces no spurious forcing. It is recognised, however, that at such small separation distances, which are much less than the lattice spacing (
 $\zeta \approx \delta _x 10^{-4}$), the system dynamics is highly sensitive to the lattice spacing. Analysis of the fluid–particle dynamic response in relation to the computational resolution is outside the scope of this work. However, this issue has hitherto been given insufficient attention in CFD modelling that incorporates electrostatics, and should be a focus of future research.
Verification test for two spheres in close proximity, showing (a) the initial test configuration (sphere sizes and separation distance are not to scale), where the top sphere is fixed and the total DLVO force,  $F_e$, and a body force,
 $F_g$, are applied to the bottom sphere, and (b) that an equilibrium position of
 $\zeta =0.66\sigma$ is attained, verifying correct implementation of hydrodynamic and DLVO forces.

Finally, the small separation distances over which DLVO forces act mean that the DEM time resolution, determined by  $n_{sub}$, must be sufficiently fine that the electrostatic interaction of two bodies is captured as they separate after contact. At the same time, however, a finite limit on
 $n_{sub}$ is required, since the computational expense scales with
 $n_{sub}$. The required time resolution depends on the relative velocity of the interaction: for a particle contacting and rebounding from a wall, for example, it will either escape the electrostatic force minimum or remain trapped and attached to the wall. If the DEM time step is too large, however, then the distance rebounded in a single time step will exceed the distance at which the electrostatic minimum occurs (
 $\zeta \approx 0.72\sigma$) and the electrostatic force will not be seen by the particle. Depending on the contact velocity, this may mean the difference between a particle remaining trapped or escaping. Therefore, to determine the required
 $n_{sub}$, the same simulation set-up as for the previous verification test is used; however, in this case, the stationary particle is replaced with a wall (figure 5a). An initial velocity,
 $V_0$, is applied to the particle, and it then overlaps with the wall and rebounds due to the DEM contact force (figure 5b). This set-up reflects a ‘worst case’ scenario, where a particle is already attached to a wall and is impacted by another particle travelling in the flowing fluid, and the hydrodynamic force is imparted completely to the wall particle, perpendicular to the wall, via
 $V_0$. Four different adhesion numbers (
 $Ad_w=4.5,9,18,70$) are tested, reflecting the full range of simulations in this work, where
 $V_0$ replaces the characteristic mean channel velocity in (2.6). The initial separation distance is
 $\zeta _0=0.6\sigma$. The resulting particle trajectories are shown in figures 5(c)–5(f), noting that the large negative
 $\zeta$ values are due to the non-physical overlap of the DEM. First, for
 $Ad_w=70$, it can be concluded that no sub-stepping is required, since the electrostatic adhesion force is sufficiently large for
 $n_{sub}=1$ to adequately match
 $n_{sub}=100$. For the lower
 $Ad_w=18$, however, upon rebounding, the particle should remain captured by the wall, according to the high-resolution case
 $n_{sub}=100$. For
 $n_{sub}=1$, the DEM time resolution fails to reproduce this, while for
 $n_{sub}=2$ and
 $n_{sub}=3$, the trajectory is significantly different from
 $n_{sub}=100$. The case
 $n_{sub}=4$, however, may be regarded as an adequate resolution of the contact. As
 $Ad_w$ is decreased further to 9, the particle escapes in all cases; however, it is clear that
 $n_{sub}=8$ is required to approximate adequately the high-resolution case (the larger scale of the
 $y$-axis should be noted). Finally, for the lowest
 $Ad_w=4.5$,
 $n_{sub}=8$ again gives an adequate approximation. According to these results, for the following simulations of this work, a maximum
 $n_{sub}=8$ is employed for
 $Ad_w \lesssim 9$, a minimum
 $n_{sub}=1$ is employed for
 $Ad_w \gtrsim 70$, and for
 $9 < Ad_w < 70$,
 $n_{sub}$ is varied in a linear manner from 8 to 1.
Verification test for a particle contacting a wall to determine the required number of DEM sub-iterations,  $n_{sub}$, as a function of
 $Ad_w$. (a) The initial test configuration (particle size and separation distance are not to scale), where the total DLVO force,
 $F_e$, and an initial velocity,
 $V_0$, are applied to the particle. (b) The particle contacting the wall, and the resulting DEM contact force,
 $F_c$, where the overlap is accentuated to convey the non-physical overlap of the DEM. The resulting particle trajectories in (c–f) demonstrate that increasing DEM time resolution is required to capture electrostatic forces as
 $Ad_w$ decreases, up to maximum resolution
 $n_{sub}=8$, where (c)
 $Ad_w=70$, (d)
 $Ad_w=18$, (e)
 $Ad_w=9$, and (f)
 $Ad_w=4.5$.

3. Methodology
Here, a methodological framework is developed, which employs the numerical model presented in § 2 to produce the results in § 4. First, the numerical test cell, which emulates a planar channel with long-wavelength roughness, is described. Next, considerations for determining the clogging probability are established, and finally the domain dependence and electrostatic surface attachment associated with the test cell are investigated.
3.1. Numerical test cell
The numerical test cell depicted in figure 6 is employed in this work to replicate clogging in planar channels and obtain the clogging data presented in § 4. The key feature of this test cell is the ridges of the channel walls, which mimic a planar channel with long-wavelength roughness. These ridges have two functions. First, they provide surface asperities to which particles can attach with electrostatics since, even if it was included, the torque generated by the inclusion of rolling friction would be insufficient to cause attachment at the desired pressure gradients. The modelling of attachment pressure gradients is discussed at length in § 3.4. Second, the asperities induce the transverse particle motion required to cause arching, since clogging does not occur in perfectly smooth channels. This has been shown experimentally (Barree & Conway Reference Barree and Conway2001; Ray et al. Reference Ray, Lewis, Martysevich, Shetty, Walters, Bai and Ma2017) and is explained by the fact that walls push particles away since pressure is higher on the side of a particle closest to a wall (Feng, Hu & Joseph Reference Feng, Hu and Joseph1994). Consequently, even if particles could attach to a perfectly smooth numerical wall via electrostatics, they would never contact the wall in the first place. Overall, in numerical implementations, the absence of realistic surface roughness may be regarded as a numerical artefact that negates attachment and arching, even in suspensions approaching the maximum particle packing limit.
Planar channel test cell with ridged surfaces for clogging simulations. Fluid is driven by a constant pressure gradient in the  $z$ direction, and fluid boundaries are periodic in the
 $y$ and
 $z$ directions. Particles are injected continuously in the region
 $z \in [l/10,l/5]$, and particle boundaries are periodic in the
 $y$ direction only. The shaded surfaces represent the walls that impart an electrostatic force on the particles.

The suspending fluid is driven by a constant body force in the  $z$ direction, akin to a constant pressure gradient
 $G=\textrm {d}P/\textrm {d}z$. The fluid is Newtonian, with particle to fluid density ratio
 $\rho _p/\rho _f=3.5$; however, no gravitational force is applied such that particles do not settle transverse to the flow.
The inlet and outlet boundaries of the fluid are periodic; however, particles exit the simulations once they reach the end of the computational domain. In this way, the inlet of the fluid experiences the flow effects of particles that are close to the outlet; however, the particles do not re-enter at the inlet. This set-up is required since the pressure gradient is modelled by a constant body force in the LBM simulation, which provides a quick flow profile development in a small computational domain, in comparison to prescribed pressure boundaries at the inlet and outlet. The particles are not periodic since a random distribution is desired at insertion, in which the incoming particles are not influenced by or coupled to the rest of the simulation. Particles are injected at the inlet of the channel in the region  $z \in [l/10,l/5]$ to allow development of a smooth fluid profile. They are added constantly to the injection region such that the bulk solid volume fraction,
 $\bar {\phi }$, is maintained in this region. The vertical direction,
 $y$, is periodic for both particles and fluid. A study of the domain dependence in the
 $z$ and
 $y$ directions is presented in § 3.3. The clogging probability is shown to be approximately independent of the domain dimensions for
 $l/d=20$ and
 $h/d=15$, which are the values used subsequently throughout this work.
The ridges on each channel wall are symmetrically opposed, and the channel width,  $w$, is defined as the perpendicular distance from an electrostatic surface to the surface of an opposing ridge. All particles in a single simulation have identical sizes (i.e. all suspensions are monodisperse), yielding a single value of
 $w/d$ for each simulation. While this work is focused on monodisperse suspensions, it has been shown that for polydisperse suspensions (comprising particles of multiple sizes), it is the largest particles that define whether clogging will occur (STIM-LAB, Inc. 1995; Xu et al. Reference Xu, Sun, Cai and Geng2020). Consequently, the study of monodisperse suspensions is a meaningful simplification.
For ease of computational implementation, wall electrostatic forces are implemented on each side of the channel (in the  $z$–
 $y$ plane) using a smooth electrostatic plane without ridges. Its position therefore coincides with the recessed part of the physical wall, as indicated by the shaded surfaces in figure 6, and the force is in the
 $x$ direction only. The choice of ridge geometry is relatively arbitrary; however, ridge heights
 $a/d=0.1$ provide sufficient moment arms for the walls’ normal electrostatic adhesion force to balance with the hydrodynamics of the suspending fluid (figure 7). Overall, these modelling simplifications adequately reproduce surface attachment, which is investigated in detail in § 3.4. Nevertheless, dependence of surface attachment and clogging on the ridge geometry and electrostatic wall implementation warrants further investigation, particularly when translating the computational domain to nonlinear realistic textures.
Torque balance of hydrodynamic and electrostatic forces at a surface asperity.

3.2. Determining clogging probability
To determine the clogging probability,  $P$, this work effectively employs the commonly used method (Guariguata et al. Reference Guariguata, Pascall, Gilmer, Sum, Sloan, Koh and Wu2012; Mondal et al. Reference Mondal, Wu and Sharma2016; Chen et al. Reference Chen, Ho-Minh and Tan2018; Sun et al. Reference Sun, Xu, Pan, Shi, Geng and Cai2019) of conducting multiple Bernoulli trials at a fixed combination of parameters, and dividing the number of trials that clog,
 $N_j$, by the total number of trials,
 $N_t$, i.e.
 $P = N_j/N_t$. Each trial uses a unique and random particle injection seed to achieve numerical randomness. In § 4, however, a methodology is detailed for predicting the variation of the discrete
 $P$ with a free parameter using a continuous logarithmic regression model, and results are interpreted in terms of this predictive model.
The approach of obtaining a probability using a finite number of trials, obtained over a finite time, comprises two aspects of uncertainty. First, for what total simulation time,  $t_s$, should each simulation be run; and second, how many trials are required to give a sufficiently accurate
 $P$? This second aspect is addressed in an uncertainty quantification in the Appendix, while the first aspect is addressed in the following.
Apart from the fact that minimising  $t_s$ minimises computational expense, constraining
 $t_s$ is necessary since, in theory,
 $P \rightarrow 1$ as
 $t_s \rightarrow \infty$ (Koivisto & Durian Reference Koivisto and Durian2017). However, as noted in § 1, there are also critical values of parameters for which the probability of clogging is observable. Using the example of particle concentration, there exists a critical concentration above which clogging is observed (
 $P>0$), but below which it is not. Predicting
 $P$ in the limit as
 $t_s \rightarrow \infty$ is also crucial if numerical models are to be applied at physically realistic time and length scales. In this respect, as discussed in § 1,
 $P$ follows an exponential probability distribution function with time (Lafond et al. Reference Lafond, Gilmer, Koh, Sloan, Wu and Sum2013; Marin et al. Reference Marin, Lhuissier, Rossi and Kähler2018; López et al. Reference López, Hernández-Delfin, Hidalgo, Maza and Zuriguel2020). This modelling aspect, however, is considered outside the scope of the present work.
Instead, this study determines  $t_s$ by defining a dimensionless distance,
 \begin{equation} \bar{D}=\frac{\displaystyle\sum\nolimits_{i} {\langle v \rangle}_i \delta_t}{d}, \end{equation}
where  ${\langle v \rangle }_i$ is the mean velocity of all particles with non-zero velocity, at each time step
 $i$. Particles that have arched locally while other regions of the domain are still flowing (as shown in § 3.3) are therefore not considered in the calculation of
 ${\langle v \rangle }_i$, nor are particles that have attached to the channel wall when electrostatics is present. Consequently,
 $\bar {D}$ is effectively how many particle diameters the suspension would travel if not clogged. Letting each simulation run for the same
 $\bar {D}$ gives consistency to the measurement of
 $N_j$.
A value  $\bar {D}=200$ gives sufficient time for full flow development. As illustrated in figure 8,
 $\langle v \rangle$ initially decreases as more particles enter the channel and the porosity effectively decreases. Complete flattening of the transient velocity curves indicates the point where the channel has become fully occupied. This behaviour occurs independently of any arching.
Variation in the mean velocity of non-arched particles,  $\langle v \rangle$, with dimensionless suspension distance
 $\bar {D}$ (see (3.1)). For these five selected simulations at these parameters (
 $w/d=2.4$,
 $St=0.19$,
 $\bar {\phi }=0.24$), full suspension clogging does not occur within
 $\bar {D}=200$; however, dips in the velocity indicate periods of increased localised arching. This demonstrates how the flow has a transient development period as the channel gradually becomes fully occupied by particles.

3.3. Domain dependence
The use of a periodic particle boundary in the  $y$ direction imposes a dependence on the domain height, while a dependence on the domain length also exists since the number of ridges increases with
 $l$. Here, these dependencies are quantified by measuring
 $P$ over a range of normalised domain dimensions,
 $h/d$ and
 $l/d$. Ten trials are conducted at each parameter combination. Only the non-electrostatic scenario is analysed.
First, considering dependence on  $h$, it must be recognised that for a planar channel, localised arching occurs first prior to complete clogging. This is depicted in both figure 9(a) and supplementary movie 1 available at https://doi.org/10.1017/jfm.2023.214. It is emphasised, however, that complete channel clogging does not necessarily follow from localised arching, since non-stable arches can disintegrate. If the domain height is insufficiently large, then an occurrence of a local arch could result in arching immediately propagating over the entire domain height (complete channel clogging) due to interactions of particles over the periodic
 $y$ boundary. This immediate propagation would be more indicative of a confined channel (such as a cylinder), where the flow is bounded on all sides. Therefore, for a planar channel simulation to be
 $h$-independent, local arches must be able to form independently of one another. The difference between immediate and gradual arch propagation can be characterised by plots of the number of particles exiting the simulation ( figures 9b,c). For
 $h/d=4$ (figure 9b), the cumulative particle exit count becomes constant instantaneously, while for
 $h/d=15$ (figure 9c), the rate of particles exiting decreases gradually before becoming constant.
Illustrating the concept of localised arching and gradual arch propagation for planar channels, showing (a) the existence of localised arching, which does not necessarily lead to complete channel clogging. (b,c) Plots of the particle exit count versus time for five trials, each at  $w/d=1.8$,
 $St=0.1$,
 $\bar {\phi }=0.07$, and (b)
 $h/d=4$ or (c)
 $h/d=15$. A gradual decrease in the rate of particles exiting for
 $h/d=15$ indicates gradual arch propagation leading to channel clogging. For
 $h/d=4$, on the other hand, the number of particles exiting the domain becomes constant instantaneously, indicating immediate arch propagation and clogging due to particle interactions over the periodic
 $y$ boundary.

Figure 10(a) shows that the clogging probability becomes independent of the domain height at approximately  $h/d=20$, for both of the
 $w/d$ values tested. As
 $h$ decreases,
 $P$ increases due to increased periodic particle interaction, and therefore more occurrences of immediate arch propagation. In the subsequent results in this paper, a domain height
 $h/d=15$ is employed to minimise computational expense while eliminating most of the periodic height effects.
Dependence of  $P$ on (a) the domain height,
 $h/d$, and (b) the domain length,
 $l/d$, where comparison is made between the original dimensionless distance,
 $\bar {D}$, and the alternative length-based dimensionless distance
 $\bar {D}_l$. Ten trials are conducted to obtain each data point.

The clogging probability increases as the channel length increases because the number of ridges, and hence opportunities for arching, becomes larger. If the number of ridges is too low, then there will be insufficient opportunities for arching. An intuitive way of accounting for this dependence on length is to define an alternative dimensionless distance,
 \begin{equation} \bar{D}_l=\frac{\displaystyle\sum\nolimits_{i} {\langle v \rangle}_i \delta_t}{d}\,\frac{l}{d}, \end{equation}
which effectively decreases the simulation time as the channel length increases. Figure 10(b) plots the dependence of  $P$ on the channel length, with the simulation time determined by both the original dimensionless distance,
 $D$, and the new length-based dimensionless distance,
 $\bar {D}_l$. Evidently, when using the original dimensionless distance,
 $P$ becomes independent of the domain length at
 $l/d \gtrsim 16$. The length-based dimensionless distance, on the other hand, over-compensates for the additional channel length/ridges. This is evidenced by the decreasing
 $P$ for increasing
 $l/d$ at
 $l/d \gtrsim 20$, which is a result of the decreasing simulation time. These results suggest that for
 $l/d \gtrsim 16$, the addition of more ridges does not influence the clogging probability. Further,
 $l/d=12$ clearly provides insufficient opportunities for arching. Consequently,
 $l/d=20$ is used throughout this work, which corresponds to five ridges along the channel length, as depicted in figure 6.
3.4. Surface attachment
To validate that the asperity geometry defined in § 3.1 gives a physical representation of surface attachment, the critical mean fluid velocities at which attachment occurs,  $\langle v \rangle ^*$, are here determined for a range of parameters. To do so, a single particle is initialised at a surface asperity, as in figure 7, and
 $\langle v \rangle$ is decreased in subsequent simulations until the particle remains attached to the wall.
First, figure 11(a) shows that  $\langle v \rangle ^*$ increases approximately linearly with the magnitude of the particle–wall adhesion force,
 $F_{a,{p-w}}$. The
 $\langle v \rangle ^*$ values are greater for
 $w/d=2.4$ compared to
 $w/d=1.8$ since the larger channel results in a lower velocity at the wall, and therefore lower hydrodynamic drag, for an equivalent mean velocity.
The critical mean fluid velocity for electrostatic surface attachment,  $\langle v \rangle ^*$. Dependence on (a) the particle–wall adhesion force,
 $F_{a,{p-w}}$, and non-dimensional channel width,
 $w/d$, at
 $d={5}\ {\mathrm {\mu }}\textrm {m}$, and (b) the particle diameter,
 $d$, at
 $A_{132}=8.4\times 10^{-21}\ \textrm {J}$ and
 $w/d=1.8$.

Next, the physical particle size is varied at a constant Hamaker constant to give an indication of how surface attachment changes as hydrodynamic forces dominate electrostatic forces. Both the lattice resolution and  $w/d$ are also held constant as
 $d$ is increased. Figure 11(b) demonstrates that
 $\langle v \rangle ^*$ decreases with increasing
 $d$ in a nonlinear fashion. This trend has been predicted previously theoretically (Yang et al. Reference Yang, Siqueira, Vaz, You and Bedrikovetsky2016; You et al. Reference You, Yang, Badalyan, Bedrikovetsky and Hand2016) and observed experimentally (Chequer et al. Reference Chequer, Carageorgos, Naby, Hussaini, Lee and Bedrikovetsky2021). The nonlinear relationship can be attributed to the scaling of the particle forces, where the electrostatic attractive force increases approximately linearly with
 $d$, while the hydrodynamic drag increases quadratically with both
 $d$ and the channel velocity.
The range of critical attachment velocities obtained here ( $0.017 \leqslant \langle v \rangle ^* \leqslant 0.202$) is commensurate with experimental values obtained previously at similar electrostatic parameter values (Chequer et al. Reference Chequer, Carageorgos, Naby, Hussaini, Lee and Bedrikovetsky2021). It is emphasised, however, that the ridge height employed in the current study is non-physical compared to the size of the experimental surface asperities (
 ${\approx }1\times 10^{-8}\ \textrm {m}$), and instead may be viewed as an additional numerical parameter on which
 $\langle v \rangle ^*$ is dependent. Since physically valid
 $\langle v \rangle ^*$ and correct trends in relation to other parameters have been achieved, however, the choice of ridge height in this study, along with the decisions to implement a simplified friction model and neglect hydrodynamic torque, can be considered valid.
4. Results
Based on the numerical model and methodology presented in §§ 2 and 3, mechanical hydrodynamic clogging in this work is completely represented by the non-dimensional parameters  $\bar {\phi }$,
 $w/d$,
 $St$ and
 $\mu$. The dependence of hydrodynamic clogging on these parameters is presented in § 4.1. Then, in § 4.2, electrostatics is incorporated, and the non-dimensional adhesion numbers
 $Ad_w$ and
 $Ad_p$ are varied in conjunction with the aforementioned mechanical parameters. As stated in § 2.2,
 $\mu$ is held constant at value 1, unless otherwise stated. The parameter
 $\bar {\phi }$ is varied as a free parameter in all cases, as will be described next.
Between eight and twelve Bernoulli trials are conducted at each parameter combination. What emerges is a data set comprising two possible outcomes – 1 for clogged, and 0 for not clogged – each of which is mapped to a particular parameter combination. The goal, then, is to predict the probability that a simulation clogs,  $P$, based on the values of the input parameters. To do so, this work employs logistic regression, where the log-odds of obtaining a clogged simulation is modelled as a weighted sum of all input parameters,
 $X_i$:
 \begin{equation} \ln\left(\frac{P}{1-P}\right) = \beta_0 + \sum_i\beta_i X_i. \end{equation}
Modelling the log-odds as a linear function results in  $P$ varying as a sigmoid curve between 0 and 1. The parameter coefficients,
 $\beta _i$, are determined by maximum likelihood estimation, where the likelihood of (4.1) matching the original data set is maximised according to a binomial distribution.
Here, this methodology is simplified by varying  $\bar {\phi }$ as the free parameter for each particular combination of the other parameters. In this way, (4.1) reduces to a single input parameter,
 $X_1=\bar {\phi }$, and a discrete set of probabilities with a predictive regression model like that in figure 12 is obtained for each parameter combination. From the regression model, the predicted
 $\bar {\phi }$ values corresponding to
 $P=0.05$ and 0.95 are obtained, herein denoted by
 $\bar {\phi }_{5}$ and
 $\bar {\phi }_{95}$, respectively. The subsequent results are therefore presented as the variation of
 $\bar {\phi }_{5}$ and
 $\bar {\phi }_{95}$ with a particular input parameter.
A discrete set of probabilities obtained via simulations, fitted with the predictive regression model, for the case  $w/d=1.8$ and
 $St=0.1$. Here,
 $\bar {\phi }$ is varied as the free parameter, while the regression model is used to predict the
 $\bar {\phi }$ values at which
 $P=0.05$ and 0.95, denoted by
 $\bar {\phi }_{5}$ and
 $\bar {\phi }_{95}$, respectively.

For the discrete simulation results, at each parameter combination, there exists a lower value of  $\bar {\phi }$ corresponding to
 $P=0$ below which clogging is not observed. There also exists an upper value of
 $\bar {\phi }$ corresponding to
 $P=1$, above which clogging is observed for every simulation within the defined simulation time. These lower and upper
 $\bar {\phi }$ limits are selected as the smallest and largest
 $\bar {\phi }$ values tested, and between these limits, the values of
 $\bar {\phi }$ are selected at equal increments so as to not introduce bias. The minimum increment is 0.01 since this is the approximate volume fraction of a single particle in the injection region. The maximum value of
 $\bar {\phi }$ that can be achieved in the insertion region with the present insertion algorithm is
 $\bar {\phi }=0.36$.
4.1. Mechanical clogging
The first mechanical parameter to be varied is the non-dimensional channel width,  $w/d$. Note that the pressure gradient is held constant at all widths, meaning that
 $St$ varies from 0.05 for
 $w/d=1.2$ up to 0.22 for
 $w/d=2.6$ (the influence of
 $St$ on clogging, however, is studied next). The results are depicted in figure 13. Most notably, distinct clogging regions exist based on
 $w/d$, i.e. no clogging is observed for
 $2.1 \leqslant w/d \leqslant 2.3$ and
 $2.7 \leqslant w/d$. Similar regions have been reported only once previously for hydrodynamic clogging, in experiments of straight pipes at dense solid volume fractions (
 $\bar {\phi }=0.5$; López et al. Reference López, Hernández-Delfin, Hidalgo, Maza and Zuriguel2020). The existence of these regions, as well as the variation in
 $\bar {\phi }_{5}$ and
 $\bar {\phi }_{95}$ with
 $w/d$, is due to variation of arch stability with channel width. That is, the range of angles sufficient for stability,
 $\theta _{min} \leqslant \theta _i \leqslant \theta _{max}$, varies as a function of
 $w/d$. Further, the widest range of
 $\theta _i$ must therefore exist at
 $w/d=1.8$ since
 $\bar {\phi }_{5}$,
 $\bar {\phi }_{95}$ are at a minimum, while for
 $2.1 \leqslant w/d \leqslant 2.3$ and
 $2.7 \leqslant w/d$, there exist no configurations that maintain stability. For
 $2.4 \leqslant w/d \leqslant 2.6$, the configurations are significantly less stable compared to
 $1.2 \leqslant w/d \leqslant 2$.
Dependence of planar channel clogging on the non-dimensional channel width,  $w/d$, where
 $\bar {\phi }_{5}$ and
 $\bar {\phi }_{95}$ indicate the solid volume fractions at which
 $P=0.05$ and 0.95, respectively, as predicted by the fitted logistic regression model. The lightly shaded regions between the
 $\bar {\phi }_{5}$ and
 $\bar {\phi }_{95}$ values indicate the
 $\bar {\phi }$ for which clogging will occur in 5–95 % of cases, while the darkly shaded regions above the
 $\bar {\phi }_{95}$ values indicate the
 $\bar {\phi }$ for which clogging will occur in at least 95 % of cases. No
 $\bar {\phi }_{95}$ values at
 $w/d=2.4$ and 2.6 means that
 $\bar {\phi }_{95}$ is greater than the maximum injection solid volume fraction,
 $\bar {\phi }=0.36$.

Referring to figure 13, the maximum width at which clogging occurs is  $w/d^*=2.6$. This is the first time a critical width has been reported for planar channels, and is commensurate with most literature studies of circular and square constrictions, which are in the range
 $2 < w/d^* < 3$. The number of particles that compose an arch and their configurations, based on
 $w/d$, is also reported for the first time for planar channels. As depicted in figure 14(a), for
 $w/d \leqslant 2$, arches form with
 $n=2$ or 3 particles. This occurs even for
 $w/d=2$ due to the test cell having aperture
 $w_a=w-a$ that is slightly reduced by the presence of ridges. For
 $2.4 \leqslant w/d \leqslant 2.6$, on the other hand, arches form initially with
 $n=4$ particles only (i.e. a particle touches a maximum of three other stationary particles), as shown in figure 14(b). More complex structures comprising more particles can follow, but the initial arch only ever has four particles. This result suggests that the probability of
 $n \neq 4$ particles coming into contact at their stable angles,
 $\lbrace \theta _i \rbrace$, within a sufficiently short time interval, is very low. It also substantiates the difference between planar channels and constrictions of circular and square cross-section, in which it is suggested that arches of at least six particles form (Sharp & Adrian Reference Sharp and Adrian2005; Lafond et al. Reference Lafond, Gilmer, Koh, Sloan, Wu and Sum2013; Marin et al. Reference Marin, Lhuissier, Rossi and Kähler2018).
Configurations of the initial arches that form for (a)  $w/d=1.8$, where
 $n=2$ or 3, and (b)
 $w/d=2.4$, where
 $n=4$. Non-stationary particles are omitted in (b) for improved clarity.

Next,  $St$ is varied at two different channel widths,
 $w/d=1.8$ and 2.4, by varying the pressure gradient. Doing so is akin to increasing the mean suspension velocity,
 $\langle v \rangle$, and allows the competing effects of collision frequency and arch stability to be decoupled, as discussed in § 1. For
 $w/d=1.8$, figure 15(a) shows a distinct decrease in
 $\bar {\phi }_{5}$,
 $\bar {\phi }_{95}$ with increasing
 $St$ for
 $St \leqslant 0.105$. Based on the uncertainty quantification presented in the Appendix, the trend from
 $St=0.105$ to 0.21 cannot be concluded with certainty. Similarly, for
 $w/d=2.4$, figure 15(b) shows a distinct decrease in
 $\bar {\phi }_{5}$,
 $\bar {\phi }_{95}$ with increasing
 $St$ for
 $St \leqslant 0.19$; however, the trend from
 $St=0.19$ to 0.37 cannot be concluded with certainty. To analyse the meaning of these results, note that these decreases in
 $\bar {\phi }_{5}$,
 $\bar {\phi }_{95}$ can effectively be interpreted as increases in
 $P$. Also recall from § 1 that when
 $\langle v \rangle$ is increased, the collision frequency increases while the arch stability decreases, which raises and lowers
 $P$, respectively. Therefore, for
 $St \lesssim 2$, the increases in collision frequency must dominate the decreases in arch stability to cause the increases in
 $P$, which is what has been observed previously in the literature (Dai & Grace Reference Dai and Grace2010; Mondal et al. Reference Mondal, Wu and Sharma2016; Sun et al. Reference Sun, Xu, Pan, Shi, Geng and Cai2019; Li et al. Reference Li, Qiu, Zhong, Zhao and Huang2020). However, this dominating effect of the collision frequency is not strong, and seems to match the effect of arch stability for
 $0.2 \gtrsim St$ since the curves in figures 15(a) and 15(b) flatten.
Dependence of planar channel clogging on  $St$ for (a)
 $w/d=1.8$, and (b)
 $w/d=2.4$.

To investigate higher  $St$, the particle size is next increased while keeping all other parameters constant (at
 $w/d=1.8$). The results, plotted in figure 16, may therefore be viewed as a continuation of figure 15(a) for
 $St>0.21$. It can be seen clearly that
 $\bar {\phi }_{5}$,
 $\bar {\phi }_{95}$ now increase with
 $St$, which has never been observed in the literature for mechanical clogging. This suggests that the arch stability dominates the collision frequency at
 $St \gtrsim 0.3$ (i.e. the decrease in arch stability with increasing
 $St$ is greater than the increase in collision frequency), and is explained by the quadratic relationship between hydrodynamic force and fluid velocity.
Dependence of planar channel clogging on  $St$ for higher
 $St$, achieved by varying the particle size,
 $d$, at
 $w/d=1.8$.

Finally, figure 17 illustrates the sensitivity to the Coulomb friction coefficient,  $\mu$, at
 $St=0.1$. As described in § 2.2, this sensitivity analysis is conducted as a way of circumventing the need for rigorous calibration of other numerical parameters (rolling friction constants, and electrostatic and lubrication inner cutoff distances) with respect to experiments of bulk properties, which, to the best of the authors’ knowledge, are not published for micro-particles with electrostatics. For a channel width
 $w/d=1.8$, the
 $\bar {\phi }_{5}$,
 $\bar {\phi }_{95}$ values experience only a small increase from
 $\mu =1$ to
 $\mu =0.6$; however, the increase from
 $\mu =0.6$ to
 $\mu =0.2$ is significant. For
 $w/d=2.4$, on the other hand, no clogging occurs for
 $\mu =0.2$ and 0.6, meaning that the effect of decreasing
 $\mu$ from 1 to 0.6 is significant. Evidently, the lower arch stabilities at the higher
 $w/d$ contribute to a greater sensitivity to friction. As discussed in § 2.2, while a value
 $\mu =1$ represents a particularly high degree of particle roughness and/or irregularity, it has the advantage of allowing for an analysis of hydrodynamic clogging over a wide range of cases, and revealing, for example, the parametric regions of clogging from figure 13.
Sensitivity of planar channel clogging to the numerical Coulomb friction coefficient,  $\mu$, at
 $w/d=1.8$ and
 $St=0.1$. No clogging occurs for
 $w/d=2.4$ at
 $\mu =0.2$ and 0.6.

4.2. Electrostatic clogging
Here, electrostatic forces are introduced, and the dependence of planar channel clogging on  $Ad_w$ and
 $Ad_p$ is investigated in conjunction with the mechanical parameters from § 4.1. As introduced in § 2.1, the values of
 $Ad_w$ and
 $Ad_p$ are positive for all parameter combinations, meaning that particle–particle and particle–wall attachment can occur for sufficiently low hydrodynamic forces. The critical mean fluid velocities
 $\langle v \rangle ^*$ obtained in § 3.4 give an indication of when surface attachment occurs.
First, both  $Ad_w$ and
 $Ad_p$ are varied by testing the different combinations of
 $A_{132}$ and
 $A_{131}$ in table 1 while also varying the fluid pressure gradient. The results in figure 18 depict a clear dependence on the magnitude of the wall adhesion. First, for
 $w/d=1.8$ (figure 18a),
 $\bar {\phi }_{5}$,
 $\bar {\phi }_{95}$ remain relatively constant up to
 $Ad_w \lesssim 4$. These also match the mechanical results (
 $Ad_w=0$) at a similar Stokes number (
 $St=0.21$), suggesting that the wall adhesion effect is negligible for
 $Ad_w \lesssim 4$. For
 $4 < Ad_w < 20$, there is then a transition to low
 $\bar {\phi }_{5}$,
 $\bar {\phi }_{95}$. It is probable that sliding along the channel surface begins to occur at
 $Ad_w \approx 4$, with attachment at the surface asperities occurring increasingly for
 $4 < Ad_w$. For
 $20 \lesssim Ad_w$, the surface attachment is then so strong that
 $\bar {\phi }_{5}=0$ and
 $\bar {\phi }_{95}=0.01$, apart from a slight anomaly at
 $Ad_w = 37$ for low
 $Ad_p$ (hollow markers). Barring this, no distinct dependence on
 $Ad_p$ is observed. In general, this decrease in
 $\bar {\phi }_{5}$,
 $\bar {\phi }_{95}$ (or increase in
 $P$) with increasing ratio of electrostatic adhesion to fluid force is commensurate with literature studies of clogging with electrostatics (Ramachandran & Fogler Reference Ramachandran and Fogler1999; Liu et al. Reference Liu, Zhao and Santamarina2019; Trofa et al. Reference Trofa, D'Avino, Sicignano, Tomaiuolo, Greco, Maffettone and Guido2019). The novelty of these results, however, is that this relationship is reported for planar channels.
Dependence of planar channel clogging on the electrostatic adhesion numbers,  $Ad_w$ and
 $Ad_p$, for (a)
 $w/d=1.8$, and (b)
 $w/d=2.4$. Primary dependence on
 $Ad_w$ is illustrated by plotting
 $Ad_w$ on the horizontal axis, while the data sets are split between low and high values of
 $Ad_p$ to illustrate secondary dependence on
 $Ad_p$. For
 $w/d=2.4$, the absence of
 $\bar {\phi }_{95}$ values (circle markers) indicates that
 $\bar {\phi }_{95}$ is greater than the maximum injection solid volume fraction
 $\bar {\phi }=0.36$, while no clogging occurs when
 $Ad_w < 6$ for
 $1.6 < Ad_p$ (solid markers). Horizontal lines indicate purely mechanical results (
 $Ad_w=0$) at a particular Stokes number.

Similarly, for  $w/d=2.4$ (figure 18b), a transition from high to low
 $\bar {\phi }_{5}$,
 $\bar {\phi }_{95}$ occurs at
 $Ad_w \approx 4$. For
 $Ad_w \lesssim 4$ in this case, however, the
 $\bar {\phi }_{5}$ values match the mechanical results (
 $Ad_w=0$) depending on the Stokes number, noting that the two leftmost square markers are obtained at a higher
 $St$, while the two square markers to the right are obtained at a lower
 $St$. This interdependence of
 $St$ and electrostatics is investigated further next. For this larger channel width,
 $Ad_p$ also has a distinct influence on the clogging probability, since no clogging occurs at
 $Ad_w < 6$ for
 $1.6 < Ad_p$ (solid markers). By comparison, for the purely mechanical results in § 4.1, clogging occurs for similar Stokes numbers at the same channel width. It is postulated that this elimination of clogging occurs because the particle–particle adhesion is much greater than the particle–wall adhesion, and particles consequently agglomerate towards the channel centre. This reduces interactions with the wall asperities, and ultimately diminishes occurrences of surface attachment and arching events. This behaviour is depicted in supplementary movie 3 for the case
 $Ad_w = 2.4$ and
 $Ad_p = 3.2$.
In the next case,  $Ad_w$ is again varied, but this time by varying the particle size and keeping all other parameters constant (
 $w/d=1.8$). This is done to ascertain the effect of
 $St$ in conjunction with
 $Ad_w$, since
 $St$ increases with
 $d$. Note that the
 $St$ values correspond directly to the mechanical case of figure 16, but with the addition of electrostatics. First, the results in figure 19(a) demonstrate the expected dependence on increasing
 $Ad_w$, where the relative strength of the wall adhesion causes
 $\bar {\phi }_{5}$,
 $\bar {\phi }_{95}$ to decrease. This is most pronounced from
 $Ad_w=6.4{-}9.2$, where surface attachment becomes prevalent and dominates the behaviour. In figure 19(b), however, the results are overlayed on the original figure 18(a) (where
 $Ad_w$ was varied but
 $d$ was held constant). In this case of varying
 $d$, the
 $\bar {\phi }_{5}$,
 $\bar {\phi }_{95}$ values are evidently higher for
 $Ad_w \lesssim 4$. At
 $Ad_w=2.3$ specifically, the
 $\bar {\phi }_{5}$,
 $\bar {\phi }_{95}$ values match the mechanical results (
 $Ad_w=0$) at the same Stokes number (
 $St=0.84$). This therefore confirms that the dependence on
 $St$ demonstrated in § 4.1 overrides the dependence on
 $Ad_w$ for
 $Ad_w \lesssim 4$.
(a) Plot demonstrating dependence of planar channel clogging on the electrostatic wall adhesion number,  $Ad_w$, for higher Stokes numbers at
 $w/d=1.8$. (b) Plot overlaying the results on the lower
 $St$ case of figure 18(a), where matching of
 $Ad_w=2.3$ to the purely mechanical result at the same Stokes number (horizontal lines) confirms dependence on
 $St$ for
 $Ad_w \lesssim 4$.

Next, due to surface attachment, clogging is now also observed up to  $w/d^*=4$. This is depicted in figure 20, where
 $w/d$ is varied for constant physical electrostatic parameters. Note that the pressure gradient is held constant at all widths, meaning that
 $Ad_w$ varies from 16.1 for
 $w/d=3$, down to 9.1 for
 $w/d=4$. For
 $4< w/d$, surface attachment still occurs; however, no permanent clogging occurs. Instead, there exist short periods of time where the system clogs; however, the friction is not sufficient to maintain stable arches, and the result is that the suspension moves very slowly, sometimes in a jammed state. This value of
 $w/d^*=4$ has been observed once before for weakly electrostatic systems (Liu et al. Reference Liu, Zhao and Santamarina2019); however, values
 $w/d^*=4{-}8$ are observed commonly when electrostatics is prevalent (Ramachandran & Fogler Reference Ramachandran and Fogler1999; Liu et al. Reference Liu, Zhao and Santamarina2019).
Dependence of planar channel clogging on the non-dimensional channel width,  $w/d$, under the influence of electrostatics with constant physical parameters. For
 $w/d>4$, no clogging occurs, while all values for
 $w/d\leqslant 3$ are equal.

In these electrostatic cases, for  $1< w/d<3$, arches form in an identical way to the purely mechanical case (figure 14), while for
 $3< w/d<4$, an extra particle is simply added such that
 $n=5$. These arches are difficult to isolate and visualise, however, since clumps of particles form due to strong particle–particle attraction. The formation, detachment and transport of these clumps is visualised in supplementary movie 2. This suggests that, in general, the most probable arches that form in a planar channel have two particles contacting one wall, then a chain of single particles across the channel to the other wall, such that
 \begin{equation} n=\left \lceil{w/d}\right \rceil + 1, \end{equation}
noting that two-particle arches can also form for  $1 < w/d \leqslant 2$.
Finally, figure 21 demonstrates the sensitivity to the Coulomb friction coefficient,  $\mu$, for varying electrostatic conditions at
 $w/d=1.8$ and
 $St=0.1$. First, the case
 $Ad_w=1$ and
 $Ad_p=0.5$ (weak electrostatics) closely matches the purely mechanical case from figure 17. For the stronger
 $Ad_w=4.2$ and
 $Ad_p=5.6$, however, there is in fact less clogging at
 $\mu =0.2$. This is analogous to the purely mechanical case for
 $w/d$, where the lower arch stabilities contributed to a higher sensitivity to friction; however, in this case, the lower stability (and hence higher sensitivity) is attributed to the effect of strong particle–particle agglomeration already discussed in this section. When wall adhesion dominates (
 $Ad_w=9.2$), the friction coefficient has no effect.
Sensitivity of planar channel clogging to the numerical Coulomb friction coefficient,  $\mu$, at
 $w/d=1.8$ and
 $St=0.1$, under varying electrostatic conditions. Regions for
 $P>0.95$ are not shaded, for clarity.

5. Conclusions
Hydrodynamic clogging in planar channels is studied using an existing LBM–DEM numerical method, which is adapted to account for electrostatics, and the implementation of a novel numerical test cell and stochastic methodology. It is demonstrated that the clogging probability,  $P$, of the hydrodynamic system is represented by the solid volume fraction,
 $\bar {\phi }$, non-dimensional channel width,
 $w/d$, and Stokes number,
 $St$. For the micron-sized particles studied,
 $St<1$, and no rebounding occurs at collisions.
The dynamics of the problem, which is determined by the competing effects of collision frequency and arch stability, is studied in terms of dependence on  $St$. As the mean channel velocity (and hence
 $St$) increases, the collision frequency increases, acting to increase
 $P$, but the arch stability decreases, acting to decrease
 $P$. It is found that at low
 $St$, the collision frequency dominates, causing an increase in
 $P$ with
 $St$. At high
 $St$, on the other hand, the arch stability dominates due to quadratic scaling of hydrodynamic force with velocity, causing a decrease in
 $P$ with
 $St$.
With electrostatics, it is found that clogging is well represented by the relative strength of particle–wall adhesion to hydrodynamic force, or the wall adhesion number,  $Ad_w$. For
 $Ad_w \lesssim 4$, the purely mechanical dependence on
 $St$ is exhibited. In the region
 $4 < Ad_w < 20$, however, there is a transition to high clogging probabilities as sliding along, and then attachment to, the channel walls occur. For
 $20 \lesssim Ad_w$, there is a 95 % chance of clogging at
 $\bar {\phi }=0.01$, meaning effectively that clogging always occurs. For sufficiently large
 $w/d$ and low
 $Ad_w$, however, strong particle–particle adhesion can result in no clogging, since particle agglomeration towards the channel centre diminishes interaction with wall asperities and hence the probability of arching.
Distinct parametric regions of clogging – and the existence of regions of no clogging – also exist in the purely mechanical case in relation to  $w/d$. This dependence is governed by the variation in arch stability with
 $w/d$. A critical channel width
 $w/d^*=2.6$ in the purely mechanical case is reported, and with strong wall adhesion, this increases to
 $w/d^*=4$. The number of particles that form stable arches across a planar channel is determined to be
 $n= \lceil {w/d} \rceil + 1$.
Finally, as physics such as lubrication, electrostatics and rolling friction are added to numerical models of micro-particles, additional numerical parameters are introduced, including the lubrication and electrostatic inner cutoff distances. These parameters, however, require calibration to bulk rheological properties of micro-particles under electrostatic conditions. In the absence of such available experimental data, this work performs a sensitivity analysis to the numerical Coulomb friction coefficient. The greatest sensitivities occur in situations where the arch stability is lowest (high channel widths and strong particle agglomeration), while clogging becomes independent of friction for strong wall adhesion.
Supplementary movies
Supplementary movies are available at https://doi.org/10.1017/jfm.2023.214.
Funding
The authors gratefully acknowledge the support for this work, including from the Advance Queensland Industry Research Fellowship scheme (AQIRF1372018), National Energy Resources Australia (NERA), the University of Queensland (UQ) via an Australian Government Research Training Programme Scholarship and the proponents of the UQ Centre for Natural Gas (Australia Pacific LNG, Santos, and Arrow Energy). This work was undertaken with the assistance of resources and services from the National Computational Infrastructure (NCI) and the Pawsey Supercomputing Centre, each with funding from the Australian Government, with the latter also funded by the Government of Western Australia.
Declaration of interests
The authors report no conflict of interest.
Appendix
The method of determining a clogging probability using a finite number of trials,  $P=N_j/N_t$, is exact only in the limit as
 $N_t \rightarrow \infty$. Because of this, the log-odds function fitted to each parameter combination contains statistical uncertainty. In this appendix, the uncertainty of the
 $\bar {\phi }_{5}$ and
 $\bar {\phi }_{95}$ values is quantified utilising the bootstrapping method.
The premise of bootstrapping is that the data set at a particular parameter combination (comprising  $N_t$ Bernoulli trials that can assume a value of either 0 or 1) represents only a specific instance of all the possible sets,
 $2^{N_t}$, that could have been obtained. Many unique data sets at that parameter combination can then be sampled from the original data set, and the spread of these new sampled data sets is indicative of the spread of the original data. The method used here is as follows. First, a random sample of the original data set is taken, which is the same size as the original but allows repeats. Next, the new sample is fitted with the log-odds function of (4.1), as outlined at the beginning of § 4. This process is repeated to obtain many new data sets, which in turn give different log-odds curves. Finally, the lower 2.5 % and upper 97.5 %
 $\bar {\phi }$ values can be obtained to give the 95 % confidence interval (CI) for
 $\bar {\phi }$ at each
 $P$. It is important to stress here that the process does not involve any new simulations, but rather sampling the existing results to estimate the possible spread of
 $P$.
Figure 22 shows the results of this analysis for three different  $N_t$ at a particular parameter combination. The original fitted log-odds model is plotted, along with the lower 2.5 % and upper 97.5 %
 $\bar {\phi }$ values for a continuous range of
 $P$, with the shaded region representing the 95 % CI. At
 $P=0.05$ and
 $P=0.95$ the CI is explicitly depicted with error bars, representing the uncertainty of the
 $\bar {\phi }_{5}$ and
 $\bar {\phi }_{95}$ values. As
 $N_t$ increases the decrease in the size of the CI indicates a decrease in the uncertainty of the regression model.
Uncertainty of the regression model methodology for the parameter combination  $w/d=1.8$ and
 $St=0.1$. The uncertainty is quantified by the 95 % confidence intervals of
 $\bar {\phi }$ at each
 $P$, obtained via the bootstrapping method. As expected, increasing the total number of Bernoulli trials decreases the uncertainty, where (a)
 $N_t=10$, (b)
 $N_t=20$, and (c)
 $N_t=40$. The 95 % confidence intervals of the
 $\bar {\phi }_{5}$ and
 $\bar {\phi }_{95}$ values are depicted with error bars.

To demonstrate the uncertainty associated with some of the results presented in this study, in figure 23 the uncertainty quantification is applied to the case of varying  $G$ at
 $w/d=1.8$,
 $d={5}\ {\mathrm {\mu }}\textrm {m}$ and
 $\mu =1$ (figure 15(a) from § 4.1). In addition to
 $N_t=10$ used originally, two additional plots with
 $N_t=20$ and
 $N_t=40$ are obtained. At each data point, the error bars represent the 95 % CI of the
 $\bar {\phi }_{5}$ and
 $\bar {\phi }_{95}$ values. Note that the
 $\bar {\phi }_{5}$,
 $\bar {\phi }_{95}$ error bars at all
 $G={8}\ \textrm {MPa}\ \textrm {m}^{-1}$ match those obtained in figure 22, i.e. the bars in figure 23(a) at
 $G={8}\ \textrm {MPa}\ \textrm {m}^{-1}$ were obtained from those in figure 22(a).
Reproduction of the case of varying  $St$ at
 $w/d=1.8$ (originally figure 15a), with error bars indicating the uncertainty (as the 95 % CI) of the regression model predictions for
 $\bar {\phi }_{5}$ and
 $\bar {\phi }_{95}$. Increasing the total number of Bernoulli trials decreases the uncertainty, where (a)
 $N_t=10$, (b)
 $N_t=20$, and (c)
 $N_t=40$.


 Open access

