Introduction
Continuous transverse stub (CTS) arrays operating on the quasi-TEM mode are periodically arranged on parallel plate waveguides (PPW). They have good performances of high gain, broadband, and compact size [Reference Milroy1]. Iskander's group has presented some CTS arrays fed by coaxial and coplanar waveguide in TEM mode [Reference Isom, Iskander, Yun and Zhang2–Reference Li, Iskander, Zhang and Feng4]. However, due to the limitation of the feeding structure size, it is difficult to extend the radiation aperture for a higher gain.
To increase the transverse length of the feeding structure, the line source generator (LSG) for producing the in-phase quasi-TEM wave is necessary. Recently, different types of LSGs have been proposed, such as power dividers [Reference You, Lu, You, Wang, Huang and Lancaster5, Reference Lu, You, Wang, You, Huang and Wu6], parabolic reflectors [Reference Ettorre and Manzillo7, Reference Yang, Di, Yu and Gao8], and the grating lens [Reference Qiu, Yang, Yu, Lou, Yin and Gao9]. In [Reference You, Lu, You, Wang, Huang and Lancaster5] and [Reference Lu, You, Wang, You, Huang and Wu6], metallic power dividers transformed the electromagnetic wave of TE10 mode into the quasi-TEM mode for feeding the CTS array. The multi-stage structure in [Reference You, Lu, You, Wang, Huang and Lancaster5] made the longitudinal length of the LSG reach 6λ 0. The power divider composed of multiple T-junction structures in [Reference Lu, You, Wang, You, Huang and Wu6] had a size of 9.8λ 0 × 6.8λ 0. In [Reference Ettorre and Manzillo7], the metallic reflector converted the cylindrical wave generated by a metallic horn into the planar wave and the horn must be placed at the focal plane which was 10λ 0 away from the reflector. Ref. [Reference Yang, Di, Yu and Gao8] proposed a planar parabolic reflector LSG based on substrate integrated waveguide (SIW), while the reflector had a focal length of 5.7λ 0. Following this, a flat grating lens LSG was proposed, whose focal length was reduced to 2.4λ 0 [Reference Qiu, Yang, Yu, Lou, Yin and Gao9]. Due to the inherent characteristics of the parabolic reflector, the focal length is necessary. Lu et al. proposed a long LSG composed of ridged waveguide slot array for feeding the CTS array. The beam scanning characteristic was obtained by rotating the LSG with a length of 2.4λ 0, which required a large rotation space [Reference Lu, Gu, Wang, Liu and Lu10].
The dual-polarized (DP)-CTS array, which can improve the spectrum efficiency and channel capacity for a communication system, has attracted much attention in recent years. As a necessary part of the DP-CTS array, several kinds of DP-LSGs have been proposed. Lou et al. proposed two sets of orthogonal LSGs, whose dual-reflector structure has a complex structure and high profile [Reference Lou, Yang, Qiu, Yin and Gao11]. In [Reference Cheng, Wang and Liu12], Cheng et al. suggested two orthogonally arranged multi-stage power dividers whose size was 10λ 0 × 10λ 0 × 1.8λ 0. In [Reference Lu, Zhang, Gu, Liu, Wang and Lu13], the two orthogonal power dividers with three-stage structure were arranged on different layers for feeding the DP slot antenna. However, the multi-layer structure increased the depth of the DP-LSG. It could be found that all aforementioned DP-arrays were fed by two independent orthogonal linear-polarized (LP)-LSGs. Śmierzchalski et al. proposed a dual-mode DP-CTS array which was fed by only one parabolic reflector [Reference Śmierzchalski14, Reference Śmierzchalski15]. However, the long focal length made the longitudinal length of the antenna reach 17.5λ 0.
Due to the rotationally symmetrical gradient-index structure, the planar Luneburg lens can convert the cylindrical wave generated at any position of the edge into the planar wave at the opposite side [Reference Bosiljevac, Casaletti, Caminita, Sipus and Maci16]. By etching various periodic structures with different sizes on the metallic surface of the dielectric substrate, the required gradient refractive index could be obtained [Reference Chou, Tung and Ng Mou Kehn17, Reference Ebrahimpouri and Quevedo-Teruel18]. In [Reference Saleem, Vettikaladi, Alkanhal and Himdi19], a planar Luneburg lens pressed by drilling foam was proposed for steering 17 beams by using 17 planar feeding dipoles on the edge of the lens. In [Reference Lu, Liu, Liu, Ni and Lv20], a seven-beam planar lens composed of PPW with a curved upper surface could steer the beam by switching seven feed waveguides. These lenses can only steer beams to fixed directions, which were determined by the number of the feed structures. In [Reference Su and Chen21], a planar lens composed of 18-layer stacked periodic materials realized continuous beam scanning by moving a feed patch antenna. The feed patch was placed 1.5λ 0 away from the lens, so antenna system had a three-dimensional configuration. Inspired by the characteristics of the planar Luneburg lens, a printed circuit board-based substrate integrated lens (SIL) is suggested as the feed structure. The SIL consists of metamaterial cells of different sizes which are etched on the metal surface between two dielectric substrates.
Using this SIL, a compact LSG with a size of 3λ 0 × 3λ 0 × 0.12λ 0 is proposed. The SIL converts the cylindrical wave generated by SIW-horn at its edge into the planar wave at the opposite side to feed CTS array. This LSG can be conveniently extended to design the feed structures for the continuous beam scanning CTS array and the DP array. A 10-element beam scanning CTS array and a nine-element DP-CTS array have been designed and measured to verify the effectiveness of this novel compact LSG.
Comparing the performances of the published LSG of CTS array to our design, there are three contributions in the newly proposed LSG.
(1) The proposed SIL is first applied to the LSG for generating a line source to feed CTS arrays. Although various flat planar Luneburg lens have been mentioned in [Reference Bosiljevac, Casaletti, Caminita, Sipus and Maci16–Reference Su and Chen21], they are all radiating antennas. The SIL consists of metamaterial cells printed on the center surface of two substrate layers. The substrate integrated structure of SIL makes it possible to integrate with other printed radiating elements fed by line source.
(2) The novel SIL-based LSG is compact in size. Compared with the power divider LSG with multi-stage structure [Reference You, Lu, You, Wang, Huang and Lancaster5, Reference Lu, You, Wang, You, Huang and Wu6] and the parabolic reflector LSG with long focal length [Reference Ettorre and Manzillo7, Reference Yang, Di, Yu and Gao8], the SIL-LSG is the most compact one.
(3) The rotationally symmetric SIL can be conveniently used to design LSG for feeding CTS arrays with the continuous beam scanning and DP operations. Compared with DP-LSGs consisting of two independent orthogonal LP-LSGs in [Reference Lou, Yang, Qiu, Yin and Gao11–Reference Lu, Zhang, Gu, Liu, Wang and Lu13], the proposed DP-LSG uses the same SIL to generate orthogonal line sources, which effectively reduces the complexity of the antenna.
SIL-LSG structure
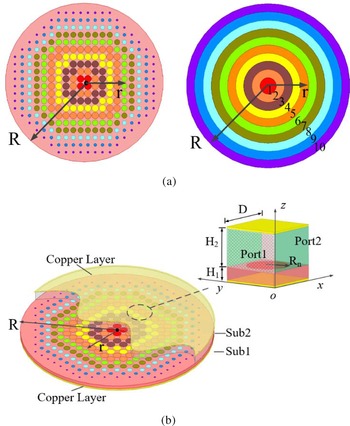
Figure 1(a) shows the top view of the planar circular SIL with radius R (1.5λ 0). To obtain the linear source at the opposite side of SIL and considering its compact size, the SIL is divided into 10 concentric annuluses. From the inner to the outside, the annuluses are numbered as 1, 2, …, 10. The corresponding gradient-index on every annulus can be achieved by using circular patches of different sizes.
Schematic diagram of SIL. (a) Top view. (b) Exploded perspective view and metamaterial cell.

Figure 1(b) shows the exploded perspective view of the SIL. The planar lens is stacked by Sub 1 with thicknesses H 1 and Sub 2 with thicknesses H 2. It should be noted that the two substrate layers are mechanically assembled by using nylon screws. The period of these small metamaterial cells is D. The cell has a circular patch which is printed on the middle surface of two layers, and the upper and the bottom surfaces of the cell are copper layers. The radius Rn represents the radius of the circular patch on the nth concentric annuluses. The input port 1 and output port 2 are located in plane x = 0 and plane x = D, respectively.
The equivalent refractive index of different size cells can be obtained by using the retrieval method of electromagnetic parameters [Reference Smith22]

where k 2 is the wavenumber in Sub2. The corresponding equivalent refractive index can be achieved by adjusting the radius of the small circular patch in each annulus. The refractive index of SIL should obey the Luneburg spatial position function
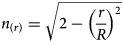
in which R is the radius of the lens, and r is the distance from any point to the center of lens, as shown in Fig. 1.
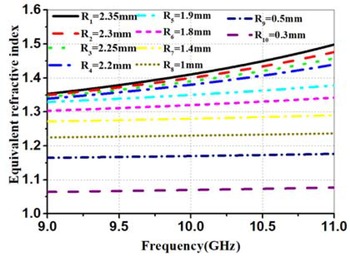
The SIL is designed by using Sub 1 with ɛr = 10.2, tanσ = 0.001, H 1 = 0.7 mm, and Sub 2 with ɛr = 2.65, tanσ = 0.0015, H 2 = 3 mm. Figure 2 shows the equivalent refractive index with different radius of circular patch of the metamaterial cells versus frequency when D = 5 mm. It can be seen that the index is closely related to the frequency and radius Rn. If the metamaterial cells have the same size, the refractive index will increase with frequency. At the same frequency, the refractive index increases with the radius Rn becoming large. Therefore, by adjusting the radius Rn of the circular metamaterial cell, the required refractive index can be obtained. Table 1 gives the equivalent refractive index of the different circular cells on every annulus at the central frequency of 10 GHz.
Equivalent refractive index with different radius of circular patch of the metamaterial cells versus frequency.

Equivalent refractive index with different radius of circular cells at the central frequency of 10 GHz

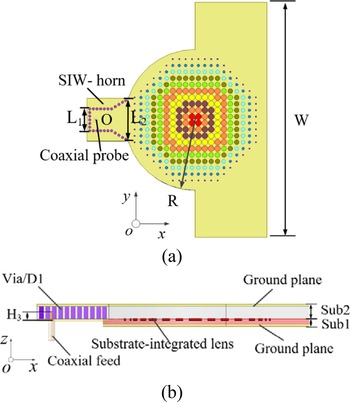
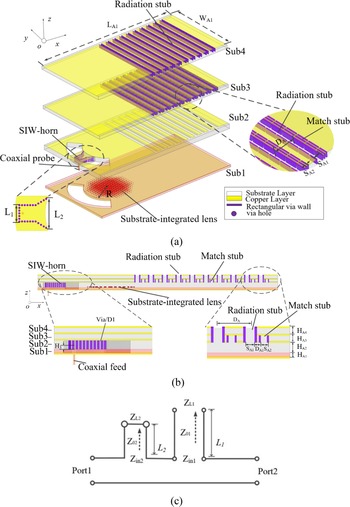
By using the proposed SIL, the compact LSG exciting planar wave for feeding CTS arrays is designed. As shown in Fig. 3, the LSG includes a SIL and a planar SIW-horn fed by a 50 Ω coaxial probe. The SIW-horn is located at the edge of SIL while the coaxial probe is inserted into the dielectric substrate at point O. The coaxial probe has the depth of H 3. The diameter of the periodical vias of the SIW-horn is denoted as D 1. The design of the SIW-horn should meet the requirement of the LSG. The width L 1 of the rectangular waveguide in SIW-horn is determined by the operation band [Reference Stutzman and Thiele23]. The appreciate aperture L 2 of the horn is chosen to minimize the phase difference of the line source generated by LSG.
Configuration of the SIL-LSG. (a) Top view. (b) Side view.

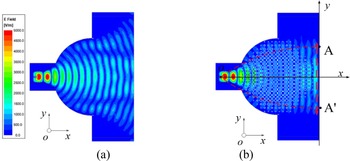
In this paper, all the simulations are carried out with the Ansoft High-Frequency Structure Simulator (HFSS) software. Figure 4 illustrates the electric field distribution of the LSG with and without the SIL. Obviously, the SIL changes the cylindrical wave excited by the probe into a planar wave. A nearly ideal line source has been produced at the opposite side of the SIW-horn. The phase and amplitude characteristics along reference plane AA′ are shown in Fig. 5. The amplitude distribution along reference plane AA′ still obeys the approximate cosine function, which is benefitting from the electric field of TE10 mode in the SIW-horn. Within the range of relative position 0.2–0.8, the maximum phase difference is <9.1°. It can be asserted that the proposed LSG will lead to a low side lobe radiation pattern when it is used to feed the CTS array [Reference Balanis24].
Electric field distributions of the LSG. (a) Without SIL. (b) With SIL.

Amplitude and the phase distributions of the electric field along reference plane AA′ on SIL.

The simulated reflection coefficient versus frequency of the SIL-LSG is shown in Fig. 6. The reflection coefficient is <−10 dB within 9–11 GHz, which shows a broadband performance.
Simulated reflection coefficient of the SIL-LSG.

CTS arrays fed by the proposed SIL-LSG
To validate the advantage of the proposed SIL-LSG, a LP CTS array with continuous beam scanning operation and a DP one are designed, simulated, and tested in this section.
Beam scanning CTS array fed by the SIL-LSG
The suggested LP-CTS array with continuous beam scanning is shown in Fig. 7. The SIW-CTS array is stacked by four substrate layers with two different permittivity. The high permittivity layer (Sub1) is fabricated by TF-2 with ɛr = 10.2, and tanσ = 0.001 and the low permittivity layers (Sub2, Sub3, and Sub4) are fabricated by F4B-2 with ɛr = 2.65, and tanσ = 0.0015. From the bottom layer to the top one, the thicknesses of the substrates are HA 1, HA 2, HA 3, and HA 4, respectively. Sub 1, 2 are the feeding layers, which have been illustrated in section “SIL-LSG structure”. Sub 3, 4 are the radiation layers with 10-element CTS radiation stubs. In Sub3, a match stub is added beside each CTS radiation stub and the upper surface of the match stub with the height of HA 3 is a metal plane.
Configuration of the LP beam scanning SIW-CTS array. (a) Exploded perspective view. (b) Side view. (c) Equivalent circuit of SIW-CTS element with match stub.

The function of the match stub can be explained by the equivalent circuit model shown in Fig. 7(c). According to the transmission line theory
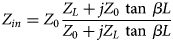
The radiation stub with open-circuited termination exhibits capacitance characteristic, which will deteriorate the impedance matching of the array. The reflection coefficient deteriorates seriously at the central frequency due to the in-phase reflection wave by every radiation stubs. In order to achieve impedance match, match stub with short-circuited termination, acting as an inductor, is added beside each radiation stub to compensate the capacitance. It should be noticed that the radiation stub and the match stub are composed of rectangular metallic-via wall instead of circle one for easy simulation and fabrication.
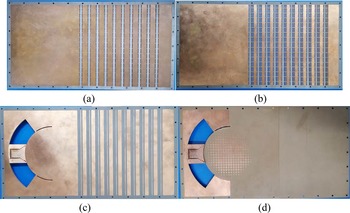
A 10-element array is designed to verify the beam scanning performance. Table 2 lists the dimensions of the CTS array. Figure 8 shows the photographs of the fabricated prototype. Through-holes are drilled around four substrate layers for fixing together using nylon screws. The measured thickness of the air gaps among stacked antenna layers mechanically assembled are <0.1 mm.
Photograph of the LP beam scanning SIW-CTS array. (a) Top and bottom surfaces of Sub 4. (b) Top and bottom surfaces of Sub 3. (c) Top surface of Sub 2. (d) Top surface of Sub 1 (SIL on Sub 1).

Parameters of the antenna array (unit: millimeter)

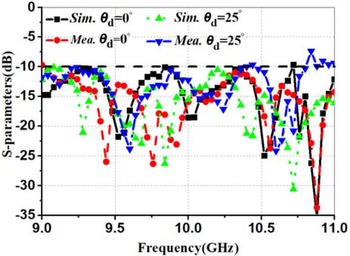
The measured and simulated reflection coefficients with different rotation angles of θd are plotted in Fig. 9. Due to the symmetry of the antenna array, only the results of the positive displacements of the SIW-horn are given. At the center position of θd = 0°, both the simulated and measured bandwidths with |S 11| <−10 dB are 20% (9–11 GHz). When the horn is rotated to 25°, the simulated and measured |S 11| <−10 dB are 20% (9–11 GHz) and 18% (9–10.8 GHz), respectively. It can be seen that both the measured and simulated |S 11| remain broadband even if the feed SIW-horn is rotated.
Simulated and measured reflection coefficients of the LP beam scanning SIW-CTS array.

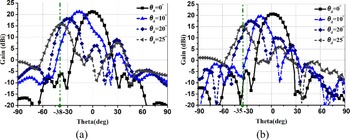
The radiation performance is measured in the anechoic chamber. The measured and simulated H-plane gain patterns with different SIW-horn rotation angles at the operation frequency of 10 GHz are shown in Fig. 10. The measured gain is 20.6 dBi at θd = 0°, which is lower (1.1 dB) than the simulated one. When the horn is rotated from 0° to 25°, the simulated and measured scanning angles with SLLs <−10 dB are 0° to −38° and 0° to −35°, respectively. The measured gain varies between 15.1 and 20.6 dBi. The simulation results found that the gain loss at the large scan angle is caused by the deterioration of the line source and the reduction of the radiation areas.
Radiation patterns of the LP beam scanning SIW-CTS array at the center frequency of 10 GHz. (a) Simulation. (b) Measurement.

It can be found from Fig. 10 that the measured beamwidths are narrower than the simulated ones when the horn rotates to 10°, 20°, and 25°. This measurement error is mainly caused by the undesirable air layer between any two substrate layers after simulations. At the above three scan angles, the measured 3 dB beamwidths are 13°, 18°, and 12°, respectively, while the simulated beamwidths with 0.1 mm air gaps are 14.6°, 20°, and 11.5°, respectively. The simulated beamwidths with 0.1 mm air layer are similar to the measured ones.
The simulated and the measured trends of H-plane scanning angle with the angle of the horn rotation are shown in Fig. 11. With the SIW-horn rotation angles increasing from 0° to 25°, the measured beam scanning angle changes nearly linearly from 0° to 35°. This feature makes the antenna array easy to realize the beam scanning function only by simply rotating the SIW-horn.
Simulated and measured H-plane scanning angles with the position of horn.

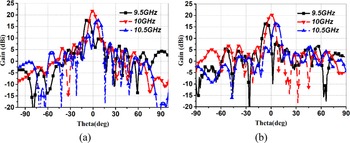
With the frequency varying, the phase difference of adjacent elements changes in E-plane, and beam squint might occur. When SIW-horn is at the center position, the simulated and measured radiation patterns of E-planes versus the frequency are plotted in Fig. 12. The measured beam squint is −6° at 9.5 GHz. When the frequency increases to 10.5 GHz, the beam squint is 7°.
Radiation patterns of the LP beam scanning SIW-CTS array versus frequency. (a) Simulation. (b) Measurement.

The experimental process causes the differences between the simulations and the measurements. The four layers are fixed together by nylon screws, which results in thin air layers between two adjacent layers. Moreover, during the horn rotation along the SIL, there will be a tiny gap between them. These thin air layers deteriorate the S-parameter and reduce the scanning angle.
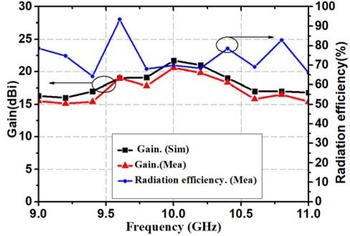
The gain and measured radiation efficiency of the LP beam scanning SIW-CTS array versus frequency are shown in Fig. 13. Within a broadband of 9–11 GHz, the peak gains are all higher than 15 dBi with the highest one of 20.6 dBi at 10 GHz. The measured radiation efficiency of the array, denoted as η, is given by

where Gmeas is the measured gain, and Dsim is the simulated directivity. It can be seen that the measured radiation efficiency is over 65% within the operation bandwidth. The simulated and measured aperture efficiencies are 42.6 and 36.1%, respectively.
Gain and measured radiation efficiency of the LP beam scanning SIW-CTS array prototype versus frequency.

DP-SIL-LSG for feeding DP-CTS array
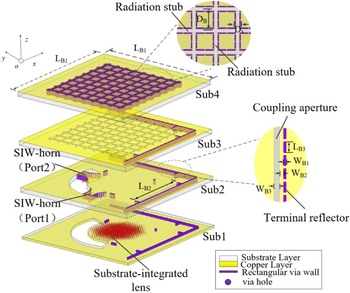
The SIL-LSG can be conveniently extended to design a DP feed structure (i.e., DP-SIL-LSG) for a DP-CTS array. Figure 14 shows the configuration of the proposed DP-CTS array, which is also stacked by four dielectric substrates. Benefiting from the symmetrical characteristic of the SIL, two sets of orthogonal feeding structures can be combined into one, which makes the array compact and the profile low. Sub 1 and Sub 2 are the same as those of Sub 1 and Sub 2 for SIL. Sub 3 and Sub 4 are the same dielectric substrates as Sub 2.
Configuration of the DP SIW-CTS array.

Sub 1, 2 are the feeding layers. As the main part of DP-SIL-LSG, SIL is located at the center of Sub 1. Two SIW-horns are orthogonally etched on the edge of SIL to excite DP operation. The coupling apertures are etched on the upper surface of Sub 2, and the terminal reflector composed of rectangular metal vias pass through feeding layers. Due to the introduction of terminal reflector, the feed layer and radiation layer of DP array can be located in different layers, which significantly reduces the size of the antenna. Assisted by the terminal reflectors, the coupling apertures couple planar wave from DP-SIL-LSG to the DP radiation layer composed of Sub 3 and Sub 4. In Sub 4, two orthogonal nine-element CTS arrays are used to form a common aperture DP-CTS.
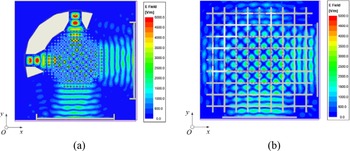
Figures 15(a) and 15(b) show the electric field distributions in Sub 2 and Sub 3, respectively. It can be seen from Fig. 15(a) that, the cylindrical waves generated by two orthogonal SIW-horns are converted into planar waves on their opposite sides after passing through SIL. Through the combined action of the terminal reflector and the coupling aperture, two orthogonal planar waves generated by DP-SIL-LSG are well coupled to Sub3.
Electric field distributions of (a) Sub 2. (b) Sub 3.

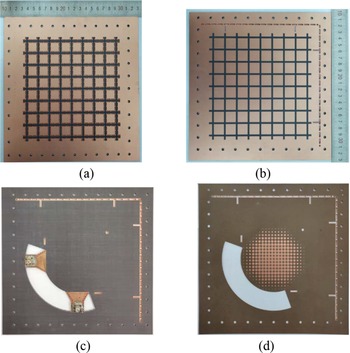
To verify the effectiveness of the proposed compact DP-SIL-LSG, a nine-element DP-CTS was fabricated and measured. Figure 16 shows the photographs of the fabricated antenna. The final parameter values are shown in Table 3.
Photographs of the DP SIW-CTS array prototype. (a) Top and bottom surfaces of Sub 4. (b) Top and bottom surfaces of Sub 3. (c) Bottom surface of Sub 2. (d) Top surface of Sub 1 (SIL on Sub 1).

Parameters of the antenna array (unit: millimeter)

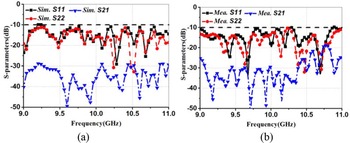
The measured and simulated reflection coefficients and isolation versus the frequency are plotted in Fig. 17. According to the measured results, the −10 dB reflection coefficient bandwidth of ports 1 and 2 are both <−10 dB from 9 to 11 GHz. Within this frequency range, the measured isolation between the two ports is higher than 20 dB. At high-frequency band (10.5–11 GHz), the measured isolation is a little lower than the simulated one. These discrepancies are mainly caused by the permittivity error of the dielectric substrate and the fabrication error.
S-parameters versus frequency of Port 1 and Port 2. (a) Simulation. (b) Measurement.

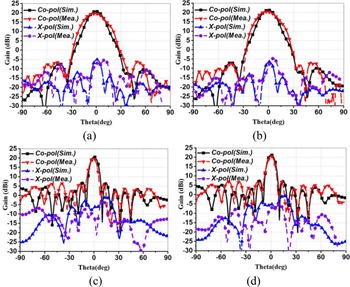
The whole antenna was simulated, fabricated, and measured. During the simulation and measurement, when one feeding port is fed, the other one is connected to a 50 Ω match load. The measured and simulated radiation patterns of H- and E-planes of ports 1 and 2 are presented in Fig. 18. For port 1, the measured gain at 10 GHz is 19.8 dBi with the cross-polarization levels of −30.3 dB in E-plane and that of −26.5 dB in H-plane, respectively. For port 2, the measured gain at 10 GHz is 20.3 dBi with the cross-polarization levels of −27.5 dB in E-plane and that of −29.2 dB in H-plane, respectively. The measured gains and cross-polarization deteriorate a little, which are mainly caused by the fabrication errors and assembly errors.
Simulated and measured radiation patterns for Ports 1 and 2. (a) H-plane for Port 1. (b) H-plane for Port 2. (c) E-plane for Port 1. (d) E-plane for Port 2.

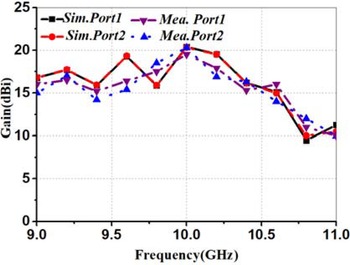
The simulated and measured gains of Port 1 and Port 2 versus the frequency are shown in Fig. 19. Within a broadband of 9–10.5 GHz, the measured gains of both ports are all higher than 15 dBi with the highest one of 20.3 dBi at 10 GHz. The relative refractive index of the metamaterial cell changes with frequency while the SIL is designed according to the center frequency of 10 GHz. When the operation frequency is higher than 10.5 GHz, the electromagnetic wave fed into DP-CTS is no idea longer a planar wave, resulting in a significant decrease in antenna gain.
Simulated and measured gain of Port 1 and Port 2.

Table 4 summarizes the performances of the published DP-CTS arrays and our design. Ref. [Reference Lou, Yang, Qiu, Yin and Gao11] proposed a CTS array that achieved beam-scanning range of ±40° in the elevation by rotating Riley prism. The CTS array used two independent parabolic reflector structures to generate orthogonal line sources for feeding the DP-CTS array. In [Reference Cheng, Wang and Liu12], the CTS array fed by two separate orthogonal power dividers, and the multistage structure made CTS array complex and large. Based on the two modes of TEM and TE1, a multi-beam DP-CTS fed by only one parabolic reflector was proposed [Reference Śmierzchalski14]. However, the long focal length made the longitudinal length of the antenna reach 17.5λ 0. Compared with these DP-CTS arrays, the proposed DP-CTS array fed by SIL-LSG has characteristics with compact size and low profile.
Performance comparisons of DP-CTS array

λ 0 is the wavelength at the center frequency.
Conclusion
In this paper, a novel compact LSG, namely SIL-LSG, is proposed by combining SIW-horn with SIL. Through the phase adjustment of SIL, the cylindrical wave generated by the SIW-horn is converted into planar wave for feeding CTS array. The scanning and the dual-feeding ability of the SIL-LSG are verified by two sets of CTS arrays with simulation and measurement results. The LP beam scanning SIW-CTS array has the maximum gain of 20.6 dBi at the center frequency of 10 GHz and its H-plane main beam can steer from −35° to 35° by rotating the SIW-horn. The measured gain of the DP-CTS at the center frequency is 20.3 dBi and the cross-polarization level is <−25 dB. The proposed compact SIL-LSG proves to be a good candidate as the feeding structure of the CTS antenna arrays.
Acknowledgement
This work was supported by the Natural Science Foundation of China under Grant NO. 61771300.
 Houtong Qiu obtained M.S. in electrical engineering from the Shandong University of Science and Technology, Qingdao, China, in 2016. He is currently pursuing Ph.D. at Shanghai University, Shanghai, China. His current research interests include beam scanning antenna and base station antenna.
 Xue-Xia Yang (M'05-SM'17) obtained B.S. and M.S. from Lanzhou University, Lanzhou, China, in 1991 and 1994, respectively, and was awarded a Ph.D. in electromagnetism and microwave technology from Shanghai University, Shanghai, China, in 2001. From 1994 to 1998, she was a teaching assistant and a lecturer in Lanzhou University, China. From 2001 to 2008, she was a lecture and an associate professor in Shanghai University, China. She is currently a professor and the head of the Antennas and Microwave R&D Center at Shanghai University. She has authored and coauthored over 180 technical journal and conference papers. She is also a frequent reviewer for over 10 scientific journals. Her research interests include antennas theory and technology, computational electromagnetics and microwave power transmission. She is now a member of the Committee of Antenna Society of China Electronics Institute and a senior member of China Electronics Institute. She is an associate editor for the Journal of Shanghai University (science edition).
 Zixuan Yi (M'20) obtained B.S. in electronic engineering and information science from the University of Science and Technology of China, Hefei, China, in 2014, and a Ph.D. in electronic science and technology from the University of Science and Technology of China, Hefei, China, in 2016. He is currently a lecturer with the School of Communication and Information Engineering, Shanghai University. His research interests include antenna arrays, high power microwave wireless power transfer, and microwave circuits.
 Meiling Li (M'20) obtained B.S. in electronic information engineering from Anhui University, Hefei, China, in 2010, and a Ph.D. in electronic science and technology from the University of Science and Technology of China, Hefei, China, in 2016. She was a postdoctoral researcher with the Department of Electronic Engineering and Information Science, University of Science and Technology of China. She is currently a lecturer with the School of Communication and Information Engineering, Shanghai University. Her research interests include antennas, frequency selected surfaces, absorbing materials and structures, and wireless power transfer.