Introduction
Cognitive impairment is a frequent feature of geriatric depression and often persists despite the remission of depressive symptoms (Bhalla et al., Reference Bhalla2006; Butters et al., Reference Butters2008). Longitudinal studies demonstrated persistent cognitive impairment or a significantly increased incidence of Alzheimer's disease (AD) in remitted geriatric depression (RGD) patients (Wilson et al., Reference Wilson2002). Moreover, commonalities have been evident between RGD and amnestic mild cognitive impairment (MCI) patients (Bai et al., Reference Bai2012). These studies initially revealed the specific neural substrates linking RGD with cognitive impairment in the elderly. However, in the context of RGD, the neural correlates of this relationship are still poorly understood.
Converging findings from previous neuroimaging studies have suggested the default-mode network (DMN) as a potentially useful biomarker for major depressive disorder (Greicius et al., Reference Greicius, Srivastava, Reiss and Menon2004; Zhu et al., Reference Zhu2012; Li et al., Reference Li2013). The DMN is a large-scale network that encompasses a specific set of brain regions, including posterior cingulate cortex/precuneus (PCC/Pcu), medial prefrontal cortex, and medial, lateral, and inferior parietal regions, which indeed demonstrate a consistent pattern of deactivation during the initiation of task-related activity (Raichle et al., Reference Raichle, MacLeod, Snyder, Powers, Gusnard and Shulman2001). This network is suggested to mediate internally generated thought process, episodic memory (Greicius et al., Reference Greicius, Srivastava, Reiss and Menon2004), and attention (Sorg et al., Reference Sorg2007), which have been shown to be aberrant in patients with major depression. Investigations of DMN properties are typically conducted during resting-state to avoid confounds from task-related effort and performance. On the one hand, the majority of previous studies have reported increased neural activity and functional connectivity (FC) of the DMN in individuals with major depression (Sheline et al., Reference Sheline, Price, Yan and Mintun2010; Hamilton et al., Reference Hamilton, Chen, Thomason, Schwartz and Gotlib2011; Li et al., Reference Li2013; Hwang et al., Reference Hwang2016). On the other hand, decreased FC of the DMN has also been revealed in major depression (Bluhm et al., Reference Bluhm2009). Likewise, in the study of Zhu et al. (Reference Zhu2012), they reported increased FC in the anterior DMN but reduced FC in the posterior aspects of the DMN in patients with major depression.
Although these findings are partially inconsistent, reporting that both increased and decreased FC, the overall conclusion is that altered DMN connectivity and activity seem to occur in depression. However, most of previous studies included acutely depressed patients and did not provide further insight into their persistent abnormalities. More importantly, it should be emphasized that the DMN changes in depression may present in a complex way, not as pure increases or decreases (Northoff et al., Reference Northoff, Heinzel, De Greck, Bermpohl, Dobrowolny and Panksepp2006; Broyd et al., Reference Broyd, Demanuele, Debener, Helps, James and Sonuga-Barke2009). In fact, several previous studies have demonstrated that both whole-brain and sub-brain functional networks possess efficient small-world properties at a low cost (Bullmore and Sporns, Reference Bullmore and Sporns2009). Importantly, growing evidence have suggested that brain disorders are associated with an altered topological architecture of a disrupted network of brain regions. For instance, patients with geriatric depression showed a disrupted topological organization in a large-scale brain network (Bai et al., Reference Bai2012; Ajilore et al., Reference Ajilore, Lamar, Leow, Zhang, Yang and Kumar2014; Tadayonnejad and Ajilore, Reference Tadayonnejad and Ajilore2014). Together, we performed a prospective study using resting-state functional magnetic resonance imaging to investigate the altered FC pattern of DMN in patients with RGD. Furthermore, we sought to determine whether the topological configuration of the DMN in RGD maintains a normal configuration or is disrupted in some way.
Materials and methods
Participants
In total, 33 RGD patients and 31 healthy control (HC) participants were recruited in the present study. RGD patients were recruited from Affiliated Hospital of Jiangsu University (Zhenjiang, China). HC participants were recruited through community health screening. All RGD patients met the following inclusion criteria: (1) they had previously met the major depression criteria in DSM-IV and remitted for more than 6 months before the enrollment; (2) the age of first depressive onset was over 60 years; (3) Hamilton Depression Rating Scale (HDRS) scores were lower than 7, and Mini-Mental State Examination (MMSE) scores were higher than 24; (4) duration of illness must be less than 5 years and a medication-free period for all patients was longer than 3 months prior to the assessment; (5) absence of other major psychiatric disorder, including abuse or dependence of psychoactive substances; (6) absence of primary neurological illness, including dementia or stroke; (7) absence of medical illness impairing cognitive function; (8) no history of electroconvulsive therapy; (9) no gross structural abnormalities on T1-weight images, and no major white matter changes such as infarction or other vascular lesions on T2-weight MRI. All participants were aware of the purpose of the study before participating in this study and signed an informed consent form approved by the Ethics Committee of Affiliated Hospital of Jiangsu University.
Neuropsychological tests
All participants were administered a battery of neuropsychological tests that covered multiple cognitive domains, including the auditory verbal learning test-20min delayed recall (AVLT-DR), rey-osterrieth complex figure test (CFT) and its 20min-delayed recall (CFT-DR), clock drawing test (CDT), trail-making tests A and B (TMT-A and TMT-B), digit span test (DST), and symbol digit modalities test (SDMT).
Image acquisition
All participants were scanned using a 1.5-T MRI scanner (General Electric Medical Systems, USA) with a homogeneous birdcage head coil. During the scanning, participants were instructed to lie still with their eyes closed and not to fall asleep. Functional images were obtained axially using a single-shot, gradient-recalled echo-planar imaging sequence parallel to the line of the anterior-posterior commissure. The following parameters were applied for functional imaging: 142 whole-brain volumes; repetition time = 3000 ms; echo time = 40 ms; flip angle = 90°; acquisition matrix = 64 × 64; field of view = 240 × 240 mm2; thickness = 4.0 mm, without gap.
Image preprocessing
All imaging preprocessing steps were conducted using Data Processing Assistant for Resting-State fMRI (DPARSF, http://www.restfmri.net/forum/dparsf). The first ten volumes were discarded for scanner stabilization and participants’ adaption to the scanning noise. The remaining images were corrected for acquisition delay between slices and for head motion. Participants should have no more than 3 mm maximum displacement in x, y, or z and 3° of angular motion during the scan acquisition. The head motion profiles were matched between the two groups (p > 0.37 in any direction). Then, the resulting images were spatially normalized into the Montreal Neurological Institute (MNI) echo-planar imaging template and resampled to 3 × 3 × 3 mm3. Subsequently, the functional images were spatially smoothed with an isotropic Gaussian kernel (FWHM = 8 mm). Ultimately, these data were filtered by using a band-pass filter (0.01–0.1 Hz) to reduce the effect of low-frequency drift and high-frequency noise. Any linear trend was further removed.
Independent component analysis (ICA) and localization of the DMN
Independent component analysis (ICA) is a method for blind source signal separation and has been widely used to identify and quantify distributed patterns or spatial networks of correlated activity (Greicius et al., Reference Greicius, Srivastava, Reiss and Menon2004; Bai et al., Reference Bai2011; Zhu et al., Reference Zhu2012). Spatial ICA was conducted for each group using the Informix algorithm in the Group ICA of fMRI Toolbox software (GIFT, http://icatb.sourceforge.net/). There are three main stages of group ICA: data reduction, independent component (IC) separation, and back reconstruction. Briefly, the number of ICs was estimated by using the minimum description length criteria. Then, the common ICs were acquired over all participants after IC separation using the Infomax algorithm, and back reconstruction of the ICs was conducted based on the above results. Finally, the ICs of the DMN were selected according to the templates offered by GIFT.
After being extracted from all participants, the best-fit components representing the DMN were gathered in each group separately for a random effect analysis using the one-sample t-test. Thresholds were set at p < 0.05 (false discovery rate [FDR] correction). Then, to avoid the bias for any group, we selected the regions based on the conjunction analysis of the DMN between the RGD and HC groups. To investigate whether patients with RGD display abnormal topological organization of the DMN, we defined regions of interest (ROIs) as nodes by parcellating the common FC map into separate ROIs using the Automated Anatomical Labeling (AAL) template (Tzourio-Mazoyer et al., Reference Tzourio-Mazoyer2002).
Graph theoretical analysis
Construction of functional brain networks
The application of the parcellation processing method to the common FC map generated 43 brain regions overall. To eliminate the effect of small clusters, we excluded 22 regions that included fewer than 100 voxels; the resulting 21 regions (Table S1, Figure 2) were used to define the nodes of DMN. First, we calculated mean time series in each ROI. By using a multiple linear regression model, the nuisance signals involving six head motion parameters, global mean signal, cerebrospinal fluid signal, and white matter signal were removed from the mean time series. For each subject, we then computed Pearson correlation coefficients between the mean time series of all possible pairs of 21 regions, yielding a 21 × 21 correlation matrix.
In this study, our graph theoretical analysis is confined to a simple undirected and unweighted binary matrix. Each absolute correlation matrix was thresholded into a binary matrix with a fixed sparsity level, S (i.e. the ratio between the number of existing edges and all the possible edges). Setting a sparsity threshold ensured that graphs from the two study groups had the same number of edges (Achard and Bullmore, Reference Achard and Bullmore2007; Zhang et al., Reference Zhang2011). As there is no gold standard for threshold selection, we investigated the properties of the networks over a wide range of values from 0.16 to 0.34 using increment of 0.01. This range of sparsity was selected to estimate small-world properly as suggested in previous studies.
Measures of functional brain networks
Network parameters were selected based on previous reported associations with depression and included measures of local inter-connectivity (i.e. clustering coefficient and local efficiency) and global-connectivity (i.e. characteristic path length and global efficiency). Briefly, the clustering coefficient Cp quantifies the extent to which neighboring brain regions are connected with each other. The characteristic path length Lp quantifies the average number of connections between regions along the shortest paths. The small-worldness of a network is traditionally characterized by the clustering coefficient and the characteristic path length (Watts and Strogatz, Reference Watts and Strogatz1998). In a small-world network, the clustering coefficient is significantly higher than that of random networks (γ = C realp/Cp rand > 1), while the characteristic path length is comparable to random networks (γ = L realp/Lp rand ≈ 1). Furthermore, as graph theoretical approaches have developed, alternative metrics based on network efficiency (Latora and Marchiori, Reference Latora and Marchiori2001) have received growing attention. The local efficiency E loc quantifies the extent of local cliquishness of information transfer of a network, whereas the global efficiency E glob quantifies the ability of parallel information propagation of a network (Wang et al., Reference Wang2013). Respectively, the high local and global efficiency indicates more efficient information transmission over a local and global network.
Statistical analysis
Behavioral data
To increase statistical power by reducing random variability, a composite score analysis was utilized, as previously introduced (Shu et al., Reference Shu2016). First, for each neuropsychological test, the raw scores for each subject were converted to z scores according to the means and standard deviations of the scores for all participants. Second, the composite scores were calculated by averaging the z scores within the neuropsychological domains listed below. The episodic memory domain included the AVLT-DR and CFT-DR. The executive function domain included the DST and TMT-B. The processing speed domain included the SDMT and TMT-A. The visuospatial skills included the CFT and CDT. Group differences were investigated using a multivariate general linear model, with age, gender and years of education as covariates.
Network Metrics
Non-parametric permutation tests (Bullmore et al., Reference Bullmore, Suckling, Overmeyer, Rabe-Hesketh, Taylor and Brammer1999) were applied to determine the statistical significance of the differences in network parameters (i.e. Cp, Lp, E loc, and E glob) between the two groups. First, we calculated the between-group difference in the mean value of each network metric over the range of sparsity thresholds. To test if the observed group differences could occur by chance (the null hypothesis), we randomly reassigned all participants to two groups and recomputed the mean differences between the two randomized groups. This randomization procedure was repeated 10,000 times, and a randomized null distribution based on between-group differences in each metric was created at each threshold. Then, the 95th percentile point of the distribution was used as the critical value for a two-tail test of the null hypothesis. Of note, before the permutation tests, multiple linear regression analyses were applied to remove the confounding effects of age, gender and years of education for each network metric.
Brain–behavioral relationship
We further examine the relationship between these network measures (both FC and network metrics) and neuropsychological performances within the RGD group, regressing out the influence of age, gender and years of education.
Results
Demographic data and behavioral results
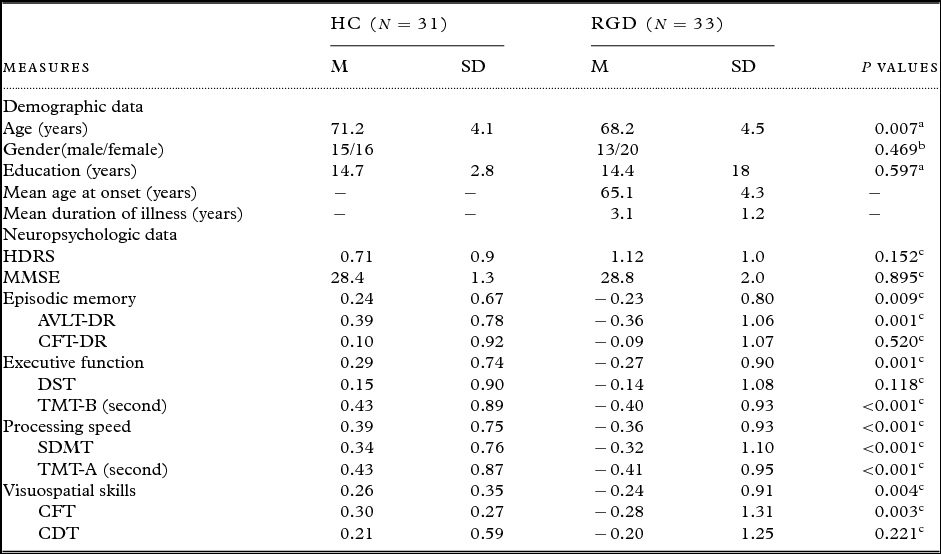
Demographic information and clinical evaluations for all participants are shown in Table 1 and Table S2. Although no significant between-group differences in the years of education and gender distribution, the two groups were not matched for age (it should be noted that the age effect was removed in all of the following neuropsychological and network analyses). Compared with HC group, the RGD group performed significantly worse in the episodic memory (p = 0.009), executive function (p = 0.001), processing speed (p < 0.001), and visuospatial skills (p = 0.004).
Demographic and neuropsychological data for all participants

Data are presented as mean (M) ± standard deviation (SD).
Abbreviations: RGD, remitted geriatric depression; HC, healthy controls; HDRS, Hamilton Depression Rating Scale; MMSE, Mini-Mental State Exam; AVLT-DR, auditory verbal learning test-delayed recall; CFT-DR, rey-osterrieth complex figure test-delayed recall; DST, digit span Test; TMT, trail-making test; SDMT, symbol digit modalities Test; CDT, clock drawing test.
a Independent-sample t-test.
b Chi-squared test.
c Analysis of covariance (ANCOVA).
DMN identification
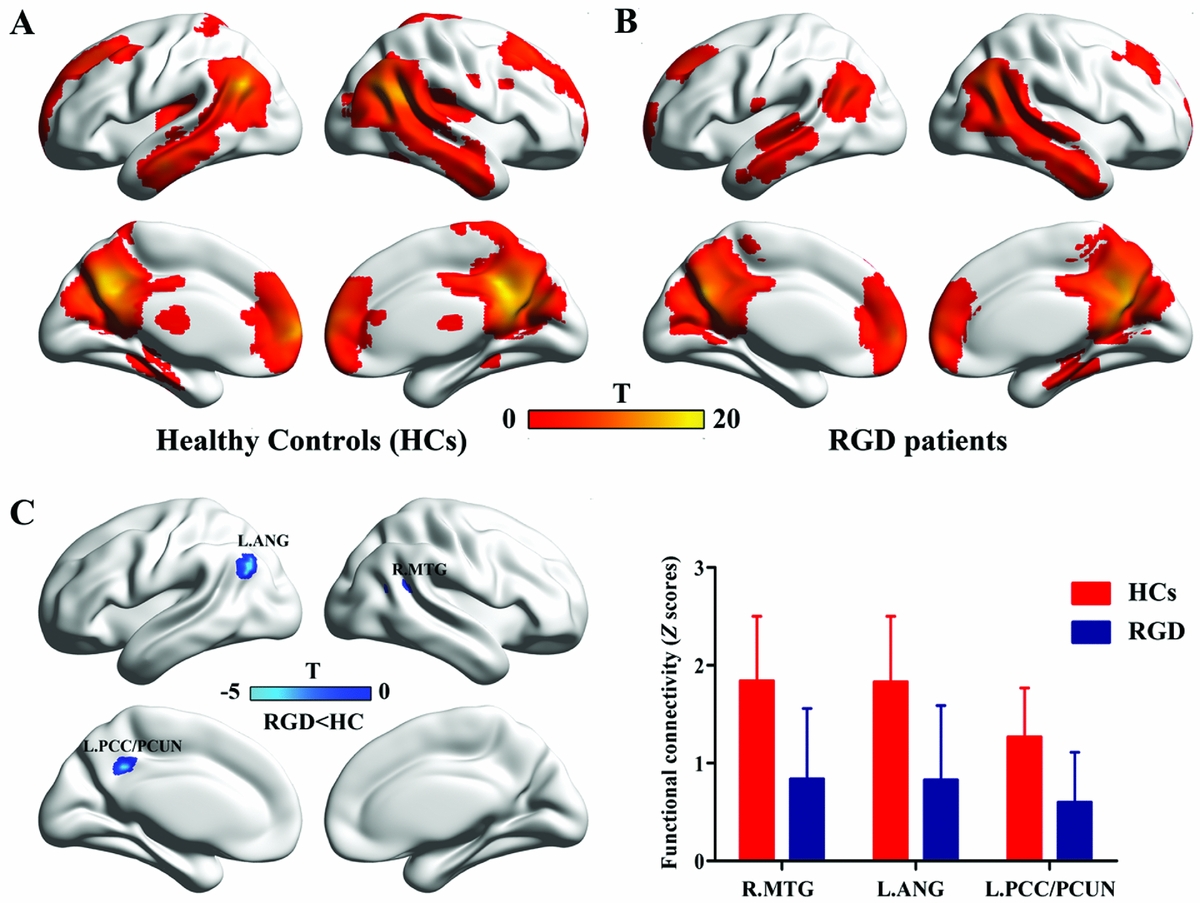
One-sample t-tests (p < 0.05 with FDR correction) revealed the respective spatial pattern of the DMN in the RGD patients and HC participants (as shown in Figure 1A and B). Increased FC was identified in the PCC/Pcu, medial prefrontal cortex, inferior parietal lobule, and lateral temporal cortex in both groups, which correspond to the typical distribution of the DMN. Furthermore, the between-group differences were shown in Figure 1C and Table 2 (p < 0.05, FDR corrected). Compared with the HC participants, the RGD patients showed decreased FC in the left PCC/Pcu, left angular gyrus (AG), and right middle temporal gyrus (MTG). In the contrast with this finding, there were no clusters that showed significantly greater FC in the RGD group when compared with the HC group.
Decreased default-mode network functional connectivity in patients with RGD. Images of group default-mode functional connectivity in healthy controls (A) and in RGD patients (B). The contrast map in (C) demonstrates that the RGD patients showed significantly decreased functional connectivity in the posterior cingulate cortex/precuneus (PCC/Pcu), angular gyrus (AG), and middle temporal gyrus (MTG) relative to the healthy controls (p < 0.05 with FDR correction). The pictures and following brain maps are shown on the surface of the brain using the BrainNet Viewer software (http://www.nitrc.org/projects/bnv). RGD, remitted geriatric depression; FDR, false discovery rate.

Decreased functional connectivity of DMN in RGD patients compared with HC participants

The threshold was set at p < 0.05 (FDR corrected).
Abbreviations: DMN, default-mode network; RGD, remitted geriatric depression; MNI, Montreal Neurological Institute; R: right; L: left.
*The voxel resolution is 3 × 3 × 3 mm3.
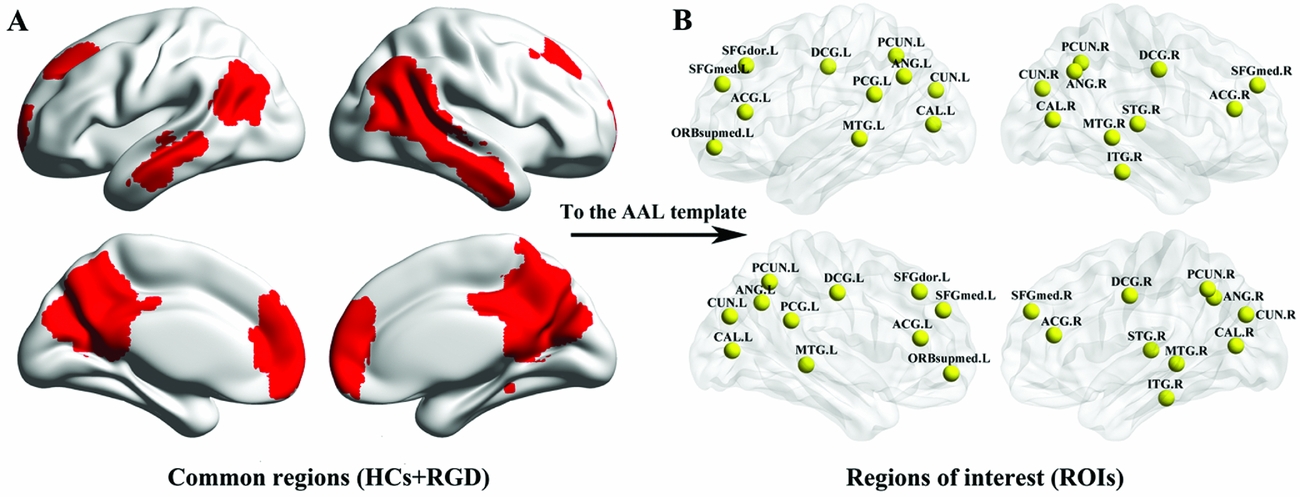
Furthermore, based on the conjunction analysis, the clusters across the two groups included the majority of the regions found individually in each group (Figure 2A). The conjunctions were then categorized into 21 ROIs by using the AAL template (Figure 2B).
Regions of interest. The common FC map was parcellated by using the automated anatomical labeling (AAL) template. See Table S1 for a list of the regions common to both groups. RGD, remitted geriatric depression; HCs, healthy controls; FC, functional connectivity.

Network topological properties
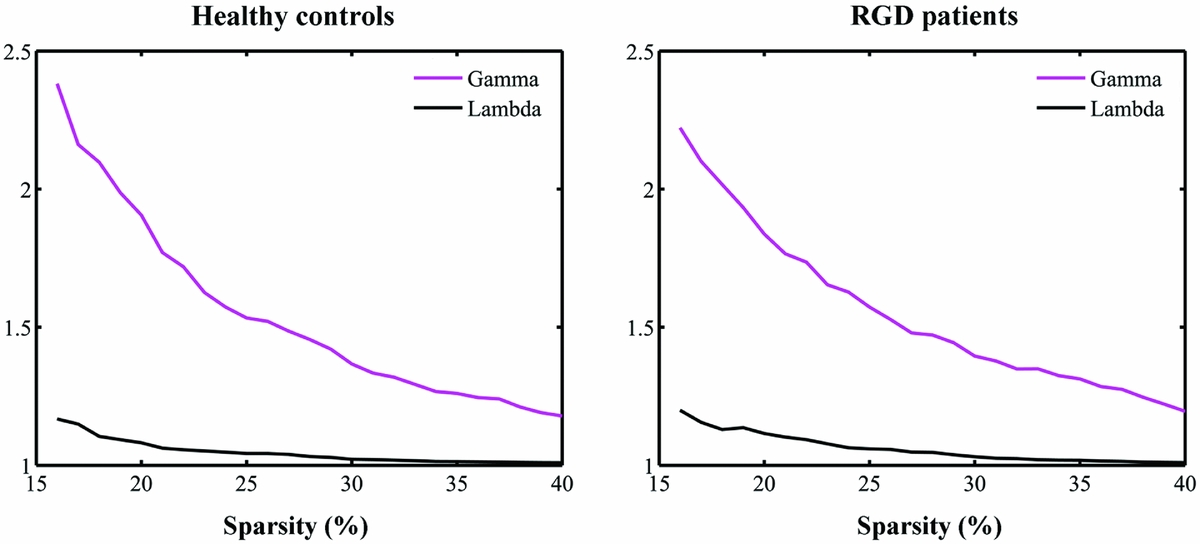
The DMNs of both HC and RGD groups showed small-world properties with higher clustering coefficients (i.e. γ > 1) but almost identical characteristic path length (i.e. λ ≈ 1) in comparison with comparable random networks (Figure 3).
Small-world properties of DMNs in HC and RGD groups. The graphs show the changes in the γ (C realp/Cp rand) and λ (L realp/Lp rand) in healthy controls (left) and RGD patients (right) as a function of sparsity thresholds. All the networks have γ > 1 and λ ≈ 1, which imply small-world properties. DMN, default-mode network; HC, healthy control; RGD, remitted geriatric depression.

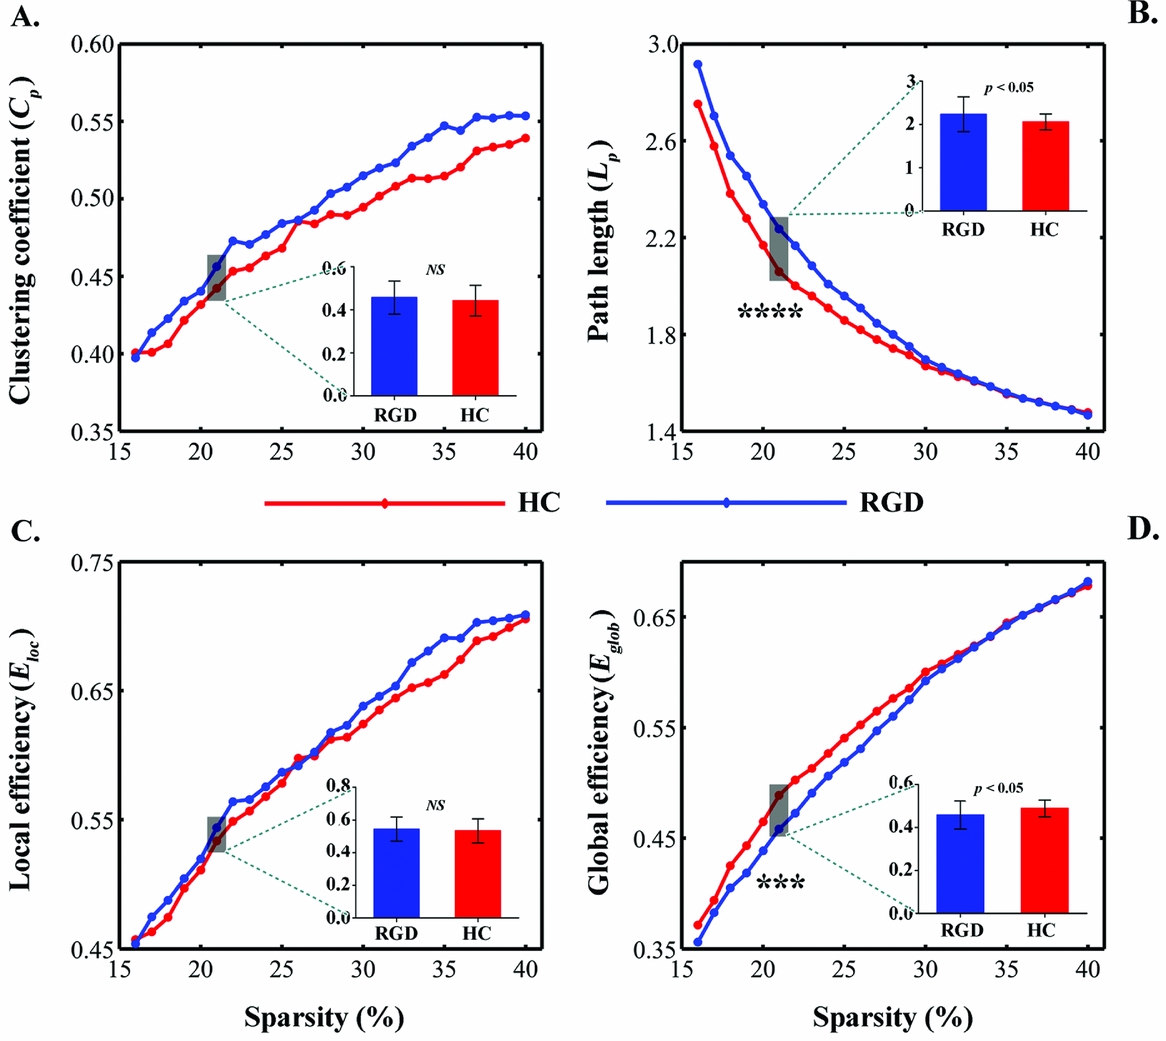
Despite common small-world architecture, statistical analyses revealed significant differences in both small-world parameters and network efficiency between the RGD patients and HC participants. Compared with the HC group, the RGD group showed increased characteristic path length Lp over a wide range of thresholds (19% ≦ S ≦ 22%) (Figure 4B). However, there was no significant between-group difference in the clustering coefficient Cp (Figure 4A). In addition, significant reductions in global, but not in local, efficiency were also observed in the RGD group over a wide range of thresholds (20% ≦ S ≦ 22%) (Figure 4C and D).
Graphs show small-world parameters and network efficiency of the DMN. Clustering coefficient (A), characteristic path length (B), local efficiency (C) and global efficiency (D) of the RGD (blue line) and HC (red line) groups as a function of sparsity thresholds. Black asterisks (*) indicate the significantly statistical difference between the RGD and HC groups (permutation testing, p < 0.05). The inset barplot indicates the statistical differences between groups at S = 0.21 (permutation testing, p < 0.05). DMN, default-mode network; RGD, remitted geriatric depression; HC, healthy controls; S, sparsity; NS, no significant.

Correlation with behavioral measures of cognitive function
Within the RGD group, linear correlation analyses indicated that the FC of the left PCC/Pcu and right MTG were related to the processing speed (r = 0.447, p = 0.001; r = 0.431, p = 0.002) and executive function (r = 0.476, p < 0.001; r = 0.447, p = 0.001). We further examined the correlations between the topological parameters and neuropsychological performance at a selected threshold (e.g. S = 21%). Likewise, the network metrics were found to be significantly associated with the processing speed (Lp: r = −0.317, p = 0.025; E glob: r = 0.335, p = 0.018) and executive function (Lp: r = −0.328, p = 0.020; E glob: r = 0.351, p = 0.013).
Discussion
This present study sought to evaluate disease-associated changes in FC and topological architecture of the DMN in patients with RGD. Combining ICA and graph-theory approaches, two principal findings emerge from this study. First, compared to HC participants, the RGD patients showed decreased FC in the more posterior regions of the DMN. Second, the RGD patients showed abnormal global topology of the DMNs (i.e. increased characteristic path length Lp and reduced global efficiency E glob) relative to HC participants. Importantly, these network measures were correlated with the performance on neuropsychological tests. The present study provided evidence for disrupted FC and topological organization of the DMN in RGD, and further implied their contribution to cognitive deterioration in RGD patients.
Decreased functional connectivity of the DMN in patients with RGD
The status of default network is believed to be intimately related with episodic processes (Greicius et al., Reference Greicius, Srivastava, Reiss and Menon2004) and the processes of sensorimotor, spatial and attention (Sorg et al., Reference Sorg2007). Interestingly, the present RGD patients were observed to have impaired cognitive function across multiple domains (i.e. episodic memory, executive function, processing speed, and visuospatial skill). This is consistent with earlier reports that remitted depression had persistence of cognitive impairment (Devanand et al., Reference Devanand2003; Nebes et al., Reference Nebes2003). Most importantly, the current data showed that reduced FC in posterior regions of the DMN (i.e. PCC/Pcu, AG, and MTG) in RGD patients, and less FC in these areas, especially in PCC/Pcu and MTG, was associated with inferior cognitive performances. Previous studies have revealed that deficits of these posterior DMN regions from structural and functional MRI were observed in depression (Alves et al., Reference Alves2012; Gaffrey et al., Reference Gaffrey, Luby, Botteron, Repovs and Barch2012; Jing et al., Reference Jing2013; Ma et al., Reference Ma2012). Additionally, in the study of Zhu et al. (Reference Zhu2012), they also reported reduced FC in posterior regions of the DMN (e.g. PCC/Pcu and AG) in patients with major depression using the ICA method. Our findings are compatible with these studies and provide new evidence for reduced FC within the DMN of RGD patients, and further support the notion that the posterior DMN is involved in the pathophysiology of cognitive dysfunction in RGD.
Altered topological organization of the DMN in RGD
The small-world is an attractive model for the description of complex brain networks because it not only supports both specialized and integrated information processing (Sporns and Zwi, Reference Sporns and Zwi2004) but also minimizes wiring costs while maximizing the efficiency of information propagation (Kaiser and Hilgetag, Reference Kaiser and Hilgetag2006; Achard and Bullmore, Reference Achard and Bullmore2007). In this study, the small-world properties of the DMNs were found in both RGD and HC groups, consistent with a recent study of episodic memory in a MCI (Wang et al., Reference Wang2013) and supporting the notion that disease-specific brain networks still possess small-world properties (Bassett and Bullmore, Reference Bassett and Bullmore2009).
Recently, brain networks in depression have been investigated by applying the theoretical framework of graph theory to neuroimaging data. Specifically, in patients with geriatric depression, several studies have reported abnormal small-world organization in the whole-brain connectome, as characterized by increased characteristic path length and reduced global efficiency (Ajilore et al., Reference Ajilore, Lamar, Leow, Zhang, Yang and Kumar2014; Gong and He, Reference Gong and He2015). In agreement with these studies, we also found that patients with RGD showed increased characteristic path length and decreased global efficiency of the DMNs, which indicated a less optimal organization of the sub-network. The global efficiency quantifies the ability of parallel information propagation of a network. Therefore, reductions in global efficiencies reflect a disrupted global integration of the DMNs in RGD patients. Moreover, short path lengths ensure interregional effective integrity and prompt transfer of information in brain networks, which constitutes the basis of the cognitive process (Sporns and Zwi, Reference Sporns and Zwi2004). Thus, the disease-related increases in the characteristic path length may be attributable to the disrupted FC of the DMN. Together, these findings indicate that patients with RGD who exhibited disrupted topological organization might be unable to properly coordinate the cognitive resources mediated by the DMN.
Methodological issues
There are several issues that should be addressed. First, this is a cross-sectional study at a single time point and had a relatively small sample size. Thus, the findings cannot be considered categorical. Replication of these findings in a large cohort will be necessary for validation. Second, given that all patients were depression-free in the present study, these findings may reflect features which are either a consequence of the previous disease or are a constituent part of the brain organization in participants vulnerable to geriatric depression. Third, given that all patients have received various antidepressant treatments, the results could not exclude a potential medication effect.
Despite these limitations, we believe that this study gives a new insight into the characteristics of the state of the brain organization affected by a relatively long history of geriatric depression.
Conclusion
In summary, this present study investigated the topological properties of the DMNs in patients with RGD using the resting-state fMRI, and provided further support for the notion that disease-specific brain networks still possess small-world properties. More importantly, RGD patients showed abnormal global topology of the DMNs (i.e. increased characteristic path length and reduced global efficiency), implying a less optimal organization of the network in RGD. In addition, these network metrics were significantly associated with the neuropsychological performances. These results highlight the important role of the DMN in the pathophysiology of RGD and contribute important insights concerning the neurobiological mechanisms that might underlie cognitive deficits in this disorder.
Conflict of interest
None.
Description of authors’ roles
Yan Zhu assisted with the experimental design and wrote the paper. Yuefeng Li aided with the participants’ collection and carrying out the statistical analysis. Dongqing Wang was responsible for the neuropsychological tests. Zhe Liu assisted with the analysis and interpretation of the image data for this paper, and with writing the paper.
Acknowledgments
This work was partly supported by the Projects of the National Natural Science Foundation of China (grant number 61402204), the Program for Zhenjiang social development (grant number SH2016029/SH2017014), the Program for Jiangsu Province health department (grant number Q201605), Jiangsu Provincial Key Research and Development Plan (BE2017698), Project of Jiangsu Provincial Young Medical Talents (QNRC2016832/QNRC2016460).
Supplementary material
To view supplementary material for this article, please visit https://doi.org/10.1017/S1041610218000054