

Introduction
Unlike what a classical rational decision-making model might lead us to expect, young adults’ educational choices are not just influenced by future earnings and costs, but also by social image effects (i.e., their beliefs about the kinds of approval or sanction they will encounter from their peers or other reference groups if they make a certain choice; Bursztyn & Jensen, Reference Bursztyn and Jensen2017). Furthermore, people, and especially young people, have been shown to hold biased beliefs about the attitudes and behaviors of their peers relative to their own attitudes and behaviors (Ross et al., Reference Ross, Greene and House1977; Henry et al., Reference Henry, Kobus and Schoeny2011). These findings might lead policy-makers to conclude that informing young adults about their peers’ true attitudes and behaviors would help them make more informed (and in that sense better) educational choices.
However, young people may not be aware that their educational choices are influenced by (their perceptions of) their peers, and that simply priming people to think about their peers may itself increase the influence of the peers. In other words, the mere mention of peers may create an effect, whereas the information may be disregarded if the young adults do not believe that they consider their peers at all when making educational choices. This would be consistent with dual-process models of thinking. These models suggest that the reflective mode of thinking, which is associated with the rational decision-making model and is often referred to as System 2, is just one mode of thinking. The other mode, System 1, is autonomously engaged in processing inputs and does so fast and effortlessly on the basis of intuitions and associations (Stanovich & West, Reference Stanovich and West2000; Kahneman & Frederick, Reference Kahneman and Frederick2002; Kahneman, Reference Kahneman2011). If the influence from peers found in previous research works through a System 1 process, then adolescents may be unaware of this influence. In that case, priming students to think of peers may influence their educational preferences without them being aware of it.
To study the influence of peers on educational preferences, we conducted a series of survey experiments. In the first experiment among eighth- and ninth-grade students, we tested whether simply priming students to think about their peers’ preferences changed the way they assessed the important educational choice they were facing, namely choosing between vocational schools and college-preparing high schools. The priming experiment did not change other factors that might influence students’ educational preferences: the priming did not change the economic cost or benefits associated with these two educational paths, it did not affect the peers’ attitudes and the peers did not observe the respondents’ stated preferences. The only thing that was manipulated was students’ thinking about their peers’ attitudes toward these educations. Yet we found that the students’ own attitudes toward the educations (how much they liked each of them) shifted in the direction of how they perceived their peers’ attitudes.
A number of follow-up studies examined whether students acknowledge this influence of their peers. First, we asked students which factors they thought mattered most to their educational choice. Here, in accordance with the rational decision-making model, factors such as lifetime earnings came out at the top, whereas peers where listed as the least important factor. Then, we used a conjoint experiment that asked them to choose between two fictitious educations, randomly varying a number of characteristics of the two educational options, A and B. Conjoint experiments are designed to parcel out which characteristics are most important in multiple-component decisions (Hainmueller et al., Reference Hainmueller, Hopkins and Yamamoto2014). Again, lifetime earning was among the most important variables, whereas information about popularity among peers had no influence on their choice. We further demonstrate the robustness of this peer neglect result by replicating the study in a separate, less urbanized sample where peers might have a stronger influence on deliberate choices. However, this did not turn out to be the case. To validate the measures of educational preferences, we show that 99.4% afterwards chose the kind of education they stated as their preference in the survey. Finally, to test whether the previous results were driven by social desirability bias, we used a list experiment, which is designed to elicit socially undesirable attitudes (Sniderman, Reference Sniderman2011). The list experiment conducted on students who had already chosen their secondary education refuted this concern.
Each of these methods has strengths and weaknesses, but all of the replications and robustness checks consistently showed that young people did not deliberately place any emphasis on the preferences of their peers. The results are consistent with the dual-process model of thinking in which the rational decision-making factors such as lifetime earnings enter the conscious System 2 mode of thinking, whereas the influence of peers on educational preferences may go more unnoticed in a System 1 mode. The results have implications for the way policies may be designed to inform students about different educational choices.
Theories of educational choice and existing evidence
Since young adults’ choice of education is one of the most important choices they make in their lives – education impacts desirable outcomes ranging from earnings (Autor, Reference Autor2014) and health (Buckles et al., Reference Buckles2016) to citizenship (Lochner, Reference Lochner2011) and marital options (Lafortune, Reference Lafortune2013) – it should be a prime case for rational decision-making. However, recent research has demonstrated that the basic model of rational decision-making may need some amendments. In this section, we first present the basic rational decision-making model. We then move on to a model and empirical research that include social image effects. Finally, we present our proposed elaboration of this model, in which we include the possibility that the influence of social image from any specific reference group may depend on whether students are primed to think about that specific group.
Classical model of educational choice
For decades, educational choice and its antecedents and drivers have been studied intensively in various literatures. Inspired by human capital investment models (Mincer, Reference Mincer1958), early educational choice models focus on how individuals make rational assessments about educational choices based on the costs and returns associated with choosing a particular education. Typically, the focus is on the resulting lifetime earnings. The optimal level of education, generally referred to as action, ã, is then found by weighing the marginal benefits, B, against the marginal costs, C, of the education:
 $$ {\tilde a} = B - C + \varepsilon, $$
where ε is a random variable. The cost of an education can include direct costs (e.g., tuition fees) and the opportunity cost of foregone employment and effort. The benefits of pursuing an education can both be pecuniary (i.e., lifetime earnings) and non-pecuniary (e.g., social benefits). One of the early insights in this area was that individuals need to make this assessment over the full life cycle (Becker, Reference Becker1964; Ben-Porath, Reference Ben-Porath1967; Page & Scott-Clayton, Reference Page and Scott-Clayton2016).
The first direct schooling models furthermore emphasize that the optimal choice of education depends on ability, family background, non-pecuniary benefits and future expected earnings, at least when making the choice of pursuing a college education (Rosen, Reference Rosen and Ehrenberg1977; Willis & Rosen, Reference Willis and Rosen1979). These economic models of educational choice have developed with different foci, such as the general discrete choice models that typically incorporate all of the above-mentioned factors and also seek to take the sequential decision problem in educational choice into account (Keane & Wolpin, Reference Keane and Wolpin1997; Keane et al., Reference Keane, Todd, Wolpin, Ashenfelter and Card2011).
In contrast to this classical rational education decision-making model, Barone et al. (Reference Barone2017) find that Italian high school students’ expectations about college costs and future earnings are “systematically biased, highly inaccurate, and only partially updated over the final high school year.” Other studies find that information and support in the application process improved enrollment, but not information in itself (Bettinger et al., Reference Bettinger2012; see also Castleman et al., Reference Castleman, Page and Schooley2014). Furthermore, as we will discuss in the next section, new research has shown that the effect of education-relevant information may also depend on the social context in which it is delivered.
Social image effects
The influence of social image concerns – especially the influence of peers – has been a focus in an extension of the basic cost–benefit human capital investment model (Equation (1) above). Bursztyn and Jensen (Reference Bursztyn and Jensen2017) suggest a model that adds a social image component to the classical model:
 $$ {\tilde a} = B - C + \lambda _jE( {w_j} ) {\rm Pr}(\sigma = h \vert a) + \varepsilon. $$
Pr(σ = h | a) is the probability that the reference group, j, will perceive the individual's type as h, which could be high (in terms of educational effort, scholastic abilities or other relevant types) given that the individual chooses the action (or attitude) ã. E(w j) is the individual's expectations about how socially desirable, w, the group j will see h. λ j captures how much utility the individual gets from being seen as h by group j.Footnote 1
By experimentally manipulating the probability that different peer groups will observe the individual's action (signing up for free access to an SAT preparatory course), Bursztyn and Jensen (Reference Bursztyn and Jensen2015) show that students react to the probability of being seen as a high-effort type depending on the reference group present (peers in either honors or non-honors classes). If the decision to sign up for the course was made public among the peers in the class, fewer signed up in the non-honors classes than when it was private. It made no difference in the honors classes. The effect was more pronounced among the students who were both in honors and non-honors classes. These results indicate that the peers who are around the students at the exact moment they decide to sign up for the course have consequences for their otherwise important educational choices.
This peer influence among youth also seems to have a neural foundation. It can be explained by the emergence of an imbalance in the development of the subcortical relative to the prefrontal cortical systems in the teenage brain – an imbalance that neither children nor adults have. The subcortical systems mature faster during these years, while the less mature prefrontal control systems are still developing (Casey et al., Reference Casey, Jones and Somerville2011). The subcortical systems can be equated to the socio-emotional system, while the prefrontal cortical systems have been termed the cognitive control system (Steinberg, Reference Steinberg2008; Steinberg et al., Reference Steinberg2009).
The result of this imbalance in the teenage brain is that a young person may act in sensitive, risk-prone and reward-seeking ways during this period of their lives – especially around peers (Steinberg & Monahan, Reference Steinberg and Monahan2007; Albert et al., Reference Albert, Chein and Steinberg2013). Therefore, peers have a very large influence on adolescents in general and also on educational choices and attainment (Haller & Butterworth, Reference Haller and Butterworth1960; De Giorgi et al., Reference De Giorgi, Pellizzari and Redaelli2010; Fletcher, Reference Fletcher2015; Carbonaro & Workman, Reference Carbonaro and Workman2016; Skov, Reference Skov2016; Rosenqvist, Reference Rosenqvist2018). The peer effect can even be so subtle (yet life-threatening) that it emerges without the adolescents knowing who the peers are; the belief that some peer is watching them is enough to cause reward-seeking behavior (Weigard et al., Reference Weigard2014). This underlines the possibility of an unnoticed peer effect in educational choice as well.
Attention to social image
Implicit in existing research is that different reference groups (e.g., peers, friends, family and teachers) influence attitudes and actions. Austen-Smith and Fryer (Reference Austen-Smith and Fryer2005) propose a model in which individuals simultaneously balance concerns for two reference groups (employers and peers). The Bursztyn and Jensen (Reference Bursztyn and Jensen2017) model focuses on just a single reference group, j, at a time (for good reason, since their focus is on other aspects of the model).
However, people may not have the cognitive capacity to evaluate an action against all relevant reference groups, let alone all cost and benefit factors, at the same time. Dual-process theories of reflective and intuitive thinking suggest that human thinking can be divided into two main categories: intuition and reflection, labeled ‘System 1’ (the associative or intuitive mode) and ‘System 2’ (the reflective mode) (Stanovich, Reference Stanovich1999; Stanovich & West, Reference Stanovich and West2000; Kahneman & Frederick, Reference Kahneman and Frederick2002; Kahneman, Reference Kahneman2011). Research on general priming effects has shown how subtle reminders of – even irrelevant – considerations may affect people's judgments (Higgins, Reference Higgins, Higgins and Kruglanski1996; Andersen & Hjortskov, Reference Andersen and Hjortskov2016; Hjortskov, Reference Hjortskov2017). One central finding has been that people tend to focus more on recent experiences or present circumstances than experiences made a while ago because they are more available to the mind. This is sometimes called the availability heuristic (Tversky & Kahneman, Reference Tversky and Kahneman1973; Schwarz et al., Reference Schwarz1991). Based on this strand of research, we propose that the influence of social image from different reference groups on educational attitudes and choices is also weighed with the attention, ρ j, given to each reference group in the situation when the attitude is formed or the decision made:
 $$ {\tilde a} = B - C + \rho _j\lambda _jE( {w_j} ) {\rm Pr}(\sigma = h \vert a) + \varepsilon. $$
With limited attention span, people cannot give full attention to all reference groups at the same time. Priming young people to think about a specific reference group may therefore not necessarily become a deliberate part of their cost–benefit calculation in a System 2 fashion, but may enter their thinking in a System 1 mode (e.g., using an availability heuristic). One of the purposes of the experiments that we now turn to is to examine whether students are reflective about the influence of any peer social images.
Context and participants
Danish public schools are funded and regulated by multipurpose local governments (Nielsen, Reference Nielsen2014, p. 148). Schooling (or at least education) is compulsory from kindergarten to the ninth grade. After that, students can choose between vocational schools or college-preparing upper secondary (high) schools (or attend an extra, voluntary year in tenth grade before continuing in the educational system).Footnote 2
We run Studies 1–3 on a sample of eighth- and ninth-grade students in an urbanized area, the city of Aarhus, which is the second largest city in Denmark. Nine schools were recruited for the project, and they enrolled 18 eighth-grade classrooms, 22 ninth-grade classrooms and one classroom with students with special needs. In total, 645 students responded to the survey.
We replicate Study 3 in a separate, less urbanized sample to test whether the results change for students with different peer groups. In the municipality of Vejen, six public schools were recruited for this data collection, and 17 eighth-grade classrooms and 14 ninth-grade classrooms participated. In total, 458 student answers were recorded.
To assess the validity of the educational preferences measured in the surveys in Studies 1–3, we gained access to data on the students’ actual choice of education one year later. Most of the respondents had at that point not yet chosen their education, because the eighth-grade students attended the mandatory ninth grade and some of the ninth-grade students continued in the voluntary tenth grade (52.7% of our sample chose to do so in 2018 – the share for the country as a whole was 46.2%; Undervisningsministeriet, 2018).Footnote 3 However, 181 respondents had started in high school or vocational school. Of these 181 students, 180 (99.4%) started in the type of education that they stated as their preferred option in the surveys. This suggests that the preferences stated in the surveys are closely related to real educational behavior.
Study 4 is a list experiment used to examine whether social desirability bias prevents students from admitting that peers influence their choice of education. Thus, for this study, we used students who had already made their educational choice and had started a vocational education. Two vocational schools were recruited; one for technical education and one for welfare education. In total, 23 classrooms participated and 343 students responded to the list experiment.
Online Qualtrics surveys were used to randomize participants into the different experimental conditions described below. The surveys in Studies 1–3 took approximately 30 minutes to answer and contained various questions about the students’ background and well-being. Students completed the surveys in the two months preceding the deadline for registering for secondary education. The survey for students in vocational education (Study 4) took approximately 40 minutes to complete. The students filled out the surveys in the classroom.
Study 1: peer priming effects
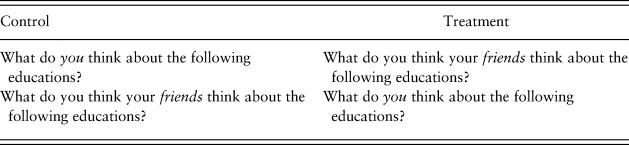
The first experiment aims to test whether students are influenced by being reminded of their own expectations (E) of their peers’ assessment (w peers) of two educational tracks. The two tracks are the ones that the students can choose between after completing compulsory schooling: the vocational and the college-preparing high school tracks. Priming works by making some factors more accessible than others when facing an evaluation. Priming can be induced by varying the question order in a survey (Higgins, Reference Higgins, Higgins and Kruglanski1996; Hjortskov, Reference Hjortskov2017), thereby changing the (reflective or intuitive) attention (ρ j) given to a factor – in this case, a reference group. If students change their evaluations of certain educations as a result of the mere mention of their peers and making them think (intuitively or reflectively) about their peers’ attitudes toward the education, the peers may thus have an implicit influence on the students’ choices.
Based on the social image-attention model (Equation (3)), we would expect that priming students to think about their social image, E(w j), would create an interaction effect between attention, ρ j, and perceived social image. Because ρ peers is randomly assigned to students, it is uncorrelated (in expectation) with E(w peers) and ε. Therefore, the interaction term coefficient is an unbiased estimate of the causal effect for different levels of E(w peers). This can be thought of as a subgroup effect: within the subgroup of students who expect their friends to have a positive view of high schools, priming students to think about their peers has a causal effect on the students’ own views. However, we cannot be sure that changing the peers’ attitudes (or the students’ perceptions of these attitudes) would have a causal effect, since peers’ attitudes may not be exogenous (Nizalova & Murtazashvili, Reference Nizalova and Murtazashvili2016).
We note that priming the students to think about their peers does not affect any of the other factors in the model. Asking students ‘What do you think your friends think about the following educations?’ does not provide students with new information, does not affect the peers’ evaluations of different educations or the social image they project (w peers), nor does it change the probability that other students will know the respondents’ own response (Pr(σ = h|a).
Table 1 illustrates the design of the experiment. For both types of education (i.e., vocational school and college-preparing high school), students were asked to indicate how much they themselves as well as their peers liked these educations on a five-point scale: ‘Dislike very much’; ‘Dislike’; ‘Neither like nor dislike’; ‘Like’; ‘Like very much’.
The design of the priming experiment.

Study 1: results
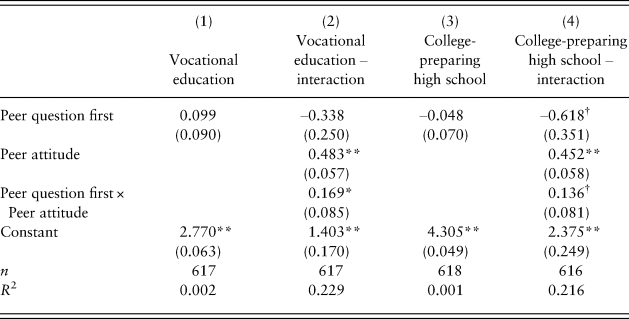
Table 2 reports the results from the priming experiment. Models 1 and 2 report the results of regressing the students’ own attitudes toward vocational programs on an indicator of the question order. Models 3 and 4 report the results of the effect of question order on the students’ attitudes toward college-preparing high school.
Results from reminding students about the attitude of their peers.

Ordinary least squares models with the students’ own attitudes toward the education as the dependent variable (scaled 1 (‘Dislike very much’) to –5 (‘Like very much’)). Standard errors in parentheses.
† p < 0.1; *p < 0.05; **p < 0.01.
Model 1 shows that there is no average effect on the student's own attitudes toward vocational education when just mentioning the peers and asking about their attitudes. This is not surprising since the direction of the effect should be expected to be dependent on the perception (E(w)) of peers’ attitudes toward the specific education (w peers). This is tested in Model 2, where an interaction between the treatment – mentioning peers and asking about their attitudes before asking about the students’ attitudes – and the perceived peers’ attitudes is introduced. The interaction is significant, which means that if the perceived peers’ attitudes are positive, mentioning them first results in a more positive evaluation of the vocational education than if the peers’ attitudes are mentioned second. Therefore, the interaction estimate of 0.17 represents the (positive) change in the slope of the correlation between peers’ attitudes and own attitudes by changing the question order from peer question last to peer question first. The interaction term is significant at the 5% level.
Models 3 and 4 test the same (question order) treatment among the same students, but with attitudes toward college-preparing high schools as dependent and independent variables instead. Again, there is no direct question-order effect in Model 3, but there is a significant interaction term in Model 4, albeit only at the 10% level. The coefficient is 0.14, which means that the slope of the correlation is steeper when the peers’ attitudes are mentioned first. In other words, the students’ attitudes toward upper secondary education are influenced in the direction of the peers’ attitudes when the peers are mentioned first, just like in the vocational education case (Models 1 and 2).
Study 2: reflective attitudes
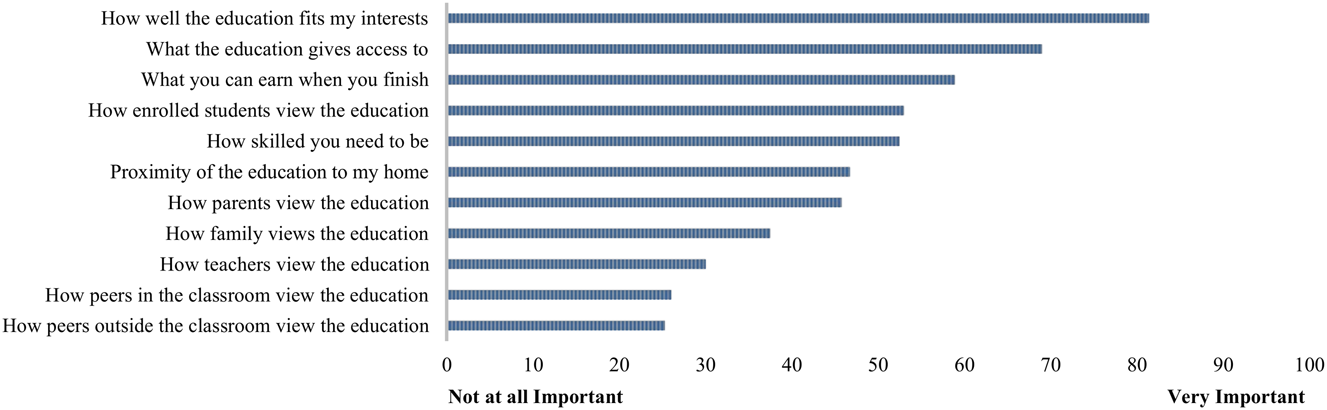
To examine whether the students are knowledgeable about the influence of peers on their own attitudes toward different educations, we first asked them directly what influence they would say different factors and individuals have on their educational choice on a scale from 0 (‘Not at all important’) to 100 (‘Very important’). The results are presented in Figure 1.
Importance of different actors/factors in the educational choice.
Note: Answers to the question: “How important are the following persons and factors to your educational choice?” The answer form was a slider from 0 (‘Not at all important’) to 100 (‘Very important’). Aarhus sample (n = 483–533).

The results show that peers inside as well as outside the classroom come out at the bottom, being rated as least important for their choice. While this does not directly contradict the findings in the priming experiment (other factors could be more important), it is remarkable how little importance students are willing to ascribe to their peers. Another explanation could be that social desirability bias prevents students from responding honestly to the question about peers (a System 2 effect) or that they underestimate the influence of their peers because they do not notice it (a System 1 effect).
Study 3: comparing multiple educational characteristics
To test the effect of peers when students were asked to choose between two specific educations, we carried out a conjoint experiment. Conjoint experiments present respondents with two (or more) alternatives (called profiles), such as two educations, each characterized by a number of attributes, such as lifetime earnings or peer popularity. Respondents are asked to choose one profile. Since they do not have to reveal which of the attributes determined their choice, conjoint experiments can reduce social desirability bias (Hainmueller et al., Reference Hainmueller, Hopkins and Yamamoto2014, p. 3). A fundamental advantage of conjoint experiments compared with classical experiments is that it is possible to vary a large set of variables and to assess their individual effects on one or more dependent variables instead of just varying one or two variables as in typical experiments.
Hainmueller et al. (Reference Hainmueller, Hopkins and Yamamoto2014) advance a contemporary causal inference perspective on conjoint experiments with a focus on the fundamental assumptions, causal quantities and statistical analysis of the results in these experiments. One assumption is no carryover effects. This means that students’ potential outcomes remain stable across the choice tasks and that a different order of appearance would not change the results. Information in one task should not affect other choice tasks, meaning that there are no period effects. The assumption would be violated if, for example, students base later choices or ratings on information given in an earlier task.
This assumption can be tested by comparing the results between the different choice tasks and testing whether they are different. If so, the no carryover effects assumption has been violated. We present the results of such tests in Appendix A. The assumption is tested by first plotting the main results by the five tasks that students were asked to complete. The resulting coefficient plots can be seen in Figures A.1 for Vejen and A.2 for Aarhus. Furthermore, we test the joint significance of the interaction between attribute levels and task number (Tables A.1 and A.2). Only one of these quite conservative tests turn out to be significant: the lifetime earnings for the Aarhus sample. Overall, since 1 out of 12 tests is expected to be significant at a 10% level, this reassures us that the no carryover effects assumption holds.
Another assumption is that there are no profile order effects. Students are not expected to make different choices based on the order of the different profiles (educations) they are presented with in a given task, even though the attributes are kept the same. This assumption makes it possible to ignore the order of the profiles and pool the data across them within tasks. The assumption can be tested by comparing the results of different realizations of the profiles based on their placement in the task (presented as the first or the second education). Together, the no carryover effects and the no profile order effects assumptions help making the conjoint design more efficient by allowing the researcher to pool the data across both tasks and profiles (Hainmueller et al., Reference Hainmueller, Hopkins and Yamamoto2014, pp. 8–9). We also test the no profile order effects assumption for the Vejen and Aarhus samples in Appendix A. Figures A.3 and A.4 plot the results for Vejen and Aarhus across profiles, while Tables A.3 and A.4 test the joint significance of the interaction terms between the attribute levels and an order dummy (education 1 or 2 presented to the students). None of these tests are significant.
A final assumption is randomization of the profiles. This simply means that the list and order of the attributes are randomly created, which is guaranteed by construction in the present paper. Earlier recommendations in the conjoint literature implied selecting a certain subset of realized alternatives that could be presented to respondents. This ensures fewer alternatives and therefore more control, but it may also violate the randomization of alternatives assumption (Hainmueller et al., Reference Hainmueller, Hopkins and Yamamoto2014, p. 9).
The analysis of conjoint experiments is of course complicated by the design and structure of the data from conjoint experiments. The causal quantity of interest is rarely the average treatment effect as in most classical randomized experiments, since many attributes vary at the same time and the number of potential combinations almost always outnumbers the number of respondents. Instead, we estimate the average marginal component effect (AMCE). This causal quantity estimates the overall effect of one attribute across the remaining attributes on the likelihood of students choosing a particular education. It represents the increase in probability that one education is chosen over another if the information in a particular attribute changes. Given the full randomization of attributes and levels, it can be shown that the AMCE can be causally interpreted (Hainmueller et al., Reference Hainmueller, Hopkins and Yamamoto2014, p. 11). Conveniently, the AMCE can be estimated via an ordinary least squares regression with the outcome as a dependent variable and dummies for the different levels (L) (except a reference group) as independent variables:
 $$Y_{ijk} = \propto + \beta _1L2_{ijk} + \beta _2L3_{ijk} + \beta _3L4_{ijk} \ldots \beta _zLx_{ijk} + \varepsilon _{ijk},$$
where Y ijk is the outcome (either choice or rating) for the ith person with the jth alternative in the kth choice task, L ijk are dummies for all levels of the attribute in question except a reference category and the β values are the estimated AMCEs for each level of the attribute compared with the reference category (Hainmueller et al., Reference Hainmueller, Hopkins and Yamamoto2014, note 15). Clustered standard errors (SEs) at the student level are employed in the analysis to accommodate the fact that each student is presented with several tasks and therefore appears multiple times in the data.
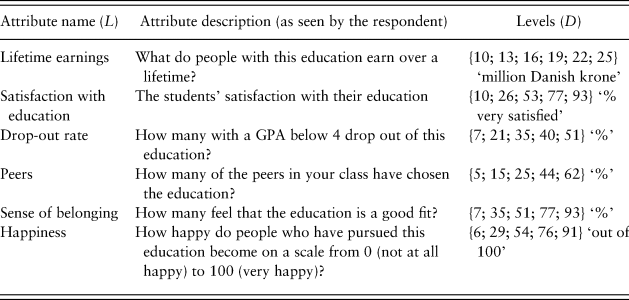
Formally, we present students who are about to make a choice of education with K tasks in which each student will be asked to choose an education and to rate how well the education fits their needs. These tasks have J alternatives (profiles) to choose from, and each alternative is characterized by L attributes. Each attribute, such as lifetime earnings, has a number of levels, which we denote D l for attribute l. The specific attributes and levels can be seen in Table 3.
Attributes and their associated levels.

With these attributes (L), their levels (D) and the educational profiles (J) presented to students in five choice tasks (K), it is possible to denote the treatments, T. The treatment given to student i in the jth educational profile given the kth choice task is T ijk. This vector has six dimensions, each representing one of the attributes L, resulting in a set of vectors T ijkl. The potential number of different profiles (educational programs) is the number of levels D for each attribute multiplied: 6 × 55 = 18,750.
The outcomes in the present paper are the binary choices between two hypothetical educational programs (with randomized attributes) and an interval educational fit measure. The questions for the educational choice measure are asked directly beneath the conjoint experiment, meaning that students can still see the two presented programs while they choose one of them. The question reads: “If you had to choose between the two educations, which one would you choose? If you are in doubt which one you would choose, just choose the one that you like the most.” After this outcome question, and still on the same page as the conjoint experiment, the students are asked the educational fit question: “Which of the two educations do you think will be the best fit for you?” The rating scale is a slider with the values –5 for ‘Definitely education 1’, 5 for ‘Definitely education 2’ and 0 for ‘Neither’. When the slider is moved, a value appears at the end of the scale showing their choice as a number with one decimal, which in effect makes the scale more fine-grained with 100 scale points.
The figure in Appendix B shows an example of the first of the five conjoint experiments as they are shown to the students (without the outcome questions, which are situated just below the conjoint table).
Study 3: results
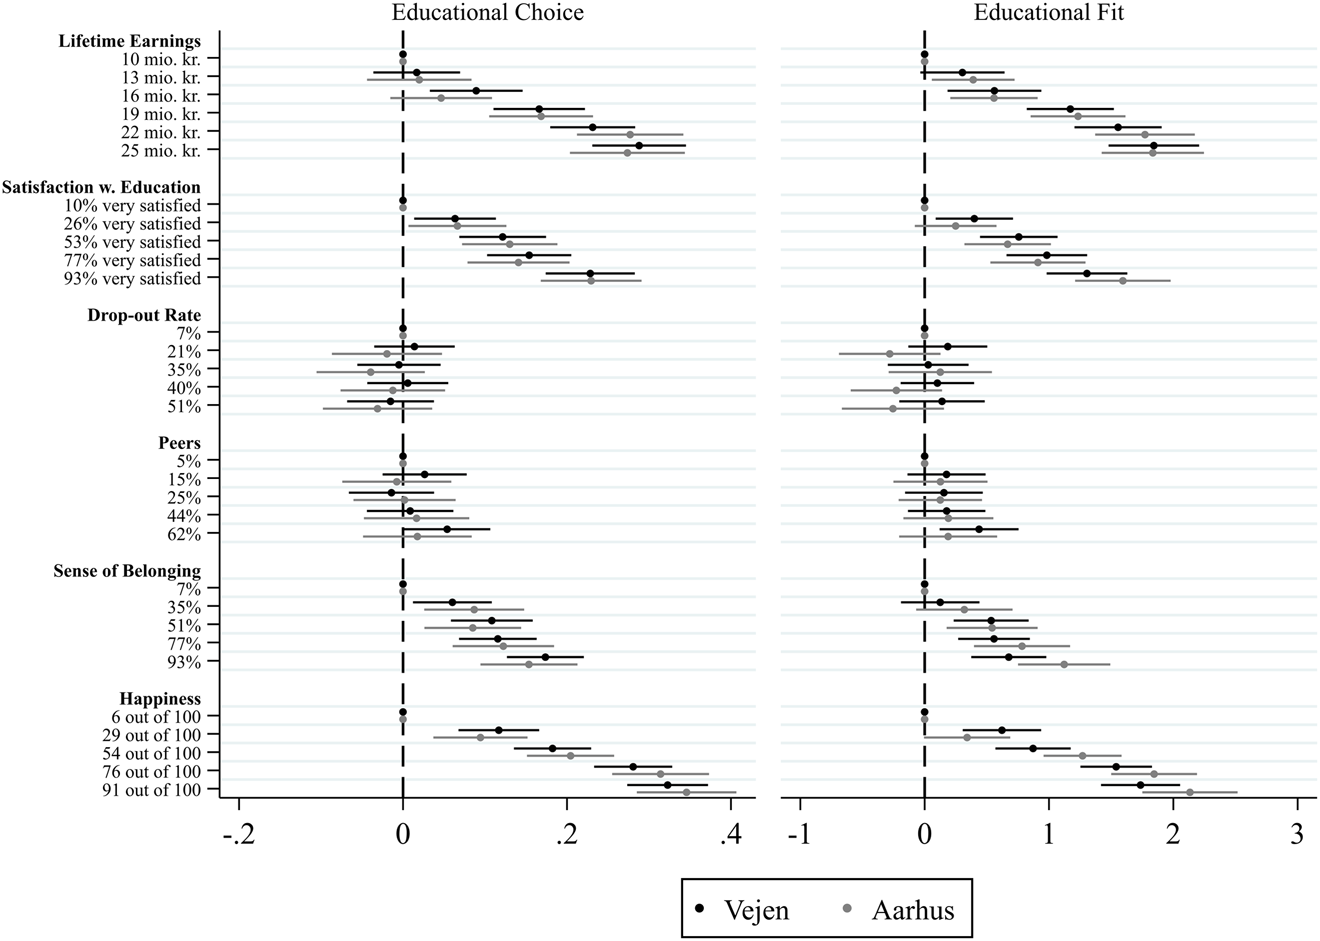
Figure 2 presents the results from the conjoint experiment in both the less urbanized sample, Vejen, and in the more urbanized sample, Aarhus. We have run the same experiment twice in order to replicate the findings in two samples with different peer groups that may have different views on different educations. Figure 2 presents coefficient plots of the AMCEs of different attributes on the two outcomes: educational choice (“Which one would you chose?”) scaled 0/1 and educational fit (“Which of the two educations do you think will be the best fit for you?”) scaled –5 to 5. The coefficient plots show the expected change in probability of choosing an education and in the rating of the educations when the attribute level is compared to the baseline, which in all cases is the lowest level of the attribute. The circles represent the point estimates and the spikes represent the 95% confidence intervals obtained with SEs clustered at the student level. When the spikes do not touch the dashed line at 0, there is a significant difference between the level of the attribute in question and the reference (lowest) level.
Results from conjoint analysis in more rural (Vejen) and more urbanized (Aarhus) schools.
Note: 95% confidence intervals. Results are based on six ordinary least squares regressions per dependent variable (one for each attribute) with four or five dummy indicators (one for each level of the attribute except the reference category). n = 374 (Vejen) and n = 258 (Aarhus) defined by how many answered the last choice question. See Appendix C for full models.

Figure 2 reveals several important findings. First and foremost, the results clearly show that students do not let the popularity of the educations among their peers (measured by how many choose it) influence their own choice.
Second, more long-term outcomes such as lifetime earnings and happiness have a large impact on the probability of choosing an education. In addition, softer factors such as satisfaction and sense of belonging have an effect. Lifetime earnings in particular has a high effect. Compared to the baseline of 10 million Danish krone (DKK), which is the estimated lifetime earnings for a person who does not have a formal education, DKK 13 million is estimated to change the probability of choosing an education in the positive direction by 0.02 with a SE of 0.03. This means that the change is not significant, which can also be seen from the overlap between the 95% confidence interval spikes and the dashed zero line in Figure 2. It is worth noting that DKK 13 million is the average estimated lifetime earning of someone who has received a vocational education (Pihl & Jensen, Reference Pihl and Jensen2015, p. 2), although there is some variation between specific vocational educations.
On the contrary, DKK 16 million has a significant effect of 0.09 (SE = 0.03) on the probability of choosing an education compared with the baseline of DKK 10 million. This means that the probability of choosing an education with lifetime earnings of DKK 16 million is 0.09 higher than choosing an education with lifetime earnings of DKK 10 million. Likewise, DKK 19 million changes the probability by 0.166 (SE = 0.03), DKK 22 million changes it by 0.23 (SE = 0.03) and DKK 25 million changes it by 0.29 (SE = 0.029). The effects are all significantly different from the baseline of DKK 10 million. The DKK 25 million amount corresponds to the lifetime earning one could expect from some of the most well-paying Master's degree programs like civil engineering (Pihl & Jensen, Reference Pihl and Jensen2015).
Compared with the other attributes in Figure 2, it is obvious that students who are about to choose their education take information about lifetime earnings into account. We also note that the coefficients for the different categories of lifetime earnings are more or less linear and therefore indicate consistency in the students’ interpretations.
Third, the educational fit measure basically reproduces these results, which can be seen as a first kind of replication. The only difference in terms of significance concerns the ‘sense of belonging’ attribute, where the information that 35% feel that they belong as opposed to the baseline of 7% is not significant anymore (0.125, SE = 0.161). It therefore seems that the students are very consistent between the choice measure and the fit measure.
Fourth, comparing the black and gray lines in Figure 2 shows that the results replicate in these two different samples, which confirms that the null effect of the peers is not just due to any special circumstances in one of the data collections. This can be seen as a second kind of replication.
Finally, we tested whether these results are systematically different for boys and girls or for eighth- and ninth-grade students. We did not find this to be the case. The results of these interactions models are presented in Appendix D.
Study 4: social desirability bias?
Finally, to further test that the absence of any peer influence in both Study 2 and Study 3 is not due to social desirability bias – students feeling that it is undesirable to acknowledge that peers should have any influence on their educational preferences – we employed a list experiment designed to permit respondents to acknowledge any socially undesirable attitudes without risking disclosure of such attitudes (Glynn, Reference Glynn2013). Such social desirability effects would most likely be deliberate System 2 effects that would cause students to appear unaware of the peer effects in our studies, but in fact they are very aware and deliberately try to answer in a socially desirable way (Fazio & Olson, Reference Fazio, Olson, Sherman, Gawronski and Trope2014, p. 156). This was done among students who had already started their vocational education in the same year.
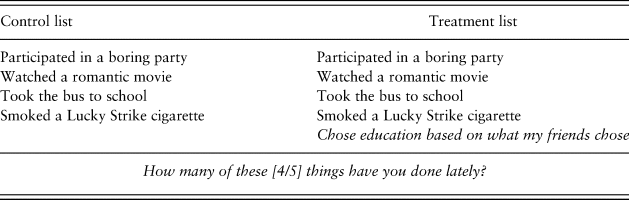
Respondents are presented with a list of statements (items) and are asked how many of the statements they agree with – not which specific statements they agree with. Thus, they cannot disclose whether they agree with any specific statement (unless they respond that they agree with all or none). In the control group, they are presented with J control items. In the treatment group, they are presented with J + 1 item. The additional item in the treatment group is the potentially socially undesirable item of interest. Under the assumptions that (1) presenting respondents with the treatment item does not influence the sum of affirmative answers to the control items and (2) that respondents give truthful answers to the treatment item, the difference in means between the treatment and control groups is an unbiased estimate of the proportion of students who give an affirmative answer to the treatment item (Blair & Imai, Reference Blair and Imai2012).
We presented students with the following question: “Here is a list of things that you may or may not have done lately. We would like to know how many of the things you have done. You do not have to disclose which of the things you have done, just how many.” The lists of items in the control and treatment groups are displayed in Table 4. The students in this study chose their education at the latest on 1 March 2017 and they were asked the questions from 20 October to the 8 December 2017.
Items in the list experiment.

The choice of non-sensitive control items seeks to avoid both too many affirmative answers and too many non-affirmative answers. The result would be ceiling or floor effects that would make the students hesitant to be honest (Glynn, Reference Glynn2013). We have therefore focused on behaviors that are quite normal to vocational school students, such as taking a bus (many are too young to have a driver's license) and smoking (37% of Danish vocational school students smoke every day and a further 12% smoke occasionallyFootnote 4; Egan et al., Reference Egan2017), and some that are still non-sensitive but perhaps a little less prevalent (e.g., going to a movie or a boring party). The average number of things the students have done in the control group is 1.76 out of 4, which points to a satisfactory balance in the control items.
One possible challenge in this particular application of the design is the use of the word “lately” in the outcome question. Students in the treatment and control groups may interpret the period covered differently, since it has been some months since they chose their education. If true, this would amount to a design effect and a possible violation of assumption (1) (Blair & Imai, Reference Blair and Imai2012). In Appendix E, we test the assumption of no design effect following Blair and Imai (Reference Blair and Imai2012) and Glynn (Reference Glynn2013). We do not find that the assumption is violated.
Study 4: results
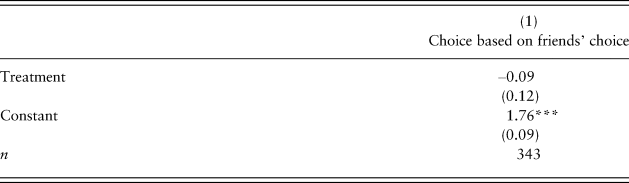
A simple regression of the total number of items chosen on a treatment indicator variable provides the results of the test presented in Table 5.
Results from the list experiment.

Standard errors in parentheses.
***p < 0.001.
The results show that in the control group students chose on average 1.76 items with a standard deviation of 0.09. The treatment group average is 0.09 lower, which is a statistically insignificant difference. Few students choose 0 things (21 in the control group and 18 in the treatment group) or the highest possible number of things (12 in the control group and 4 in the treatment group). In other words, we find no indication that students point to their peers as an influence on their educational choice – even in a survey design that lets them do so without disclosing their individual attitudes.
Discussion and conclusion
Research on educational choice has traditionally focused on long-term factors such as the expected costs and benefits of education. More recently, the influence of peers has been documented in experimental studies within different social science disciplines. Less attention has been given to whether young adults are susceptible to seemingly irrelevant factors such as the mentioning of their peers prior to stating their educational preferences and whether they are aware of the peer influence. We introduce and expand a formal model of educational preferences that suggests that social image effects from peers are dependent on the weight adults are primed to place on this reference group.
The different experiments presented here consistently show that students do not deliberately ascribe any importance to their peers when making educational choices. This result is replicated in two different samples and using direct questioning, conjoint experiments and a list experiment that serves to avoid any social desirability bias. However, when students are reminded about their peers’ attitudes in a subtler manner by changing the question order and thereby priming the students to think about their peers, we do see that their own preferences for actual educational programs are biased toward the peers’ attitudes. Combined with the results showing that students do not assign any value to peers’ attitudes when asked more directly, we conclude that these results support a dual-process model of thinking: the influence of peers – and probably also other reference groups – may work through a more intuitive System 1 mode of thinking, which reacts by associations generated by priming, rather than through a more reflective System 2 mode.
Our formal model of educational investments stems from Bursztyn and Jensen (Reference Bursztyn and Jensen2017). Our addition is the attention (ρ j) given to a particular reference group by an individual, which we theorize conditions the influence of the reference groups. Empirically, we have only considered one reference group in this study – peers – and the attention given to them. We show that young people about to make their educational choices do not devote much deliberate attention to their peers and their choices. However, as attention can both be deliberate (System 2) and unnoticed (System 1), peer effects can still operate, and the results in this study show that this is a real possibility. Future studies should be carried out to gauge the extent to which young people use different reference groups and how they weigh them when making educational decisions. Across our studies, we shift between referring to ‘friends’ and ‘peers’. This does not seem to affect the results, which is consistent with Weigard and colleagues’ (Reference Weigard2014) finding that adolescents react to anonymous peers of their own age and gender in a way that is similar to how they react to being observed by their friends (O'Brien et al., Reference O'Brien2011). Likewise, more studies should be carried out testing how and when their attention to different reference groups matters.
We do not purport to show that lifetime earnings and information are unimportant factors in young peoples’ educational choices. On the contrary, in the conjoint experiments, we consistently find a large effect of long-term factors such as lifetime earnings, information on the quality of the education (student satisfaction) and level of contentment with that particular education. Therefore, these beneficial factors of education (the B term in our formal model) are important to young people and most likely explain a lot of the variation in educational choice.
Some caveats should be mentioned. Although the results point toward an unnoticed peer effect on educational preferences, we only find signs of peer effects in the priming study, which only concerns preferences toward certain educations. Afterwards, virtually all of the students chose the education that they stated as their preferred choice in the surveys (for those students for whom we have data on their choice). The peer priming intervention changed the attitudes toward the intervention, but whether that was enough to change the binary choice between vocational school and high school and whether that effected lasted until the time at which the real choice was made are highly uncertain. The present study is a first step toward understanding these mechanisms. Future research should examine how influential peer effects – noticed or unnoticed – are in real educational choices. Prior research on peer effects has shown a remarkable influence among peers when important educational choices were made (Bursztyn & Jensen, Reference Bursztyn and Jensen2015) and in situations of important decision-making in general – even when the peers are strangers (e.g., Weigard et al., Reference Weigard2014). Based on this line of research, we believe that the influence of peers on young adults’ decisions is relatively well established, and we find it remarkable that it is apparently not recognized by the young adults themselves.
Informing students about lifetime earnings from different educations may not have much effect if students already believe they possess that information and have made their choices accordingly. Instead, we would, on the one hand, expect that information correcting misunderstandings about how peers view certain educational choices and the extent to which they choose these educations would be more effective. Certainly, students may be under the impression that a much larger share of their peers will choose a particular education than is actually the case – an example of the false consensus effect (Ross et al., Reference Ross, Greene and House1977; Marks & Miller, Reference Marks and Miller1987; Wolfson, Reference Wolfson2000; Henry et al., Reference Henry, Kobus and Schoeny2011).
On the other hand, if our finding that peers matter in unnoticed ways holds true, we would expect information campaigns reminding students to resist peer pressure not to have much effect because students would believe that they are not subject to peer group influence. By contrast, simply providing information about peers’ attitudes may prime students to think about social image effects and thereby inadvertently create a social image effect. Research on correcting false information indicates that people do not fully update their prior misconceptions in the face of corrections (e.g., Nyhan & Reifler, Reference Nyhan and Reifler2010; Flynn et al., Reference Flynn, Nyhan and Reifler2017). The limited updating may be explained by a dual-process mode of thinking, in which people are unaware of their biased beliefs – even though other explanations are also possible (Ecker et al., Reference Ecker2011). Future research could examine this by comparing the effects of providing information about peers’ attitudes with simply priming young adults to think about their peers.
Funding
The research was financially supported by the Ministry of Education, Denmark.
Supplementary material
To view supplementary material for this article, please visit https://doi.org/10.1017/bpp.2019.14.