



1 Introduction
1.1 Taiwan Min checked tones
Taiwan Min, also known as Taiwanese Hokkien or Taiwanese, is spoken by approximately 70% of the population in Taiwan. It belongs to the Min-Nan (Southern Min) variety of Chinese Min and is not mutually intelligible with Mandarin, Hakka, or the Formosan Austronesian languages spoken in Taiwan. There are seven lexical tones in Taiwan Min, including five unchecked tones that occur in CV(N) syllables – high-level /55/, low-rising /13/, high-falling /51/, low-falling /31/, and mid-level /33/ – and two checked tones that occur in CV [p t k ʔ] syllables – high-checked /5/ and low-checked /3/ (Figure 1). On the tonal naming scheme used here, the tone number indicates pitch; the higher the tone number, the higher the pitch (Chao Reference Chao1968: 25–30).
The tone system of Taiwan Min. (a) Sandhi; (b) the juncture tones produced by a female speaker more than 40 years of age from Southern Mixed dialect region.
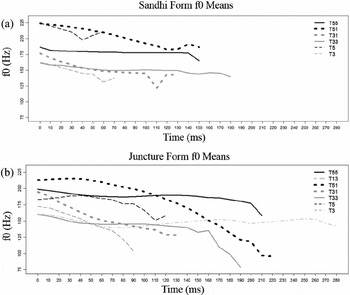
In Taiwan Min, when several tones come together in a phrase to form a tone sandhi group, tone values in non-final positions change according to sandhi rules. The six sandhi rules in Taiwan Min form two chain relationships: 13 → 33 → 31 → 51 → 55 and 3 → 5 → 3 (Cheng Reference Cheng1968, Reference Cheng1973). These six sandhi rules yield six sandhi tones and seven juncture tones (Figure 1). The checked tone sandhi rules, /3/ → [5]/_ σ[tone group] and /5/ → [3]/_ σ[tone group], modify surface tone values in a tone sandhi domain: an underlying tone 3 surfaces as sandhi tone [5] /3/ in the non-final (sandhi) position of a tone group or as juncture tone [3] /3/ in the final (juncture) position of a tone sandhi group. Tone 5 surfaces as sandhi tone [3] /5/ in the non-final position of a tone sandhi group or as tone [5] /5/ at the final position of a tone sandhi group. For example, according to sandhi rule 31 → 51, the syllable /t s h a i 31/ surfaces with a sandhi form [t s h a i 51] in the middle of the phrase ‘cabbage stew’ [peʔ3 t s h a i 51 lɔ51] /p eʔ5 t s h a i 31 lɔ51/, but with a juncture form [t s h a i 31] at the end of the phrase ‘stew cabbage’ [lɔ55 p eʔ3 t s h a i 31 ] /lɔ51 peʔ5 ts h ai31 /. The actual surface acoustic realization associated with the juncture and sandhi tones is dependent on dialect. For example, /p eʔ5/ ‘white’ can be produced as [p e 33] or [p eʔ3] in different dialects.
To avoid confusion, I denote the sandhi tones as [55] /51/, [51] /31/, [31] /33/, [33] /55, 13/, [3] /5/, [5] /3/, and the juncture tones as [55] /55/, [13] /13/, [51] /51/, [31] /31/, [33] /33/, [3] /3/ and [5] /5/. This denotation follows the conventional phonological description (Cheng Reference Cheng1968, Reference Cheng1973). The canonical surface realization will be tested further.
The checked tones 3 and 5 exhibit a glottalized voice quality which sets them apart from the unchecked tones 55, 13, 51, 31 and 33, which exhibit modal voicing (Cheng Reference Cheng1968, Reference Cheng1973; Iwata, Sawashima & Hirose Reference Iwata, Sawashima and Hirose1981; Pan Reference Pan1991, Reference Pan2005). Though glottalization is observed among syllables closed off with final voiceless stops, there have been no reports of similar glottalization among CV(N) syllables with initial voiceless stops.
Following Ladefoged (Reference Ladefoged1973), the term ‘glottalization’ has been employed as a general term for non-modal phonation with stiffened vocal folds phonation. According to Titze (Reference Titze1995: 338), glottalization is a ‘transient sound(s) that result from relatively forceful adduction or abduction during phonation’.
Articulatory studies using fiber optics observed an adduction of ventricular folds during the production of Taiwan Min checked tone CV [p t k ʔ] syllables in citation form (Iwata et al. Reference Iwata, Sawashima and Hirose1981). When these tones are produced in a sentence or in a phrase, ventricular fold incursion sometimes disappears. Additionally, an inverse-filtered oral airflow study found that some speakers of Taiwan Min produced checked tones with small amounts of airflow and a longer closed phase (Pan Reference Pan1991).
In addition to these articulatory studies, there has been a considerable amount of field work carried out on Taiwan Min checked tones. These studies, based on impressionistic auditory transcriptions from hundreds of speakers, have noted the disappearance of glottalization during the production of juncture tone [5] /5/ in CV [ʔ] syllables (Chen Reference Chen2009, Reference Chen2010). However, to date, there have been no reports published either on initial glottalization following voiceless stops or on changes among sandhi tones [3] /5/ and [5] /3/ or juncture tone [3] /3/.
The present study explores the current state of Taiwan Min checked tones. Specifically, the voice quality used in the production of these tones is investigated through the collection and study of both acoustic and electroglottographic (EGG) data.
1.2 Glottalized coda and vowel glottalization
As Blankenship (Reference Blankenship2002) points out, vowel glottalization is not consistently produced with a creaky phonation. In Itunyoso Trique (DiCanio Reference DiCanio2012), glottal codas can surface as either glottal closures with a lengthened duration or as an instance of energy damping during vowel production in the intervocalic position. In Yucatec Maya (Frazier Reference Frazier2009), the phonetic realization of glottalization can be divided into four categories: (i) modal voice with no glottal stop, (ii) weak glottalization with an amplitude dip, (iii) creaky voice with an amplitude dip and an irregular glottal vibration, and (iv) full glottal stop. In German, a canonical glottal stop can be realized with (i) a long closure, (ii) a closure with glottalization on a preceding vowel, (iii) no closure but glottalization on a preceding vowel, or (iv) glottal stop deletion (Kohler Reference Kohler1994).
Generally speaking, the laryngealized/glottalized feature of final voiceless codas can be transferred to the preceding vowels (Maddieson & Ladefoged Reference Maddieson and Ladefoged1985). In many South East Asian languages, including Yi and Hani, non-modal phonation contrasts arise in vowels due to the transfer of laryngeal features from post-vocalic consonants to the preceding vowels (Maddieson & Ladefoged Reference Maddieson and Ladefoged1985). Since glottalization is dependent on the phasing between glottal gestures in the coda and preceding vowels (DiCanio Reference DiCanio2012), it can be realized either through a full glottal stops or through the production of a vocalic segment with weak laryngeal realization (such as energy damping or irregular periodicity in the final portion of a vowel preceding a voiceless coda). During the abrupt phasing associated with a smaller co-articulation effect, glottalized codas can surface with a long stop closure after a vowel nucleus (Figure 2a). However, during the gradual phasing associated with a greater co-articulatory effect, glottalization can surface as either amplitude damping or irregular glottal vibration during a vowel nucleus (Figure 2b).
Coarticulatory phasing between V and C. (a) The abrupt phasing between vowel target and glottal gesture; (b) The gradual phasing between vowel target and glottal gesture.

Huffman (Reference Huffman2005) proposes that co-articulation leads to the glottalization of English vowels. Specifically, the voiceless codas [p t k] can cause glottalization of the preceding vowels. Such glottalization is often realized as irregular periodicity, lowering of f0, damping of amplitude, or a diplophonia (alternation in shape, amplitude or duration of succeeding periods) (Pierrehumbert Reference Pierrehumbert1995; Redi & Shattuck-Hufnagel Reference Redi and Shattuck-Hufnagel2001; Huffman Reference Huffman2005; Garellek Reference Garellek2011, Reference Garellek2013).
In Taiwan Min, the presence of glottalization can be implemented in several different ways. These include (i) a full voiced or voiceless oral/glottal stop closure (Figure 3a), (ii) a vowel produced during a sequence of modal and glottalized phonation (realized as amplitude damping) (Figure 3b), (iii) a vowel produced in a sequence of modal and aperiodic phonation (Figure 3c), or (iv) a coda deletion (Figure 3d).
(a) [t e k 5 n ã 1 3] ‘bamboo forest’ produced as voiced oral stop closure by a female speaker under 30 years old. (b) [t e k 5 n ã 1 3] ‘bamboo forest’ produced as an energy dip by a male speaker over 40 years old. (c) [s e k 5 l a i 3 3] ‘indoor’ produced as an irregular glottal vibration by a male speaker under 30 years of age. (d) [l u t 3 s u 5 5] ‘lawyer’ with a coda deletion produced by a female speaker above 40 years of age.

1.3 Measures for glottalization
In Coatzospan Mixtec (Gerfen & Baker Reference Gerfen and Baker2005), laryngealized/glottalized vowels are produced with an f0 and amplitude drop, a smaller H1-H2, and a shorter vowel duration. Garellek (Reference Garellek2013) reports that changes in spectral tilts, H1*-A1*, H1*-A2* and H1*-A3*, can also be observed during glottalization in English. In this notation, the asterisk (*) indicates the corrected values of the formants and bandwidths (Hanson Reference Hanson1995). High vowels with a low F1 locus can affect the lower harmonic, H1. The magnitude of the first harmonic is affected by both the source and formant loci; as a result, when only the source signal properties are relevant, some compensation is required for the influence of a low F1 on H1.
The mid-frequency spectral tilt measure, H1*-A3*, has been found to distinguish tense and lax phonation contrasts in Yi, Hani and Jingpo (Maddieson & Ladefoged Reference Maddieson and Ladefoged1985, Kuang & Keating Reference Kuang and Keating2012) and breathy versus creaky phonation types in White Hmong (Garellek et al. Reference Garellek, Christina, Esposito and Kreiman2013). An abrupt reduction of airflow generates high frequency energy (Stevens Reference Stevens1977, Holmberg et al. Reference Holmberg, Hillman, Perkell, Guiod and Goldman1995). Thus, the spectral measure H1*-A3* – influenced by the posterior glottal opening at the arytenoids cartilage during the closed phase of a glottal cycle and simultaneity of glottal closure – correlates with the abruptness of the vocal fold closure; the lower the H1*-A3*, the more abrupt the vocal fold closure (Stevens & Hanson Reference Stevens and Hanson1995, Hanson et al. Reference Hanson, Stevens, Kuo, Chen and Slifka2001).
Although an uncorrected mid-frequency spectral tilt, H1-A2, was not found to distinguish between checked tones with glottalization and unchecked tones with modal phonation (Pan Reference Pan1991, Reference Pan2005), different results may be found with the corrected mid-frequency spectral tilt measure, H1*-A3*.
1.4 Research questions
This study focuses on Taiwan Min sandhi checked tones 3 and 5. Two points in particular are investigated: (1) the glottalization realizations of Taiwan Min checked tones, and (2) the acoustic or EGG differences between checked and unchecked tones or between two checked tones in sandhi and juncture positions. The correlations between CQ_H, H1*-A3*, CPP and f0 are also explored.
2 Method
2.1 Participants
Speakers were selected from the five major dialect regions on the west coast of Taiwan: Northern Zhangzhou (NZ), Northern Quanzhou (NQ), Central Zhangzhou (CZ), Central Quanzhou (CQ) and Southern Mixed (SM) (Ang Reference Ang2003, Reference Ang2009). From each of the five dialect regions, eight native speakers were recruited, including two females and two males in their 20s, and two females and two males above 40 years old. In all, 40 speakers participated: (2 males + 2 females) × 2 age groups × 5 dialect regions. All the participants spoke Taiwan Min as their native tongue at home. Other than one young male speaker from central Quanzhou, all the speakers had lived in their native dialect regions until they were 16 years old. All participants also spoke Mandarin.
2.2 Materials
The materials used for the current study were originally produced for a larger study. The experiment featured two sessions, a disyllabic word session and a sentence session. In the first session, speakers were asked to produce disyllabic words; in the second session, they were asked to produce 236 disyllabic words embedded in the carrier sentence ‘Please listen to the tone of __ first’. The disyllabic words contained syllables associated with sandhi tone [33] /31/ and juncture tone [33] /33/. The carrier sentences were designed to encourage the speakers to pay attention to tones, and all the words used were familiar to native Taiwan Min speakers. Each of the 236 carrier sentences was repeated twice; therefore, each speaker produced 472 sentences in total. Each disyllabic word used formed a tone sandhi group. The target syllables included 194 syllables carrying one of the four sandhi unchecked tones, 136 and 142 syllables carrying the sandhi tones [5] /3/ and [3] /5/, respectively, 322 syllables carrying one of the five juncture unchecked tones, and 58 and 92 syllables carrying the juncture tones [5] /5/ and [3] /3/, respectively.
Since the speakers were asked to produce the sentence repeatedly, it was very likely that they would employ the list or contrastive intonation within the sentence to place the focus on the disyllabic words. A prior study on Taiwan Min focus reports that duration lengthening, rather than f0 manipulation, is the primary marker for focus in this language (Pan Reference Pan, Lee, Gordon and Büring2007). Thus, duration, rather than f0, may be the factor most clearly affected by the list or contrastive intonation. The current study focuses on voice source characteristics, which may not as affected by intonation as duration is.
2.3 Experimental procedure
Speakers first read the order number for each sentence and then paused before reading the sentence. The recording lasted approximately 35 minutes. Speakers were asked to pause after every hundredth sentence to have a drink of water before continuing. An experimenter was with the speaker in the recording room to monitor the EGG and acoustic signals and to indicate errors to the speakers.
2.4 Instruments
The Glottal Enterprise EGG system (EG2-PCS) picked up the EGG signals from two electrodes placed on each side of each subject's neck around the thyroid cartilage, while a TEV Tm-728 II microphone placed 15 cm from each speaker's mouth picked up the acoustic sound waves produced during their speech. The recorded EGG and acoustic signals were simultaneously transferred to a laptop using Audacity software. Next, the EGG and acoustic data were preprocessed using EggWorks (Tehrani Reference Tehrani2010), while Praat was used for the manual transcription of the sound wave. F0 was analyzed using the STRAIGHT algorithm (Kawahara, Masuda-Katsuse & Cheveigne Reference Kawahara, Masuda-Katsuse and Cheveigné1999) and both the EGG and sound waves were analyzed together with VoiceSauce (Shue et al. Reference Shue, Keating, Vicenik and Yu2009) to extract vowel durations, f0, CQ_H, H1*-A3* and CPP at each 10% increment.
2.5 Data analysis
Pan (Reference Pan2016) studied the acoustic measures, namely the duration, f0, H1*-A1*, H1*-A2*, H1*-A3*, A1*-A2*, A2*-A3*, CPP, CQ_H, Speed Quotient and Peak Increase in Contact, and found that H1*-A1*, H1*-A3*, A1*-A2*, CPP and CQ_H can effectively distinguish three sandhi tone pairs ([3] /5/ – [31] /33/, [5] /3/ – [51] /31/ and [3] /5/ – [5] /3/). As shown in Figure 1, the two checked tones have a falling contour, in contrast to the two falling unchecked tones 31 and 51.
However, little is known about the vowel glottalization patterns in Taiwan Min checked tones at the final position of a tone group where the checked tones are undergoing sound change. This study explores the acoustic features associated with glottalization among tones [3] and [5] in sandhi and juncture positions.
The harmonic and formant values in this study have been corrected for the effects of surrounding formants and bandwidths by the application of an algorithm for corrected spectral tilt (Iseli & Alwan Reference Iseli and Alwan2004, Iseli, Shue & Alwan Reference Iseli, Shue and Alwan2007). High vowels with a low F1 locus can affect the lower harmonic, H1. The F1* values were corrected for the influence of a low F1 on H1. Tokens with extreme F1* values extracted through VoiceSauce were compared with the F1 values calculated by Praat. Tokens with a misidentified corrected F1* value were excluded from further analysis. Tokens with a mistracked f0 were not excluded from further analysis, since irregular glottal vibration is one glottalization pattern relevant to this study.
CPP is an acoustic measure of how prominently the cepstral peaks emerge against the overall normalized ‘background noise’, CPP can serve as an index of the periodicity of the vocal fold vibration (Hillenbrand, Cleveland & Erickson Reference Hillenbrand, Cleveland and Erickson1994). The higher the CPP value, the more periodic the voice quality becomes.
Although less readily available than acoustic measures, EGG measures are often used to identify the acoustic characteristics of glottalization. In the current study, the EGG parameter CQ_H was measured with a hybrid method in which the maximum value of the first derivative of the EGG signal was used as the onset of vocal fold contact and the 25% threshold of peak-to-peak amplitudes of the EGG signal was used as the offset of the contact (Rothenberg & Mahshie Reference Rothenberg and Mahshie1988, Orlikoff Reference Orlikoff1991, Howard Reference Howard1995, Herbst & Ternström Reference Herbst and Ternström2006).
In Figure 3 above, the coda [p t k ʔ] was labeled as <damping> if energy damping was observed at the end of the vowel (Figure 3b), as <irregular> if an irregular glottal vibration was observed (Figure 3c), and as <stop> if a clear oral/glottal stop closure was observed (Figure 3a).
To address the first research question concerning the coda patterns of Taiwan Min checked tones, data on the four categories of glottalization will be reported: coda deletion, coda realization as a full oral/glottal stop closures (Figure 3a), energy dip (Figure 3b), and irregular glottal vibration (Figure 3c). To address the second research question, the acoustic or EGG measures that best represent the difference between checked and unchecked tones, or between two checked tones, will be reported, including H1*-A1*, H1*-A3*, A1*-A2*, CPP and CQ_H; the correlation between f0 and the five voicing measures, H1*-A1*, H1*-A3*, A1*-A2*, CPP and CQ_H will also be discussed.
Logistic mixed-effect regression models (2 tones × 2 prosodic positions; speakers and words as random factors) were used to analyze (i) coda deletion rates, and (ii) vowel-final glottalizations realized as full stops, as opposed to energy dips. Model selections comparing the goodness of fit between full models and smaller models were used to identify certain factors that should be included in the regression models, including age, gender and dialect.
3 Results
3.1 Coda deletion
In order to explore the effects of tone and prosodic position on coda deletion, two mixed-effect logistic regression models (2 tones × 2 prosodic positions; speakers and words as random factors) were used: one model for coda deletion rates in sandhi and one for coda deletion rates in juncture positions. As shown in Figure 4, the /ʔ/ deletion rates, above 80%, were significantly higher than the /p t k/ deletion rates in both the sandhi and juncture positions (Table 1).
Coda deletion rates. S3: sandhi tone [3] /5/; S5: sandhi tone [5] /3/; J3: juncture tone [3] /3/; J5: juncture tone [5] /5/.

The results of mixed-effect logistic regression models (three coda categories) on coda deletion rates with /ʔ/ deletion rates as baselines.

*** p < .001
The relative importance of age, gender and dialect on coda deletion rates was assessed by comparing the full model to a smaller model, and Chi-squared statistics and p-values were used to determine whether the full model provided a significantly better fit than the smaller model (Baayen Reference Baayen2008). In the sandhi position, the model including age, gender and dialect factors did not show a better fit than the model excluding these factors (χ2 = 6.951, p = .325). Since the inclusion of age, gender and dialect effects did not improve the goodness of fit of each model, we postulate that, in the sandhi position, deletion rates were not affected by any of these three factors.
However, in the juncture position, the goodness of fit for the models did improve after the inclusion of two factors: age and dialect (χ2 = 17.999, p < .01) (Table 2). These two factors were included in the final model without studying their interaction (χ2 = 1.863, p = .761) (Table 2).
The results of model selection (age × gender × dialect) on coda deletion among juncture tones.

** p < .01
In the juncture position, as shown in Table 3, the results of the mixed-effect logistic models (2 ages × 5 dialect regions) with speakers and words as random factors revealed that speakers under 30 years of age were significantly more likely to delete codas than speakers over 40 years of age (β = –1.394, p < .01). Dialectally speaking, Northern Quanzhou speakers were significantly less likely to delete glottal codas than Central Quanzhou speakers (β = –2.269, p < .01) (Table 3).
The results of the mixed-effect logistic model (2 ages × 5 dialect regions) on the coda deletion rate in the juncture position. Data from speakers under 30 years of age and speakers from the Central Quanzhou region are used as baselines.
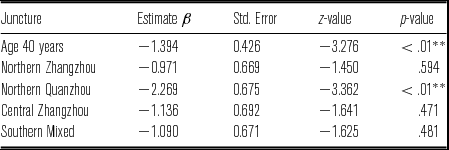
** p < .01
The results showed that coda deletion can be observed among both tones [3] and [5] in sandhi and juncture positions. Moreover, in the juncture position, the codas are more likely to be deleted among speakers under 30 years of age or among Central Quanzhou speakers.
3.2 Coda categorization
Next, the types of undeleted codas are discussed. Since the coda deletion rate for /ʔ/ was significantly higher than the deletion rate for /p t k/, the two sets of data were analyzed separately. The surface realization of undeleted /ʔ/ tended to be realized more often as a full oral/glottal stop closure in the sandhi position, as shown in Figure 5a.
Percentage of coda deletion. (a) The percentage of coda categorization for /ʔ/; (b) the percentage of coda categorization for /p t k/.

Among the undeleted oral codas /p t k/, Figure 5b shows that the codas of sandhi tone [3] /5/ were more likely to be produced as full oral/glottal stop closures than the codas of other tones were. On the assumption that full oral/glottal stop closure, arising from an abrupt phasing between vowel and coda stop (Figure 2a above), represents the canonical surface realization of a coda, we can conclude that sandhi tone [3] /5/ was most often realized with a canonical form. Equivalently, assuming that an energy dip (Figure 3b) or irregular glottal vibration (Figure 3c) at the final portion of vowel, resulting from gradual phasing (Figure 2b), is a less canonical form for a coda stop, we can conclude that the checked tones [5] /3/, [3] /3/ and [5] /5/ were more likely to be realized with weakened glottalization forms.
The small number of codas produced with an irregular glottal vibration (Figure 3c) suggests that creaky phonation – i.e. the production of substantial jitter and shimmer during irregular glottal vibrations – is rarely observed among Taiwan Min checked tones. As Blankenship (Reference Blankenship2002) points out, vowel glottalization need not always be produced with a creaky phonation. Since codas produced with irregular glottal vibrations were rare in this experiment, the following analysis will focus on a comparison between codas realized as full oral/glottal stop closures and those produced with an energy dip.
To explore the effect of tone and prosodic position on the occurrence of oral/glottal stop closures versus energy dips for /p t k/, a model was developed. Preliminary analysis revealed that the inclusion of tone and prosodic position (χ2 = 78.105, p < .001) improved the goodness of fit for the model, whereas the interaction of these two factors did not (χ2 = 0.121, p = .730) (Table 4). Thus, the final logistic mixed-effect models excluded the interaction between tone and prosodic position.
The results of model selection (tone × prosodic position) on coda realization of /p t k/.

*** p < .001
The results of the final logistic mixed-effect logistic regression models (2 tones × 2 prosodic position; speakers and words as random factors) revealed significant effects of tone (β = –0.476, p < .05) and prosodic position (β = –1.231, p < .001) on coda type (Table 5). Since a logistic model was used to calculate the ratios between glottalization realized as a full oral/glottal stop closure and glottalization realized as energy damping, the exponentials were derived from β values (Table 5). The results showed that tone [3] was 1.6 (e0.476 = 1.61) times more likely than tone [5] to be realized with a full oral/glottal stop closure (Table 5). Moreover, a sandhi tone was 3.42 (e1.231 = 3.42) times more likely than a juncture tone to be produced with a full oral/glottal stop closure. In other words, full oral/glottal stop closures were observed significantly more often among tone [3] and sandhi tones.
The results of the logistic mixed-effect model in predicting the occurrence of energy damping and full oral/glottal stop closure among tones [3] and [5] in sandhi and juncture positions. Baseline data are those for tone [3] or sandhi position.

** p < .01, *** p < .001
In sum, along with the high /ʔ/ deletion rates for tones [3] and [5], oral codas /p t k/ were realized with full oral/glottal stop closures most frequently for tone [3] and for sandhi tones. The following sections report the results for the acoustic measures – CQ_H, H1*-A1*, H1*-A3*, A1*-A2* and CPP – of codas and preceding glottalized vowels.
3.3 Voice quality
Before exploring the differences between vowels carrying checked and unchecked tones or between vowels carrying two checked tones, the coda measures are presented.
3.3.1 Coda
3.3.1.1 EGG measures for coda
As shown in Figure 6, generally speaking, the CQ_H group means were shorter for codas than for preceding vowels. Setting aside codas produced with energy damping in the juncture position, the CQ_H group means of coda for checked tone syllables represented less than 20% of the total and showed a merged decreasing pattern toward the end of the coda. We can thus postulate that the codas of checked tones were produced within a short close phase that gradually decreased through the duration of the coda. As shown in Table 6, when produced as energy damping, the CQ_H group means of tones [5] /3/ and [5] /5/ during codas were significantly longer than those of tones [3] /5/ and [3] /3/.
The mean Contact quotient (CQ_H) of tones [3] and [5] between 20% and 80% vowel intervals for vowels and final coda produced as either a full stop closure, energy damping or irregular glottal vibration in sandhi position 6a–c and in juncture position 6d–f.

The results of the mixed-effect linear regression model (four tones) on H1-A1: H1*-A1*, H1-A3:H1*-A3*, A1-A2: A1*-A2*, CPP and CQ_H group means for final codas. Bold marks special tilts.

* p < .05, **p < .01, ***p < .001
3.3.1.2 Acoustic measures for coda
The mean H1*-A1* contours fell through the coda (Figure 7), mirroring the falling contours of the mean CQ_H. While the CQ_H group means for codas showed a merging pattern, the H1*-A1* group means for codas in sandhi tone [3] /5/ syllables were significantly higher than those in tone [5] /3/ syllables (Figure 7a and 7b, Table 6). On the other hand, the H1*-A1* group means for codas in juncture positions generated the reverse pattern to the H1*-A1* group means for codas in tone [5] /5/ syllables, and were significantly higher than those reported for tone [3] /3/ (Figure 7a–c, Table 6).
The mean H1*-A1* of tones [3] and [5] between 20% and 80% vowel intervals for vowels and final codas produced as full stop closures, energy damping, or irregular glottal vibration in sandhi position 7a–c and in juncture position 7d–f.

Similar to the mean CQ_H and the mean H1*-A1*, the mean H1*-A3* contours were lower than those of the preceding vowel and also fell through the coda, suggesting more abrupt glottal closures during codas than during the preceding vowels (Stevens & Hanson Reference Stevens and Hanson1995). Unlike the merging pattern observed among the mean CQ_H contours for the two checked tones, there was a trend for the mean H1*-A3* contours for codas of tone [3] syllables to be significantly higher than those for tone [5] (Figure 8, Table 6). These results suggest that, compared with tone [3] /5/ and [3] /3/, tones [5] /3/ and [5] /5/ were produced with more abrupt and simultaneous glottal closures.
The mean H1*-A3* of tones [3] and [5] between 20% and 80% vowel intervals for vowels and final codas produced as full stop closures, energy damping, or irregular glottal vibration in sandhi position 8a–c and juncture position 8d–f.

Unlike the mean CQ_H, H1*-A1*, and H1*-A3* falling contours produced during codas (Figures 6–8), the mean A1*-A2* contours actually showed a rising pattern (Figure 9). In fact, the mean A1*-A2* contours produced during codas were higher than those produced during the preceding vowels. As shown in Table 6, generally speaking, the A1*-A2* group means for tones [5] /3/ and [5] /5/ were significantly higher than those for tones [3] /5/ and [3] /3/.
The mean A1*-A2* contours for tones [3] and [5] within the vowel interval range of 20% and 80%: for syllables with a coda produced as a full stop closure, energy damping or irregular glottal vibration in sandhi position 9a–c and juncture position 9d–f.

As shown in Figure 10, the CPP group means produced during the codas of syllables carrying tones [3] and [5] were lower than the CPP group means produced during the preceding vowels; furthermore, these means gradually decreased through the codas and were indistinguishable between the two checked tones. It can therefore be concluded that the codas were produced with less periodic voicing than the preceding vowels; the CPP group means for juncture tones showed merging patterns during the codas. As shown in Table 6, only among sandhi tones were the CPP group means of tone [5] /3/ significantly lower than for tone [3] /5/. It can therefore be proposed that codas of syllables carrying sandhi tone [3] /5/ were produced with more periodic voicing than those carrying sandhi tone [5] /3/.
The mean CPP contours for tones [3] and [5] within the range of 20% and 80% of vowel intervals for syllables with codas produced as full stop closures, energy damping or irregular glottal vibration in sandhi position 10a–c and juncture position 10d–f.

In sum, CQ_H, H1*-A1*, H1*-A3* and CPP group means produced during codas showed falling contours, whereas A1*-A2* group means showed rising contours in the same context. This suggests that, compared with preceding vowels, codas are produced with an increasingly shorter contact quotient, more abrupt glottal closure, and less periodic voicing. Moreover, generally speaking, tones [5] /3/ and [5] /5/ were produced with a significantly longer contact quotient and a more abrupt glottal closure than tones [3] /5/ and [3] /3/.
This section has explored the contrasts in voice quality produced during codas. The next section will compare the production of vowels in syllables carrying checked tones in sandhi and juncture positions along the same five measures (CQ_H, H1*-A1*, H1*-A3*, A1*-A2* and CPP).
3.3.2 Vowel glottalization
3.3.2.1 Vowel glottalization for checked and unchecked tones
First, the CQ_H, H1*-A1*, H1*-A3*, A1*-A2* and CPP group means of vowels carrying checked tones will be compared with those carrying unchecked tones to investigate the characteristics of non-modal voicing of checked tones. The results of the mixed-effect logistic regressions models (tones × prosodic positions × coda categorization; with speakers and lexical items as random effects) on the CQ_H, H1*-A1*, H1*-A3*, A1*-A2* and CPP group means are shown in Table 7.
The results of logistic mixed-effect regression models (tones) on H1*-A1*, H1*-A3*, A1*-A2*, CPP and CQ_H group means for vowels in syllables carrying sandhi and juncture tones [3], [5], [3 1] and [5 1] with codas produced as full oral/glottal stop closures, energy damping, or irregular glottal vibration. H1-A1: H1*-A1*, H1-A3: H1*-A3*, A1-A2: A1*-A2*. Bold marks: Spectral tilts.

* p < .05, ** p < .01, *** p < .001
These results show that the mean CQ_H for vowels carrying tone [51] was significantly longer than the mean CQ_H for vowels carrying tone [5] in both the sandhi and juncture positions (Table 7). For tones [3] and [31], Table 7 shows that, in the sandhi position, the mean CQ_H was significantly shorter for vowels carrying sandhi tone [3] /5/ than for those carrying sandhi tone [31] /33/; the reverse pattern was observed in the juncture position.
Regarding spectral tilts among sandhi tones, as shown in Table 7, none of the measures were effective in distinguishing vowels carrying sandhi checked tones from unchecked tones; the only exception was the H1*-A3* group means for sandhi tones [5] /3/, of which codas were produced as irregular glottal pulses. In the juncture position, the spectral tilt measures were not effective in distinguishing tone [3] /3/ from [31] /31/. However, the H1*-A1* and H1*-A3* group means for juncture tone [51] /51/ were significantly lower than those for juncture tone [5] /5/, suggesting a more simultaneous glottal closure for tone [51] /51/ than for tone [5] /5/.
Though mean spectral tilts were largely ineffective in distinguishing sandhi checked tone [3] /5/ from sandhi unchecked tone [31] /33/, the mean CPP of sandhi tone [3] /5/ was significantly lower than that of sandhi tone [31] /33/, suggesting a less periodic voicing for sandhi tone [3] /5/ than for sandhi tone [31] /33/.
In sum, the mean CQ_H of vowels carrying tones [3] and [31] did not show consistent patterns across sandhi and juncture positions. However, the mean CQ_H of tone [51] was consistently longer than the mean CQ_H of tone [5], suggesting a shorter close phase for the glottal cycles of vowels of tone [5]. A trend was also observed for the mean H1*-A3* to be significantly larger for tone [5] than for tone [51], suggesting a more abrupt glottal closure during tone [51]. Moreover, the lower CPP group mean of sandhi tone [3] /5/ compared to sandhi tone [31] /33/ suggests a less periodic voicing for tone [3] /5/.
After identifying the voice quality contrast among vowels carrying checked and unchecked tones, the nature of the voicing contrasts among vowels carrying two checked tones was explored.
3.3.2.2 Vowel glottalization for checked tones
First, we compared the CQ_H, H1*-A2*, H1*-A3*, A1*-A2* and CPP group means for vowels carrying two checked tones. Generally speaking, the mean CQ_H and mean CPP were found to be significantly longer and higher for syllables carrying tone [5] than tone [3] (Table 8), suggesting a longer contact quotient and more periodic voicing for tone [5]. With reference to spectral tilts, sandhi tone [5] /3/ tended to have significantly lower means for H1*-A1*, H1*-A3* and A1*-A2* than sandhi tone [5] /3/. The low H1*-A3* group mean suggests a more abrupt glottal closure for sandhi tone [5] /3/ than for sandhi tone [3] /5/. However, the same distinction was not observed between juncture tones [3] /3/ and [5] /5/.
The results of logistic mixed-effect regression models (tones) on H1*-A1*, H1*-A3*, A1*-A2*, CPP and CQ_H group means for vowels carrying sandhi and juncture tones [3] and [5]. Coda glottalization was realized as a full oral/glottal stop closure, energy damping, or irregular glottal vibration. H1-A1: H1*-A1*, H1-A3: H1*-A3*, A1-A2: A1*-A2*. Bold marks: Spectral tilts.

* p < .05, ** p < .01, *** p < .001
In sum, these results suggest that, within the [5] – [51] tone pair in sandhi and juncture positions, tone [5] was produced with a shorter glottal contact quotient and less abrupt closure than tone [51]. However, for the [3] – [31] tone pair, sandhi tone [3] /5/ was produced with a shorter glottal contact and less periodic voicing than sandhi tone [31] /33/. For the [3]–[5] tone pair, vowels carrying sandhi tone [5] /3/ were produced with a longer contact phase during glottal vibration, a more abrupt and simultaneous glottal closure, and more periodic voicing than sandhi tone [3] /5/. However, in juncture position the contrast between spectral tilts was lost.
3.3.3 Summary on coda and vowel voice quality
In comparison to their preceding vowels, codas were produced with an increasingly shorter contact quotient, a more abrupt glottal closure, and less periodic voicing. A comparison of vowels in checked and unchecked tones showed that tone [5] was produced with a shorter contact quotient than tone [51]. Sandhi tone [3] /5/ was produced with a shorter contact quotient and less periodic voicing than sandhi tone [31] /33/. Between the two checked tones, vowels in syllables carrying sandhi tone [5] /3/ were produced with a longer contact quotient, more abrupt glottal closure, and more periodic voicing than those carrying sandhi tone [3] /5/.
3.4 f0 correlation
Since Taiwan Min is a tonal language in which lexical tones play a dominant role in lexical identification, this study sought to determine whether or not phonation contrasts observed in the five measures (CQ_H, H1*-A1*, H1*-A3*, A1*-A2* and CPP) were by-products of pitch contrast. To this end, the correlations between f0 and those five measures were investigated. The results of Pearson's product-moment correlation co-efficient revealed that, among female speakers, f0 correlated weakly with CQ_H, A1*-A2* and CPP but moderately with H1*-A1* and H1*-A3* (Table 9); on the other hand, among male speakers, f0 showed weak correlation with H1*-A1*, H1*-A3*, A1*-A2* and CPP, but moderate correlation with CQ_H. In sum, even though the f0 did not demonstrate a strong correlation with any of the five measures, the study revealed clear tendencies for a higher f0 to be associated with more abrupt vocal fold closure among female speakers and a longer contact quotient among male speakers (Table 9).
Pearson's product-moment correlation between f0 and voice quality measures (CQ_H, H1*-A1*, H1*-A3*, A1*-A2* and CPP). High correlation: 0.7 ≤ R2 ≤ 1, medium correlation: 0.3 ≤ R2 ≤ 0.7, low correlation: 0 ≤ R2 ≤ 0.3; H1-A1: H1*-A1*, H1-A3: H1*-A3*, A1-A2: A1*-A2*. Bold marks spectral tilts.

4 Discussion
The non-modal voicing of the checked tones in Taiwan Min has never been well documented. This study explored (1) the glottalization patterns of Taiwan Min checked tones, and (2) the acoustic and EGG measures that distinguish checked tones from unchecked tones or distinguish two checked tones. The correlations between f0 and acoustic/EGG measures were also examined.
4.1 Coda stops
Codas in this study were realized with four different surface forms: a full oral/glottal stop closure, an energy damping at vowel's end, an irregular glottal vibration at vowel's end, or deletion of the coda. With regard to coda deletion, this study found that more than 80% of /ʔ/ were deleted, compared to less than 20% of /p t k/. Among undeleted /p t k/, a full oral/glottal stop closure was observed most often among tones [3] than tone [5] or in sandhi positions than in juncture positions.
The rarity of irregular glottal vibration suggests that Taiwan Min checked tones do not make regular use of creaky phonations with pitch or amplitude alternation. Instead, the findings reported here suggest that glottalized codas are produced with a short close phase during a glottal cycle, a more abrupt and simultaneous glottal closure, and less periodic voicing than their preceding vowels. Moreover, comparing between the two checked tones, this study shows that codas in syllables carrying tone [5] are produced with a longer contact and more abrupt glottal closure voicing than codas in syllables carrying tone [3].
4.2 Vowel glottalization
Setting aside their CV [p t k ʔ] syllable structure and short vowel duration, checked tones differ from unchecked tones in terms of vowel glottalization. The co-articulation between a glottalized coda and the preceding vowel results in the emergence of different glottalization categories. In this study, checked tones are produced with predominantly gradual phasing (energy damping). Tone [5] and sandhi tone [3] /5/ are produced with shorter glottal close phase than tone [51] and sandhi tone [31] /33/, respectively.
Among the two checked tones, in the sandhi position, sandhi tone [5] /3/ is produced with a longer close phase, a more abrupt and simultaneous glottal closure and more periodic voicing than sandhi tone [3] /3/. However, in juncture position, this difference in spectral tilt is lost.
The differences in acoustic and EGG measures correlated modestly, or at most moderately, with the f0 measures. These results suggest that contrast in voice is not a by-product of pitch manipulation.
The results of a perceptual study on Taiwan tone identification (Pan Reference Pan2015) found the lower f0 onset contributed to the perception of sandhi tone [3] /5/, the short vowel duration contributed to the perception of juncture tone [3] /3/. Furthermore, a high f0 offset and low H1*-A3* (β = –0.163, p < .05 *) contributed to the perception of juncture tone [5] /5/.
4.3 Valving hypothesis
In traditional models, voicing is classified in terms of glottal opening (Ladefoged Reference Ladefoged1973); however, more recently a ‘valving’ hypothesis has been proposed (Esling & Harris Reference Esling and Harris2003, Esling, Fraser & Harris Reference Esling, Fraser and Harris2005, Edmondson & Esling Reference Edmondson and Esling2006, Esling, Zeroual & Crevier-Buchman Reference Esling, Chakir and Buchman2007). This hypothesis focuses on the vertical dimension of the laryngeal tube and proposes the involvement of the following six valves during phonation: (i) glottal vocal folds, (ii) ventricular folds, (iii) arytenoids and aryepiglottic folds, (iv) epiglottis, (v) suprahyoid muscle group, and (vi) pharyngeal constrictors.
Iwata et al. (Reference Iwata, Sawashima and Hirose1981) noted the closure of ventricular folds during the production of checked tones in citation forms. The EGG measures collected in the current study were produced as a result of the overall laryngeal contact. The duration of the contact quotient, the abruptness of the glottal closure, and the periodicity of the glottal vibration observed in current study must be confirmed with kinematic data, especially in relation to the valve movements that contributed to the CQ_H, H1*-A3* and CPP. Future kinematic studies focusing on the speed of closure of true and ventricular vocal folds and aryepiglottic folds would reveal a fuller picture of Taiwan Min checked tones.
4.4 Sound change
Beddor (Reference Beddor2009) proposed that abrupt and gradual phasing between adjacent segments, such as nasalization produced between a final nasal and a preceding vowel, can result in a sound change. In Taiwan Min, both abrupt and gradual phasings between vowels and glottalized codas have been observed. Moreover, the merging of H1*-A1*, H1*-A3* and A1*-A2* between two juncture checked tones has been observed. These merging patterns are similar to the observed f0 merge, which results from the lowering of the f0 in juncture tone [5] /5/ into the lower f0 range that originally contained only tone 3 (Ang Reference Ang2003, Reference Ang2009; Liao Reference Liao2004; Chen Reference Chen2009, Reference Chen2010).
It is proposed that glottalization produced during the final portion of a vowel arises through transference of laryngealization from the upcoming voiceless coda (Garellek Reference Garellek2013). In many South East Asian languages, including Yi, Hani and Jingpho, phonation contrasts in vowels arise from the transference of the laryngeal features of post-vocalic consonants to the preceding vowels (Maddieson & Ladefoged Reference Maddieson and Ladefoged1985, Thurgood Reference Thurgood2002). If glottalized voicing during vowels is the result of anticipatory co-articulation between the vowel and a following glottalized coda, then coda deletion may lead to a loss of vowel glottalization, as can be seen in the merging of H1*-A1*, H1*-A3* and A1*-A2* during a vowel. Therefore, the relationship between final coda deletion and the merging of the voicing contrast deserves further study.
Taiwan Min is a tonal language devoid of any phonemic phonation contrasts. The deletion of voiceless codas may lead to two potential changes for vowel glottalization. On the one hand, glottalization within the vowel may be treated as a property of the vowel by listeners. Even after coda deletion, the glottalized voice quality is retained as an intrinsic property of checked tones. On the other hand, vowel glottalization may be regarded as a result of contextual co-articulation. Thus, after the removal of the conditioning environment (the final coda), the context-induced co-articulatory effect may disappear. As a consequence, vowels may be de-glottalized after a coda deletion. Further vowel quality comparisons among unchecked tones, checked tones with a full oral/glottal stop closure and checked tones with deleted codas may reveal the relationship between coda deletion and changes in glottalization.
Acknowledgements
This study was supported by the Ministry of Science and Technology, formerly the National Science Council of Taiwan (NSC 98-2401-H-009-040-MY3). Thanks to Shao-ren Lyu, Ning Chang, Mao-hsu Chen, Fang-Yi Chien, Chia-Jou Liu, Yi-chu Ke and Hsiao-Tung Huang for assistance with data and statistical analysis. Thanks to Magar Etmekdjian and Caitlin Keenan for editing the paper. We deeply appreciate UCLA Phonetics Laboratory for sharing the VoiceSauce and EggWorks software. Thanks to reviewers and audiences in Interspeech 2011 and 17th ICPhS 2011 for valuable comments.



