I. INTRODUCTION
Body-centered cubic (bcc) metals and alloys are one of the most widely used engineering materials. For example, ferrite steels are extensively applied in machinery, land transportation vehicles, and infrastructures. Recently, ferrite steels have been proposed to be the main candidates for the in-core and out-of-core structures in several envisioned generation IV nuclear power reactors.Reference Guerin, Was and Zinkle1, 2 This has raised more interest in the study of bcc metals and alloys in recent years. Dislocation slip and interactions of dislocations are the most important deformation mechanism for metals and alloys.Reference Ali, Mushtaq and Butt3, Reference Li, Wang, Misra, Zhang, Huang and Hirth4 Therefore, understanding the characteristics and behavior of dislocations in metals or alloys will help to understand their mechanical behavior and properties. Despite of the importance of bcc metals and alloys, their dislocation structures are much less studied than those of face-centered cubic (fcc) metals and alloys. Recently, there have been increased research activities on the dislocation structures of bcc metals.Reference Monnet and Terentyev5–Reference Terentyev, Osetsky and Bacon14 However, most studies are computer simulations; only a few are experimental observations.
In bcc systems, the shortest Burgers vector of the perfect dislocation is of the type ½<111>, which is along the close-packed directions.Reference Nabarro15 ½<111> screw dislocations are well studied experimentally and theoretically in coarse-grained (CG) bcc metals and alloysReference Clouet, Ventelon and Willaime9–Reference Sigle13, Reference Vitek, Perrin and Bowen16–Reference Groger, Dudeck, Nellist, Vitek, Hirsch and Cockayne19, but ½<111> edge dislocations have been rarely studied. Another less common perfect dislocation is proposed to be <100>, which is believed formed by the dislocation reaction: ½[111] + ½[1 $\bar 1$
 $\bar 1$] → [100].Reference Nabarro15 This reaction is energetically favorable in theory, but the magnitude of the <100> Burgers vector is ∼15% larger than that of ½<111>, which makes it less stable than the ½<111> dislocations. To our knowledge, pure edge dislocations are rarely observed experimentally in CG bcc metals and alloys. Molecular dynamics (MD) simulationsReference Monnet and Terentyev5–Reference Liu, Golubov, Woo and Huang7, Reference Duesbery and Xu20 revealed that ½<111> edge dislocations were very easy to glide, making it hard to retain after deformation.
Our current knowledge on dislocation properties of bcc metals and alloys was largely extracted from their CG forms. As the grain size decreases to nanoscale, nanocrystalline (NC) metals and alloys have displayed superior and unique mechanical properties compared to their CG counterparts because their deformation mechanisms are different.Reference Zhao, Topping, Bingert, Thornton, Dangelewicz, Li, Liu, Zhu, Zhou and Lavernia21–Reference Cheng, Yuan, Jian, Xu, Millett and Zhu32 The mechanical properties and behaviors of metals and alloys are controlled by their deformation mechanisms. Previous reportsReference Wei, Pan, Wu, Schuster, Kecskes and Valiev33, Reference Wei, Zhang, Schuster, Ramesh, Valiev, Kecskes, Dowding, Magness and Cho34 have shown that high-pressure torsion (HPT) can refine the coarse grains into nanoscale and introduce very high density of dislocations in bcc Ta and W. High-resolution transmission electron microscopy (HRTEM) investigations revealed a high density of dislocations with edge components but the dislocation characteristics were not clear yet.
The atomic structure of edge dislocations or edge components of mixed dislocations can be best studied using HRTEM. An edge dislocation can be readily identified as a termination of a lattice plane when viewed along the dislocation line. However, since a HRTEM image is a two-dimensional view of atomic projection along the zone axis, which is also the dislocation line direction in an ideal case, it cannot reveal the magnitude of the Burgers vector of a mixed dislocation. Furthermore, the slip systems in bcc metals are very complex, and different zone axes, including <110>, <100>, and <111>, can be used to obtain HRTEM images. It is not clear which zone axis should be used to investigate edge dislocations or edge components of mixed dislocations.
In this work, we chose bcc Mo (space group: Im3m, a = 0.3147 nmReference Edwards, Speiser and Johnston35) as the model material. Pure Mo with coarse grains was processed by HPT to refine the grains into nanometer sizes with a very high density of dislocations with edge components. We report the first observation of pure edge dislocations in NC bcc metals by HRTEM. Dislocations with different edge components are clarified by comparing experimental observations with theoretical analysis. Based on these results, the deformation mechanism of NC bcc metals will be briefly discussed.
II. EXPERIMENTAL
A. Sample preparation and microstructure analysis
Sample disks of 0.76 mm thick and 10 mm in diameter were cut from a Mo sheet and deformed using HPT for six turns under a pressure of 4 GPa. The detailed description of HPT procedure can be found elsewhere.Reference Zhilyaev and Langdon36, Reference Jiang, Zhu, Butt, Alexandrov and Lowe37 Wedge-shaped thin foils for transmission electron microscopy (TEM) observations were sampled from the edge of HPT-processed Mo disks, then mechanically polished until the thickness of the tip was less than 5 μm, and followed by ion milling at −100 °C, with low energy (3.5 keV) and low angle (<4°). TEM and HRTEM observations were carried out using a JEOL 2010F microscope (Tokyo, Japan) operating at 200 kV. The point-to-point resolution is ∼0.2 nm and the information resolution is ∼0.12 nm.
B. MD simulation method
To investigate the dislocation characteristics in bcc system, we performed a series of MD simulations using LAMMPSReference Plimpton38 to relax rigid single dislocation models, using the Mo embedded atom method potential.Reference Daw and Baskes39 The method used to build the rigid dislocation models with edge components could be found elsewhereReference Osetsky and Bacon40 and is briefly described here. Starting from a sufficiently large simulation cell, the edge dislocations were created by removing half-atomic planes at the center according to the Burgers vectors and slip planes. In this study, the sizes of the models along x and y directions were ∼20 nm, which were sufficiently large for relaxation,Reference Osetsky and Bacon40 while the thickness in the z direction was set at ∼4.5 nm. All the three boundaries are periodic but there is a ∼1-nm vacuum layer along the y direction. For each model, the simulation cell contains more than 110,000 atoms and was relaxed at 300 K. After relaxation, the simulation cells were minimized with the uncertainty in potential energy below ∼10−12 eV/atom.
C. High-resolution image simulation
To compare with the experimental HRTEM images, we performed high-resolution image simulation using QSTEMReference Koch41 with the multislice method to investigate the reasonability of the relaxed models. The simulation parameters were taken from those of JEOL 2010F with a Cs of 0.5 mm and a Cc of 1.1 mm. Models for image simulations came from the relaxed dislocation models from MD simulations. To avoid artifacts, models for the line-on dislocations had sufficiently large sizes along x and y directions (about 10 × 10 nm).
III. EXPERIMENTAL RESULTS
A. Analysis of possible dislocations with edge component in bcc system
To help understand HRTEM observations, it is useful to first analyze what edge components are expected in HRTEM micrographs taken from the most frequently used zone axes of <111>, <100>, and <110>. In bcc structure, ½<111> is the shortest lattice vector and therefore is also the Burgers vector of perfect dislocations. As discussed in Sec. I, the <001> dislocation may also exist, although it has not been observed experimentally before. Hereafter, we assume that the dislocation line is always parallel to the zone axis, which is the ideal case for HRTEM imaging. As shown in Fig. 1, assuming that the zone axis is [1 $\bar 1$1] (parallel to line BP), a dislocation with a Burgers vector of ½[
 $\bar 1$11] (e.g., line PE) will appear to have an edge component of ½[
 $\bar 1$12] (line P1E) in the HRTEM image, which is the projection of the PE onto the (1
 $\bar 1$1) plane. Following the same method, we can also find that a dislocation with a [001] Burgers vector also has an edge component of ½[
 $\bar 1$12] in the HRTEM image, i.e.:
 $${\matrix{ {{\rm\!\!\!{Line \,PE}}\!\!:{\raise0.5ex\hbox{\scriptscriptstyle {\rm{1}}}\kern-0.1em/\kern-0.15em\lower0.25ex\hbox{\scriptscriptstyle 2}}[\bar 111]} \cr \!\!\!\!\!\!{{\rm{Line \,BE\!\!: }}\,\,\,\,[001]} \cr } } \Bigg\}\buildrel {\!\!\!\!\!\!\!{\rm{projected \,\,on }}\,\,(1\bar 11){\rm{ \,\,plane}}} \over \hscale620%\longrightarrow⅓[\bar 112]\,{\rm{ Line\, P}}_1 {\rm{E}}{\rm{\quad.}}$$
Schematics of the projection of ½[ $\bar 1$11] and [001] Burgers vectors onto the (1
 $\bar 1$1) planes (observed from [1
 $\bar 1$1] zone axis) in a bcc crystal structure.

In other words, it is impossible to differentiate a ½[ $\bar 1$11] dislocation from a [001] dislocation from the [1
 $\bar 1$1] zone axis. Therefore, it is necessary to analyze all possible edge components of the ½[
 $\bar 1$11] and [001] dislocations under the three most frequently used zone axis so as to find appropriate conditions to take HRTEM images. Table I summarizes all the edge components of these two Burgers vectors when observed from the zone axes of <111>, <100>, and <110>. It is clear that the ½[
 $\bar 1$11] full Burgers vector can only be observed from the <110> zone axes, whereas the [001] full Burgers vector can be viewed from both <100> and <110> zone axes. On the other hand, both ½[1
 $\bar 1$1] and [001] Burgers vectors have the same edge components ⅓
 $ \lt 1\bar 21 \!\!> $ in <111> zone axes.
Edge components of the ½[ $\bar 1$11] dislocation and [001] dislocation observed in HRTEM images from <111>, <100>, and <110> zone axes in the bcc structure.

From the above analysis, it is clear that the <110> zone axes are the best axes to identify the dislocations with edge components in HRTEM investigations since it allows both ½[ $\bar 1$11] and [001] to be observed with full magnitude of the Burgers vectors. The <100> zone axis can be also used to identify <001> pure edge dislocation. In fact, we found from experiments that the <001> dislocations can be most easily found from <100> zone axes. The <111> zone axis cannot differentiate a ½[1
 $\bar 1$1] dislocation from a [001] dislocation and therefore should not be used in the HRTEM investigation of bcc structures. The condition for observing a full edge dislocation is to take the HRTEM image from a zone axis that is perpendicular to the Burgers vector and parallel to the dislocation line.
B. HRTEM observations of dislocations with edge components in NC Mo
1. Microstructures of NC Mo prepared by HPT
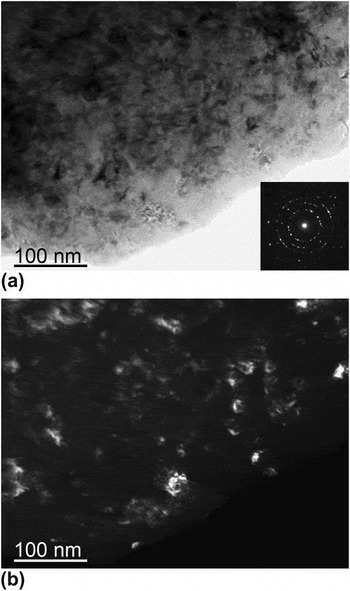
Typical microstructure of HPT-processed NC Mo is shown in Fig. 2. The inset in Fig. 2(a) is a corresponding selected area electron diffraction pattern from a selected circular area with a diameter of ∼120 nm, which shows nearly continuous rings. It implies that the grain sizes are below 100 nm, which is confirmed by the dark field TEM image in Fig. 2(b). Meanwhile, a very high density of dislocations with edge components is identified in NC Mo by HRTEM (Figs. 3 and 4). This observation is very different from that in CG bcc metals where the observed ½<111> dislocations are mostly screw typeReference Hsiung12 but is consistent with HPT-processed NC Ta in which a high density of dislocations with edge components was also observed, although no analysis was done to determine their Burgers vector.Reference Wei, Pan, Wu, Schuster, Kecskes and Valiev33 Analysis of a number of HRTEM images indicates that the average density of dislocations with edge components within the nanograins is of the order of ∼1016 m−2. As discussed later, this observation has significant effect on the mechanical behavior of NC bcc metals.
Bright field (a) and dark field (b) TEM images of HPT NC Mo. The inset in (a) is a corresponding diffraction pattern taken from a selected circular area with a diameter of ∼120 nm.

Experimental and simulation HRTEM images that show possible dislocations with edge components in the [110] zone axis. (a), (c), and (e) correspond to ½[ $\bar 1$11] pure edge dislocations (D1) in NC bcc Mo; (b) shows ½[1
 $\bar 1$0] (D2) and ½[001] (D3) edge components from [100] and ½[111] dislocations, respectively. (d) and (f) present the simulation results of ½[111] mixed dislocation with an edge component of ½[001]e (D3). The defocus values and the foil thickness for the simulated images are also given.

HRTEM observation of possible dislocations with edge component in [100] zone axis. (a) [001] pure edge dislocation (D4) and (b) ½[0 ${\rm{\bar 1}}$1] edge component (D5) from the ½[1
 $\bar 1$1] dislocation.

2. HRTEM observations of dislocations with edge components in NC Mo
To investigate the dislocations with edge components in details, we took HRTEM images from the two zone axes: [110] (Fig. 3) and [100] (Fig. 4). As discussed earlier, the [111] zone axis is not suitable for characterizing the edge dislocations and therefore was not used in this investigation.
a. [110] zone axis
Possible dislocations with edge components observed from the [110] zone axis are shown in Fig. 3 (marked by D1 to D3). Figure 3(a) shows a perfect pure edge dislocation (D1). From the Burgers circuits marked by the white line, it can be found that the Burgers vector for the dislocation D1 is ½[ $\bar 1$11]. This is the first report of the observation of a perfect pure edge dislocation in a bcc metal under HRTEM.
Figure 3(b) shows two different edge components (D2 and D3) observed from the [110] zone axis. The dislocation D2 has a ½[1 $\bar 1$0] edge component and the dislocation D3 has a ½[001] edge component. From Table I, it can be deduced that the dislocation D2 is from a [001] dislocation with an edge component of ½[1
 $\bar 1$0] and the dislocation D3 is from a ½[111] (or ½[
 $\bar 1$\bar 1$1]) dislocation with an edge component of ½[001].
To further verify our analysis of the HRTEM images, we built two dislocation models for the D1 and D3 dislocations, respectively, and then relaxed the models using MD simulation. The relaxed dislocation models are shown in Figs. 3(c) and 3(d). Figure 3(c) is for the ½[ $\bar 1$11] edge dislocation (D1) with a slip plane of (
 $\bar 1$1
 $\bar 2$). Figure 3(d) is for the ½[111] mixed dislocation (D3) with an edge component of ½[001]. The simulation of HRTEM images requires the values of the defocus and the foil thickness.Reference Spence42, Reference Cheng, Tian, He and Guo43 These values can be determined by comparing simulated HRTEM images with the experimental images. Taking the ½[
 $\bar 1$11] pure edge dislocation as an example, the values of defocus and foil thickness are determined as ∼70 and ∼6.7 nm, respectively, by comparing a series of images of bcc Mo with or without the dislocation (see Supplementary Figs. S1 and S2) with the experimental high-resolution image in Fig. 3(a). The simulated image is shown in Fig. 3(e), which agrees well with the HRTEM image [Fig. 3(a)].
The simulated image of ½[111] mixed dislocation (D3) is shown in Fig. 3(f), which clearly shows a ½[001] edge component, although the dislocation has a screw component. It agrees well with the HRTEM image of D3 in Fig. 3(b). From the analysis of the HRTEM images and the simulations, we conclude that the D2 and D3 dislocations in Fig. 3(b) can be identified as mixed dislocations of with the Burgers vectors of <100> (D2) and ½<111> (D3), respectively.
b. [100] zone axis
Although the [001] dislocation can be theoretically observed from two of the six <110> zone axes according to Table I, we did not find any <001> dislocation in images from those zone axes after examining hundreds of HRTEM images from different nanograins in NC Mo. In contrast, we found it easier to find <001> dislocations from the <100> zone axes. This is not surprising because each [001] dislocation can be observed from two (e.g., [100] and [010]) of the three <100> zone axes according to Table I, making the possibility of observing a [001] dislocation much higher than using a <110> zone axis. Figure 4(a) displays a single edge dislocation (D4) with a Burgers vector of [001], as determined from the Burgers circuit. This is the first time that a [001] dislocation is confirmed in bcc metals. The observation of [001] dislocation under HRTEM suggests that a relatively high density of [001] dislocations may exist in the NC bcc Mo. Otherwise, the probability of finding such dislocations will be relatively low, considering that the HRTEM can only observe localized small areas.
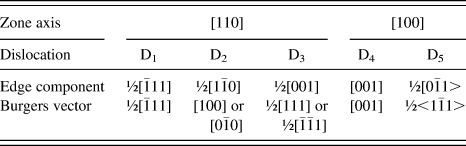
In addition, we also observed three other edge components in a HRTEM image from the [100] zone axis, see D5 in Fig. 4(b). These dislocations (D5) have a ½[0 $\bar 1$1] or ½[011] edge component. From Table I, it can be deduced that they are from ½<111> dislocations. The dislocations D1 to D5 observed by HRTEM in this study are summarized in Table II.
IV. DISCUSSION
The observation of a high density of dislocations with edge components in NC bcc Mo suggests that edge or mixed dislocations played a significant role in its deformation. This is in sharp contrast with CG bcc metals, in which screw dislocations mainly contribute to the deformation, even if the edge dislocation is considered to have a higher mobility than the screw dislocation and disappear after deformation in CG bcc metals.Reference Wei44, Reference Wei, Cheng, Ramesh and Ma45 The observation here is consistent with that in NC Ta, in which a high density of dislocations with edge components was observed.Reference Wei, Pan, Wu, Schuster, Kecskes and Valiev33 This change of deformation mechanism in NC bcc metals may affect the mechanical behavior. It is well known that the strain rate sensitivities of CG bcc metals are much higher than CG fcc metals. This was attributed to the screw dislocations that control the deformation in bcc metals. A perfect screw dislocation ½[111] is believed to dissociate onto three different {110} slip planes or three different {112} slip planes.Reference Hirth and Lothe46, Reference Amelinckx47 Since the core of the ½[111] screw dislocation is spread onto three different slip planes, this makes it very hard for the screw dislocation to slip on any of the slip planes. Consequently, the slip of the screw dislocations in bcc metals is believed to proceed via side movements of edge kinks, which leads to higher strain rate sensitivity in bcc metals than in fcc metals.
From the above discussion, it can be expected that the strain rate sensitivity will be decreased in NC bcc metals because the edge and mixed dislocations are playing a significant role in the deformation, which reduces the influence of screw dislocations on the mechanical behavior. Indeed, it has been reported that NC bcc metals have lower strain rate sensitivities than their CG counterparts, which is a behavior that is opposite to fcc metals.Reference Wei44 This behavior has been explained by higher flow stress in NC bcc metals, which helps the movement of kinks.Reference Wei44 Our observations here suggest that the reduction of strain rate sensitivity in NC bcc metals might be primarily caused by the high density of edge dislocations and mixed dislocations with edge components, whose gliding is much easier and less affected by the strain rate as compared with screw dislocations. Moreover, our recent studiesReference Cheng, Jian, Xu, Yuan, Millett and Zhu48 about the grain size effects on dislocation density in HPT-processed Mo confirmed that the increase of edge and mixed dislocations would contribute to the decrease of strain rate sensitivity.
V. CONCLUSIONS
The following conclusions can be derived from our systematic HRTEM study and analysis:
(i) ½<111> and <001> pure edge dislocations were observed for the first time in bcc systems.
(ii) The best zone axes for studying the dislocation structures in bcc systems are <110> and <100>, from which the characteristics of edge or mixed dislocations can be determined unambiguously in most cases.
(iii) Edge dislocations and mixed dislocations with edge components played a significant role in the deformation of NC bcc Mo. This might be the primary reason for the reported lower strain rate sensitivity of NC bcc metals and alloys as compared to their CG counterparts. Further study is needed to probe the mechanism for the increased role of edge and mixed dislocations in the deformation of NC bcc metals.
ACKNOWLEDGMENTS
This work was supported by the Laboratory Directed Research and Development program office of the Idaho National Laboratory. The authors wish to thank Dr. Dieter Wolf whose insight and discussions with the authors inspired and initiated the current study on bcc metals.