China began experiencing massive internal migration following the launch of economic reform in the 1980s. In 2007, rural–urban migrants accounted for about 10 per cent of China’s population,Footnote 1 while in 2010, 29.7 per cent of those with a rural origin lived in urban areas.Footnote 2 In 2020, around 35 per cent of the population lived in a different location to that where their hukou 户口 (household registration) was registered.Footnote 3
Child migration is a feature of China’s second wave of population migration, which began in the 2000s. Unlike the first wave, where most migrants were individual adults, the second wave is notably characterized by migration in family units that include children. The number of rural-to-urban migrant children has increased rapidly since the 2000s. In 2010, 12.8 per cent of children aged 0–17 were migrant children.Footnote 4 In 2020, the proportion of migrant children among the child population had reached 23.9 per cent.Footnote 5
Considering the vast urban–rural inequality in China and the urban–rural institutional segregation structured by the hukou system, how the migration experience affects children’s development has drawn substantial research attention.Footnote 6 Previous studies report mixed findings regarding the educational consequences of child migration depending on the comparison groups (migrants versus urban children or migrants versus rural non-migrants) and inference methods.Footnote 7 Furthermore, previous studies often treat migration as a one-off event when examining its consequences. However, national statistics indicate that the most common duration of migration for children is three to five years, which suggests that most migrant children would only live at their destinations temporarily.Footnote 8 Some children might experience multiple rural-to-urban and urban-to-rural transitions over time. In other words, within the migrant population, the migration trajectories vary greatly. While some migrate and stay in urban areas, others return to rural areas, and some move between rural and urban areas multiple times. The heterogeneities among different types of migrants have been largely overlooked in the literature. In previous studies, different types of migrants – for example, permanent migrants, migrant returnees, frequent migrants, within-province migrants and cross-province migrants – often share the same identity and are categorized as one group; their migration experiences, however, vary greatly. Human capital theory suggests that acquiring human capital is a cumulative process that depends on investments and inputs at various stages throughout one’s life course.Footnote 9 Educational achievement is not only affected by the most recent migration but also by every geographical move the individual has experienced prior to that. Therefore, using panel data and a newly developed analytical strategy, this study contributes to the literature by examining how an individual’s entire migration trajectory – rather than just one migration event – affects his or her educational attainment. Results indicate that, compared to permanent migration (i.e. those who migrated and stayed in urban areas), return migration and multiple migrations have a more negative impact on educational attainment.
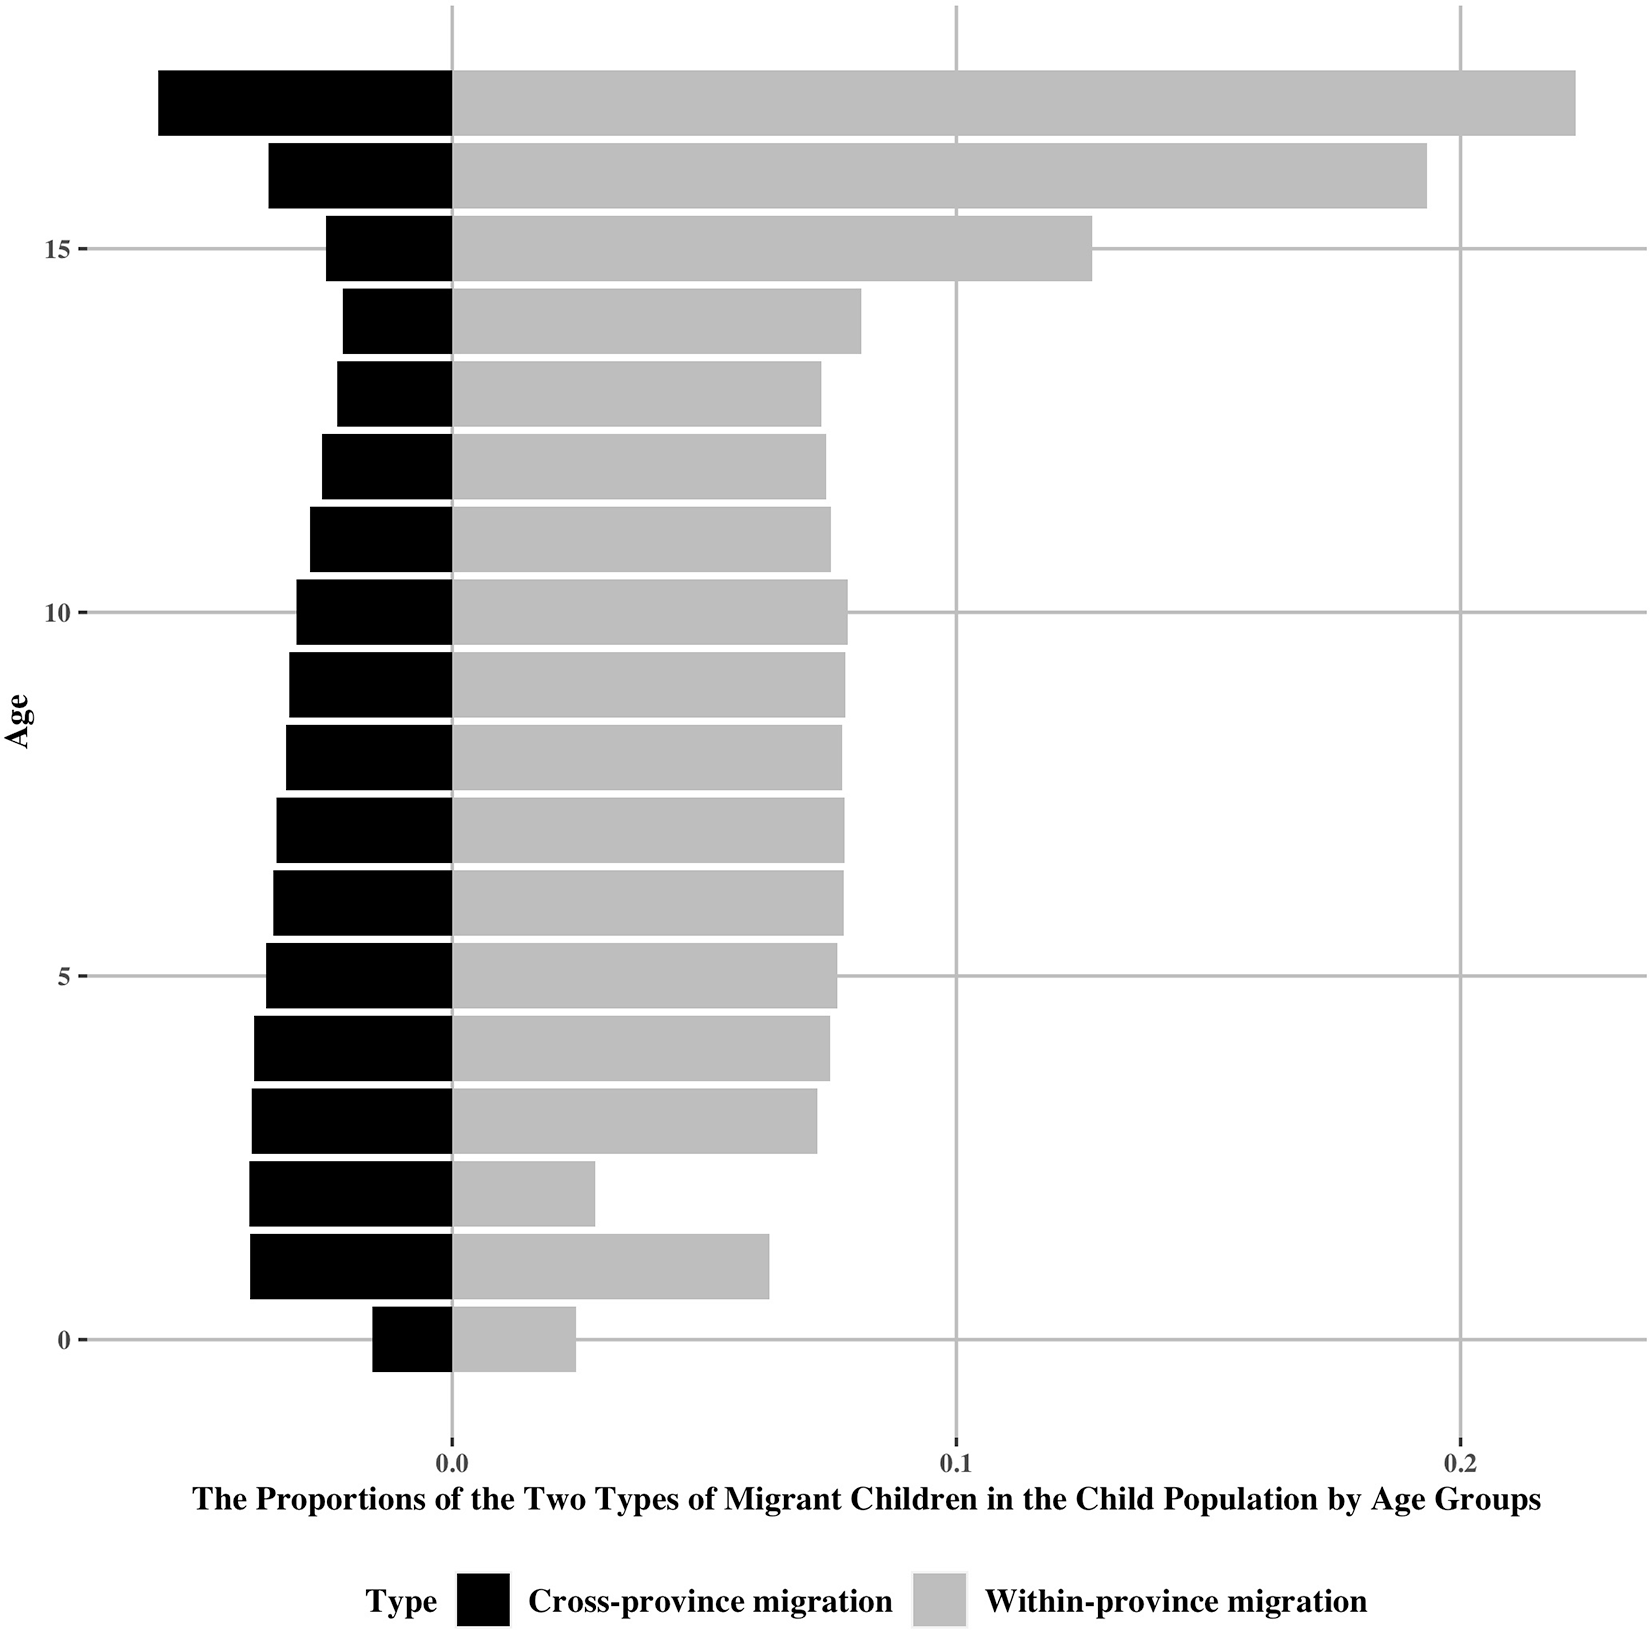
Moreover, while there has been much focus on urban–rural inequality and segregation, this study highlights the importance of another type of segregation: segregation between provinces. Earlier works offer descriptive evidence of the growth in the number of interprovincial migrants; the proportions of interprovincial migrants among all migrants increased from 28 per cent in 1990 to 54 per cent in 2000.Footnote 10 According to the 2000 census, interprovincial migrants accounted for more than 50 per cent of the migrant population in 11 provinces. Regarding child migrants, Figure 1, based on the 2010 population census,Footnote 11 plots the distributions of the within-province migrants and cross-province migrants in the child population by age (0–17). As shown, interprovincial migrants account for between 3 and 5 per cent of the population in each age group. Although the proportion of migrants who move across provincial borders is growing, whether and how the interprovincial migration experience affects migrants’ development has received limited attention in the literature compared to the well-studied urban–rural divide. Different provinces typically have different curriculums and educational systems. Families and children who migrate between provinces must navigate different educational systems while also overcoming the challenges of rural–urban segregation and interprovincial segregation. This creates significant obstacles for migrants seeking to adapt. Results show that interprovincial migration has a stronger impact than intra-provincial migration on educational attainment. When migrating across provinces, children are not only more likely to drop out, even if they are enrolled in schools, their school performances are negatively affected by cross-province migration.
Distributions of Within-province Migrants and Cross-province Migrants in the Child Population by Age (0 – 17) in 2010

Finally, previous studies focusing on other outcomes of migration, such as earnings,Footnote 12 fertilityFootnote 13 and intimate relationships,Footnote 14 suggest that migration affects females and males differently. In terms of educational attainment, previous studies on the impact of parental migration on rural left-behind children in China show that the effect of parental migration is more detrimental for boys than for girls.Footnote 15 However, little is known about whether and how the children’s own migration experience affects boys and girls differently. Considering the tradition of son preference in China, the gendered expectations parents have regarding their sons’ and daughters’ education may be exaggerated by the increased cost of education and limited resources following migration. However, some recent studies argue that the dynamics of rural families are changing and that traditional paternalistic cultural norms are gradually shifting towards more gender-egalitarian family arrangements.Footnote 16 Thus, it is also likely that migration experiences do not lead to gendered educational outcomes. Findings from this study suggest that while the interprovincial transition harms school enrolment in the same way for both genders, the impact of rural–urban transitions on education is greater for males.
The rest of the paper proceeds as follows. The following section summarizes the relevant literature to produce testable hypotheses. The paper then presents the data and modelling strategy before introducing the results. The final section discusses the interpretations of the results from this study and their applications for future research.
Using the Literature to Produce Testable Hypotheses
Migration trajectories: the directions, durations and frequencies of migration
How migration affects one’s life chances is an important research question. Previous empirical studies report mixed findings on the impacts of migration on educational attainment in China. Some find evidence of positive effects, indicating that migrant children have comparable school enrolment rates to their urban-born peers in destination cities.Footnote 17 They have also been observed to perform better in language skills than their urban counterparts.Footnote 18 In contrast, other studies emphasize the restrictions and discrimination facing migrants in the cities, which result in a higher risk of dropping out and lower chances of school enrolment.Footnote 19 Some studies also report no significant effects of migration on school performanceFootnote 20 or emotional well-being.Footnote 21
Owing to data limitations, previous studies often treat migration as a one-off event when studying the consequences of migration. However, national statistics indicate that the most common duration of migration for children is three to five years,Footnote 22 which suggests that most migrant children would only temporarily reside at their destinations. Some studies point out that the duration of migration mediates the relationship between migration and educational outcomes, as rural–urban migrant children are more likely to be enrolled in school as they spend more time in their destinations.Footnote 23 Moreover, studies also stress that permanent migrants, defined as migrants who remain in their city destinations for more than five years, are a highly selected group with even higher school enrolment rates than urban local children. They have distinct experiences from temporary migrants, defined as those who stay in their destinations for less than five years.Footnote 24
The fact that most rural–urban migrants only stay temporarily in their city destinations implies that most migrants experience migration in two directions: they migrate to urban areas and later return to rural ones. However, the combined effect of migration and return migration on educational outcomes has received limited attention. Return migration is often mentioned in studies on the health consequences of migration as a source of selection bias known as the “salmon bias.”Footnote 25 It is argued that return migrants are negatively selected on health status – they tend to be less healthy than those who remain in the cities.Footnote 26 Therefore, when estimating the effect of migration on health, failing to consider return migrants will lead to biased conclusions. Analogously, regarding the educational consequences of migration, migration returnees are likely to face a higher risk of dropping out of school. Previous studies on migration returnees often focus on adults and emphasize that they accumulate human capital during migration, resulting in the increased likelihood of them engaging in non-agricultural activities and entrepreneurial activities upon their return.Footnote 27 Until recently, studies examined the scale and frequencies of return migration of children using national data.Footnote 28 However, there is a lack of nationally representative empirical evidence on the education of return migrants compared to rural non-migrants, rural left-behinds and urban migrant stayers. Nonetheless, several qualitative studies have demonstrated through interviews that the situation of migrant children is unsettling after their return home.Footnote 29 Their findings indicate that migrant returnees often face challenges when re-adapting to the rural schooling system. Compared to those who migrated and stayed in the cities, returnees are affected by both the rural-to-urban transition and the urban-to-rural transition. Their migration experiences frequently disrupt the continuity of their education. For return migration families, both parents and children have to navigate different education systems, which is likely to negatively impact the children’s educational attainment. Therefore, the first hypothesis is proposed as follows:
Hypothesis 1: Compared to permanent migration (i.e. migrating to and remaining in an urban destination), return migration has a stronger negative impact on educational attainment.
Moreover, some migrants might experience multiple rural-to-urban and urban-to-rural moves over time. These multiple transitions should lead to accumulated influences on educational attainment, according to human capital theory. However, previous studies using cross-sectional data do not take the entirety of migration history into account. Human capital theory posits that acquiring human capital is a cumulative process that depends on the investments and inputs at various stages throughout one’s life course.Footnote 30 In terms of the relationship between migration and educational achievements, it implies that one’s educational achievement at time t is not only affected by one or the most recent migration experience but by every geographical move the person experienced by time t. This cumulative process perspective has been adopted in previous studies examining, for example, the effect of multiple childbirths on earningsFootnote 31 and the effect of multiple parental migrations on children’s health.Footnote 32 Regarding child migration experiences, both current and past residential environments, alongside other educational resources and opportunities, should all play a role in shaping educational outcomes. In other words, educational attainment depends on current migration status and previous migration history. Therefore, the contemporaneous measure of migration used in previous studies is likely to underestimate the effect of migration. This study uses panel data to account for every observed migration experience(s). Thus, the second hypothesis is proposed as follows:
Hypothesis 2: Compared to permanent migration (i.e. migrating to and remaining in an urban destination), multiple migration experiences have a stronger negative impact on one’s educational attainment.
Intra-provincial migration versus interprovincial migration
In addition to the debate on methods and analytic strategies, the mixed findings also suggest that the effect of migration may vary across different groups. Urban destinations, on average, have better educational resources and more opportunities than rural areas. Migrants’ access to local resources is subject to institutional regulations at the destination cities. The degree of institutional segregation varies across regions,Footnote 33 which makes it reasonable to expect heterogeneous effects of migration on educational attainment for people heading towards different destinations. One way to gauge these heterogeneous effects is to investigate the differences between intra-provincial and interprovincial migration, as these two types of migration encounter different degrees of institutional barriers. Compared to intra-provincial migrants, who only need to cope with urban–rural segregation, interprovincial migrants face additional segregation at the provincial level on top of the urban–rural divide. Since the 1980s, the decentralized education-funding system has transferred responsibility for financing public education from the central government to provincial-level governments.Footnote 34 This has given provincial governments considerable power to manage their own educational practices. As a result, different provinces usually use different textbooks and have different examination papers for school enrolment. Thus, children who migrate between provinces need to navigate different educational systems. Moreover, owing to long-existing regional inequality,Footnote 35 local governments are reluctant to grant people from other provinces access to their local educational resources. Therefore, children who migrate across provinces encounter two major setbacks: rural–urban segregation and interprovincial segregation. Furthermore, studies also find that, compared to interprovincial migration, children are more likely to stay together with their mothers during intra-provincial migration.Footnote 36 The care and benefits of living with a parent or parents may provide a greater buffer for intra-provincial migrants, helping them to cope with the challenges of adaptation. Thus, the barriers to integration are lower for intra-provincial migrants than for interprovincial migrants. Based on the above, Hypothesis 3 is proposed as follows:
Hypothesis 3: Compared to intra-provincial migration, interprovincial migration has a stronger negative impact on one’s educational attainment.
Gender differences
Finally, previous studies focusing on other outcomes of migration, such as earnings,Footnote 37 fertilityFootnote 38 and intimate relationships,Footnote 39 suggest that migration affects females and males differently. For instance, research provides ample evidence that migration negatively impacts wives’ employmentFootnote 40 and earnings,Footnote 41 but not those of their husbands.Footnote 42 Regarding educational attainment, studies on migrants from Mexico to the United States indicate that, due to gender divisions in the internal and external labour markets, male Mexican migrants tend to be negatively selected, while females are positively selected.Footnote 43 In the case of internal migrants in China, gender differences have been documented in studies on the impact of parents’ migration on their rural left-behind children. Results show that the effect of parental migration is more pronounced for boys than for girls.Footnote 44 Scholars refer to the literature on the impact of family structure on education to explain the gender differences observed, which argues that boys are more vulnerable to non-parental care arrangements and psychological stressors. Parents’ absence, especially that of the father, exerts a more substantial negative impact on boys’ education than on girls’ education.Footnote 45 However, little is known about whether and how the children’s own migration experience affects boys and girls differently.
As mentioned, migrant children face institutional barriers and adaptation challenges in their education after relocating, which require parents to spend more effort in securing a school place and ensuring the continuation of their children’s education. The children’s schooling after migration will depend on how their parents weigh the educational investment against the extra associated costs and whether they perceive the additional years of a child’s education as valuable. In rural–urban migrant families, parents tend to have different expectations for their sons and their daughters, largely because the rural-origin population in China tends to adhere to relatively traditional gender norms and strong son preferences.Footnote 46 Sons are expected to be economically successful and to support the family in the future, while daughters are expected to be dependent and to focus on their relationship obligations.Footnote 47 Rural parents are therefore more inclined to invest in their sons’ education over that of their daughters. After migration, with the increased limitations on resources, we would expect the gendered expectations of parents on children’s education to be more pronounced. Parents would have a stronger incentive to ensure the continuation of their sons’ education. This would be particularly the case if there were multiple children in the household, as previous studies suggest that daughters with siblings usually take on the role of “quasi-parents” and caregivers.Footnote 48 Based on the above, Hypothesis 4a is proposed as follows:
Hypothesis 4a: Migration has a stronger negative impact on females than males.
However, some recent studies argue that the dynamics of rural families are changing and that traditional paternalistic cultural norms are gradually shifting towards more gender-egalitarian family arrangements. The educational gap between females and males is closing within the rural population.Footnote 49 This is especially true for cohorts born after 1990. Even for rural girls with siblings, their educational attainment is no longer inferior to that of rural boys.Footnote 50 Studies also reveal that in rural families, parents no longer show gender bias when investing in children’s education.Footnote 51 As daughters outperform sons in school and achieve economic success in the labour market, rural families are gradually abandoning traditional patriarchal practices.Footnote 52 If this is the case, a competing hypothesis to Hypothesis 4a is proposed as:
Hypothesis 4b: Migration does not show different impacts between females and males.
Data and Methods
Data
This study uses data from the China Family Panel Studies (CFPS) 2010–2018.Footnote 53 The CFPS is a nationally representative longitudinal dataset of Chinese communities, families and individuals.Footnote 54 The baseline survey was launched in 2010 when 15,000 families and nearly 40,000 individuals were interviewed. Respondents are tracked through follow-up surveys biennially.
The CFPS has well-designed strategies to track respondents in the follow-up surveys, which facilitate the tracing and studying of migrants. When people migrate, several tracking strategies ensure that they are retained within the panel dataset. For example, if migrants can be contacted via telephone, they will be interviewed using the Computer Assisted Telephone Interviewing (CATI) questionnaires.Footnote 55 If not, the available family member who is most familiar with the migrants will complete a proxy report. Alternatively, a specialized follow-up team will follow the respondents to their new address.Footnote 56 In 2012, the wave retention rate for individuals in the baseline survey was 80.6 per cent. The success rate of interviewing respondents in a new place is 69.0 per cent.Footnote 57 The CFPS constructs individual panel weights to correct sample attrition and selection. Weights are applied in the analysis following the guidance in the CFPS User Manual.
Analytic samples
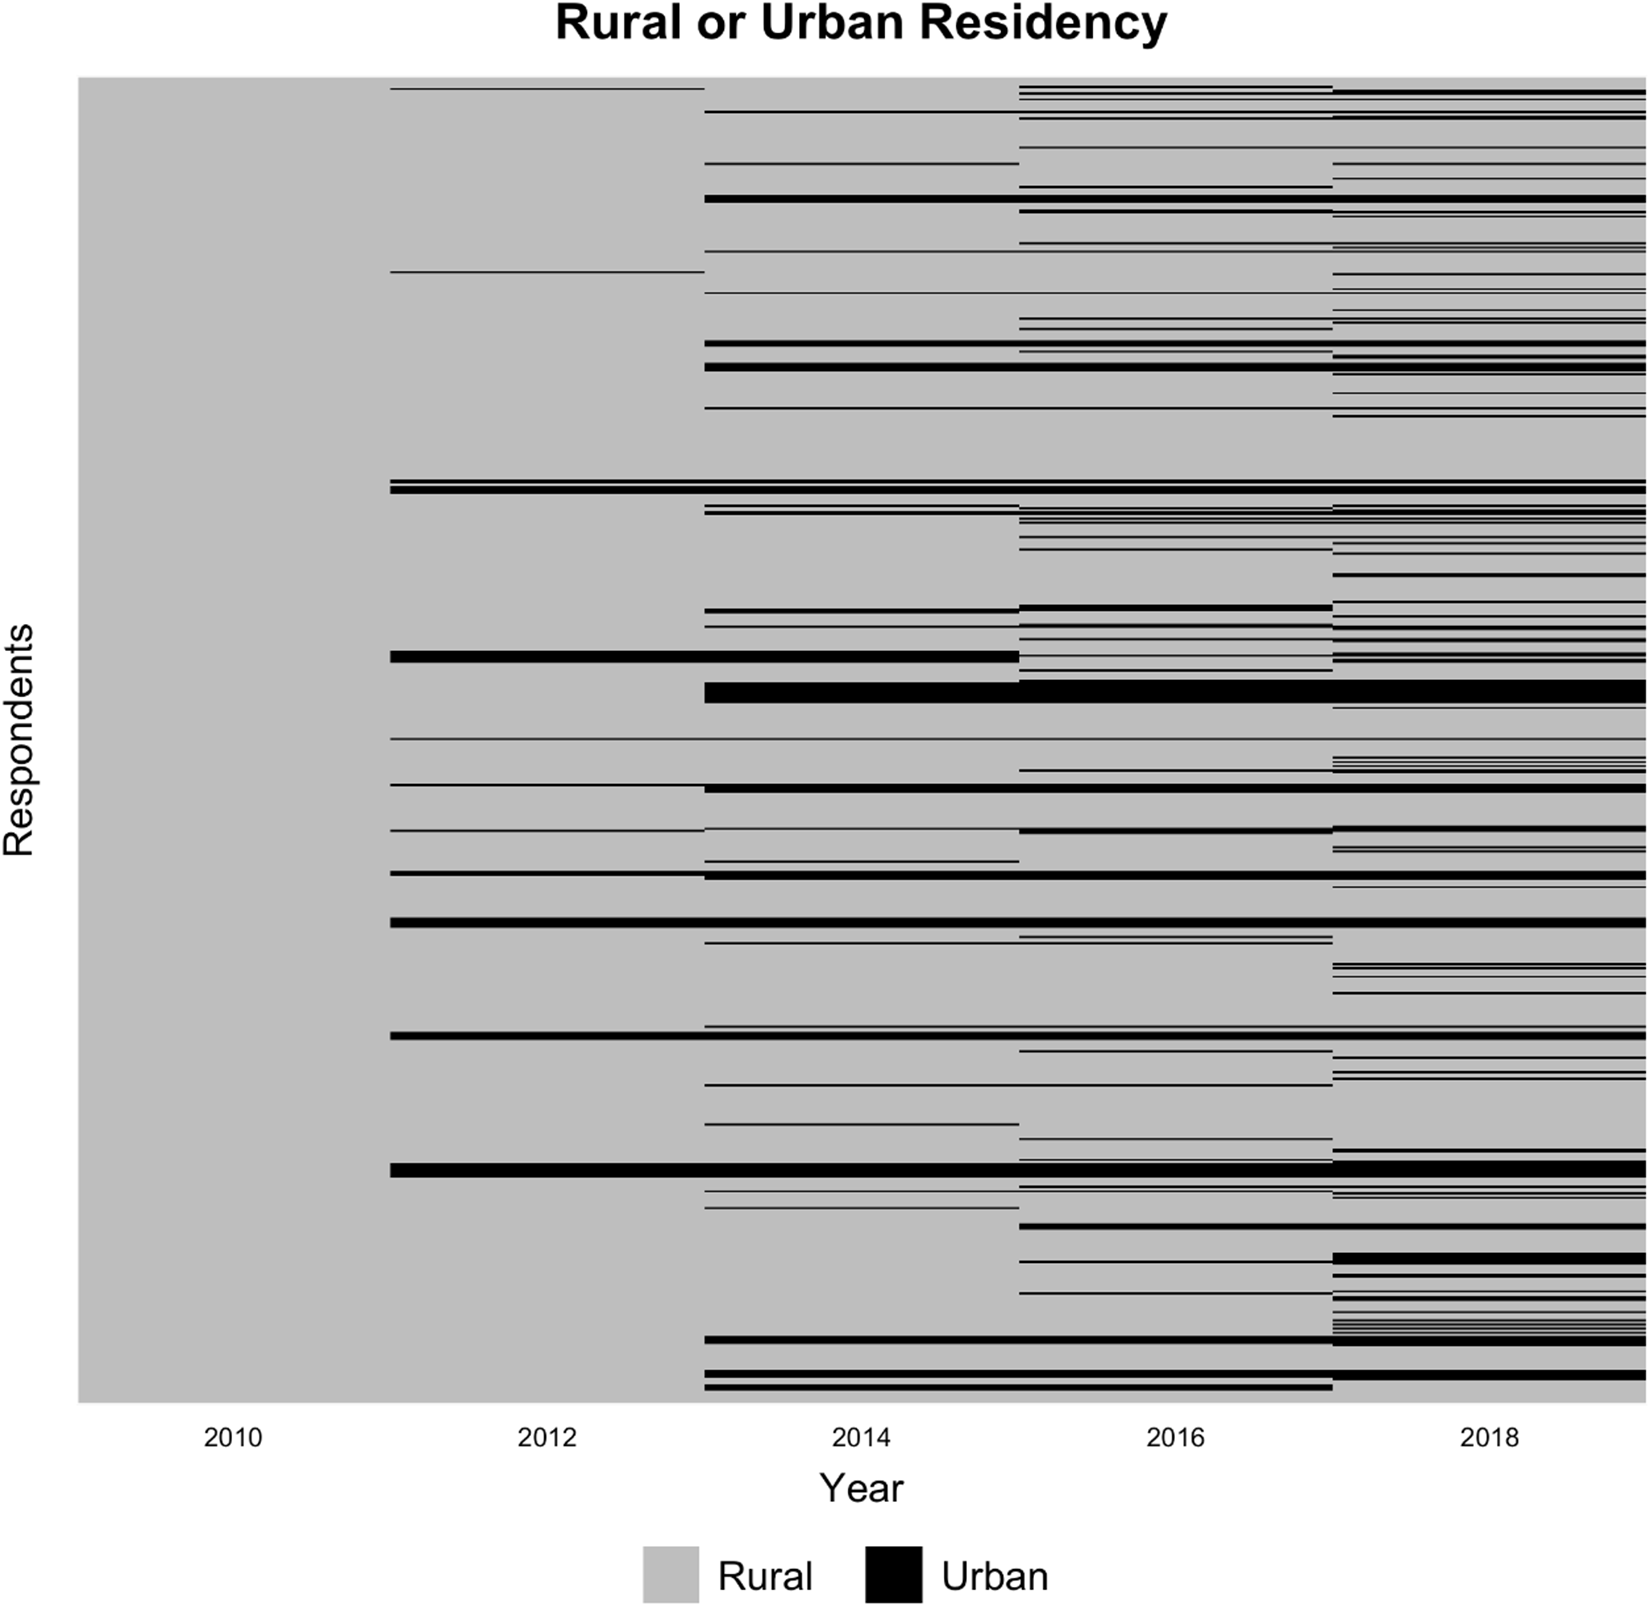
The analytic sample comprised rural non-migrants in 2010. These respondents were born in rural areas, held rural hukou status and lived in rural areas in 2010. The sample included rural non-migrant children under 15 in 2010 and tracked whether their places of residence changed between rural and urban areas in subsequent waves. After excluding cases with missing values, the final analytic sample included 4,494 respondents aged 3–14 in 2010, resulting in 11,734 person-year observations. Among the 4,494 respondents, 767 cases experienced residential changes between rural and urban areas, 115 cases migrated but returned to rural areas afterwards, and another 18 cases migrated twice between rural and urban areas. Figure 2 provides a snapshot of the transitions between urban and rural areas for 500 random cases taken from the sample during the observational periods. As shown, while some respondents migrated to and remained in urban areas, some moved back and forth between rural and urban areas. The latter scenario is rarely considered in previous studies but has become increasingly common among migrants.
The Transitions between Rural and Urban Residencies of 500 Respondents in the Sample

Methods and measurements
This study uses a person-year two-way fixed-effects linear regression model to estimate the effects of migration. The educational outcome is measured in three ways. First, the primary outcome variable is a binary indicator of whether the respondent is enrolled in school to receive education in the year of the survey (No = 0; Yes = 1). It is a time-varying indicator showing whether the children are reading in school at the time of the survey. Second, the children in the analytical sample grew in age from 3–14 in 2010 to 11–22 in 2018. As the respondents in the sample grew up, some would pass the compulsory school age and reach the turning point of whether to continue their education to high school at around 15 years old. Therefore, attaining high school or not (No = 0; Yes = 1) captures this vital outcome in educational progression. Finally, the analysis employs the number of completed years of schooling to measure an individual’s educational attainment. The sample is divided into two age groups: those aged 3–7 in 2010 (who were aged 11–15 in 2018), and those aged 8–14 in 2010 (who were aged 16–22 in 2018). Throughout the panel, the first group were of compulsory school age, but those in the second group faced the vital decision of whether to attend high school or not. By dividing the sample into these two groups, we can assess whether and how the effect of migration differs at different educational stages.
Regarding the key independent variable, this study uses four variables to portray the migration trajectory: (1) the instant change in rural and urban residency; (2) the cumulated effect of rural-to-urban migration(s); (3) the cumulated effect of urban-to-rural migration; and (4) intra-provincial or interprovincial migration. The precise analytical strategy and technical details are available in the online Appendix. Other control variables include the child’s age, age square, hukou status, annual expenditure on education and training, employment experience, marital status and the co-residency status of the children and their parents. In the analytic sample, there are four different types of co-residency status for children and parents: living only with the father (8.54 per cent); living only with the mother (11.21 per cent); living with both parents (68.21 per cent); and living with neither parents (12.05 per cent). The online Appendix Table A presents the descriptive statistics for all the variables used in the analysis.
Results
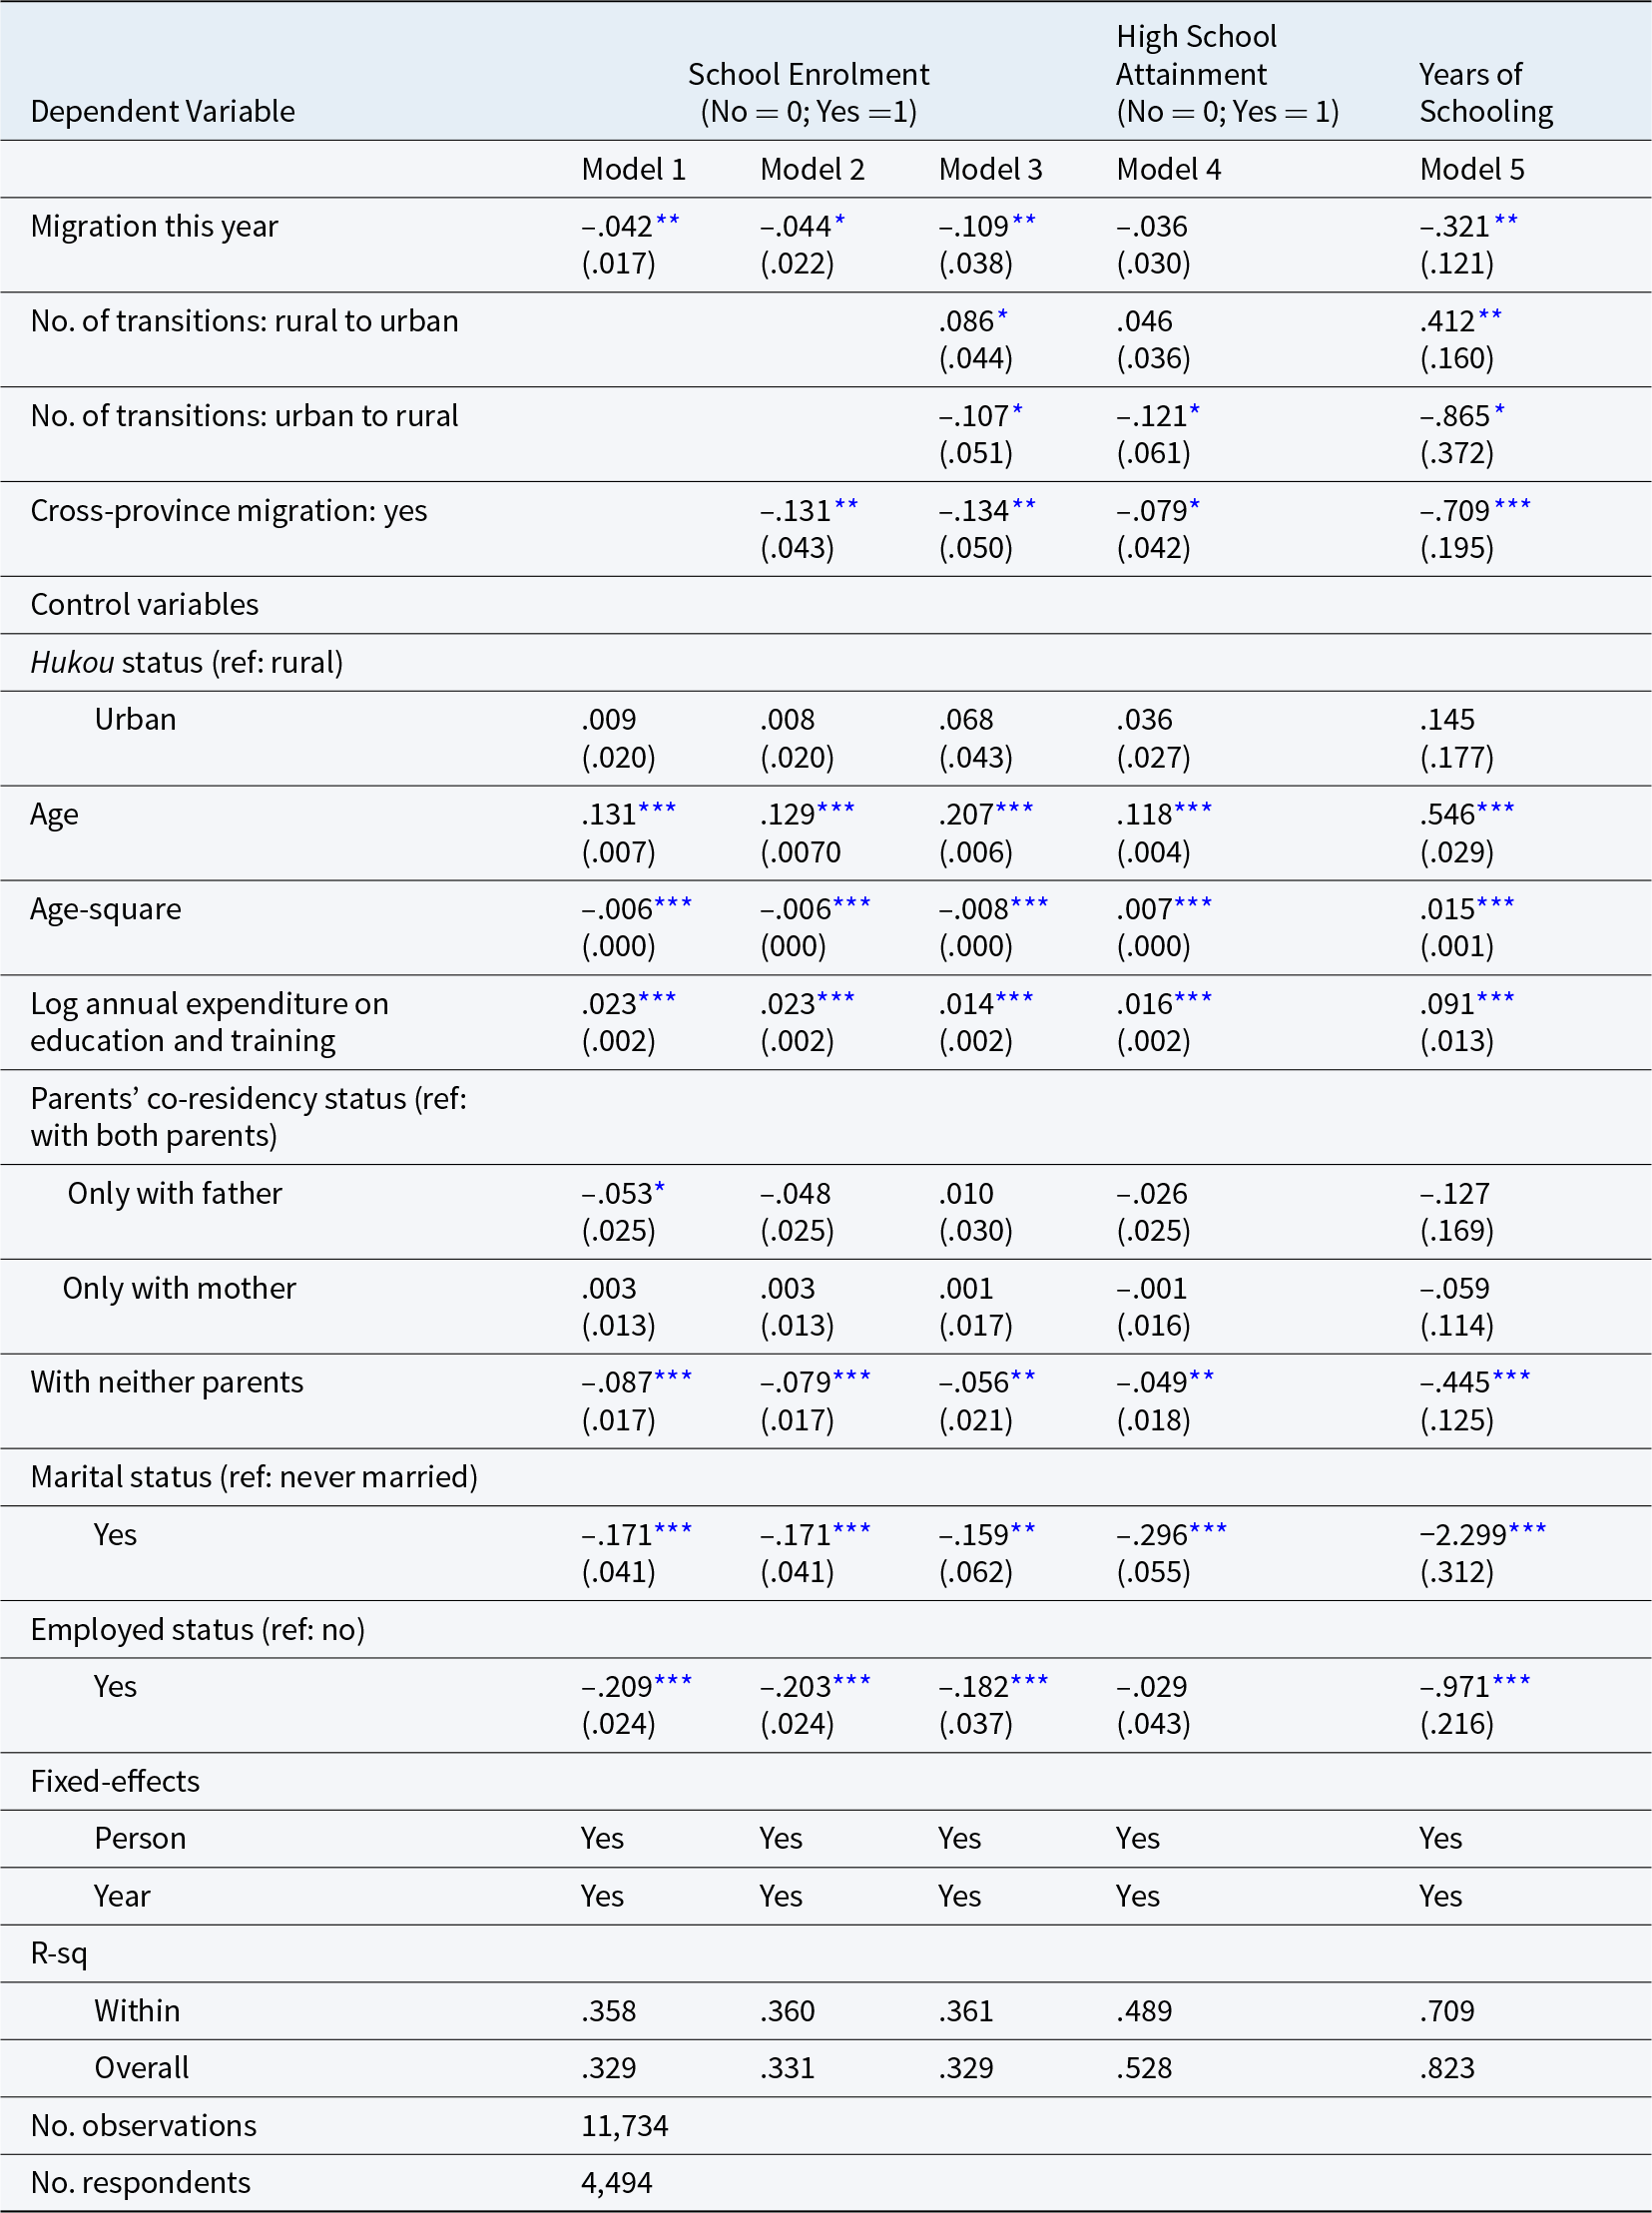
Table 1 presents results from the fixed-effect regression analysis for the entire sample. First, the baseline model, Model 1, considers only the effects of a transition between rural and urban residency on the probability of school enrolment. Results show that rural–urban migration is negatively related to educational outcome. After controlling for other time-varying covariates, experiencing a residency transition decreases the probability of enrolling in school by 0.042 (s.e. = 0.017, p<0.01). Next, in Model 2, the binary variable indicating interprovincial migration is introduced to capture the effect of migrating across provincial borders. As shown, the coefficient for the interprovincial migration is negative. When holding other factors constant, interprovincial migration decreases the probability of enrolling in school by 0.131 (s.e. = 0.043, p<0.01). Model 2 confirms Hypothesis 3 that the inter- and intra-provincial migrants face different levels of impact. According to the results from Model 2, experiencing intra-provincial rural–urban migration decreases a child’s probability of enrolling in school by 0.044. However, an interprovincial migrant suffers extra punishment from crossing provincial borders: interprovincial rural–urban migration decreases the probability of school enrolment by 0.175 (0.131 + 0.044), which is nearly four times stronger than the effect of the intra-provincial migration.
Fixed-effects Results of the Impacts of Migration on Educational Attainment

*** Notes: p<0.001, **p<0.01, *p<0.05. Robust standard errors are in the parentheses. Individual panel weights are applied to correct for attrition and selection.
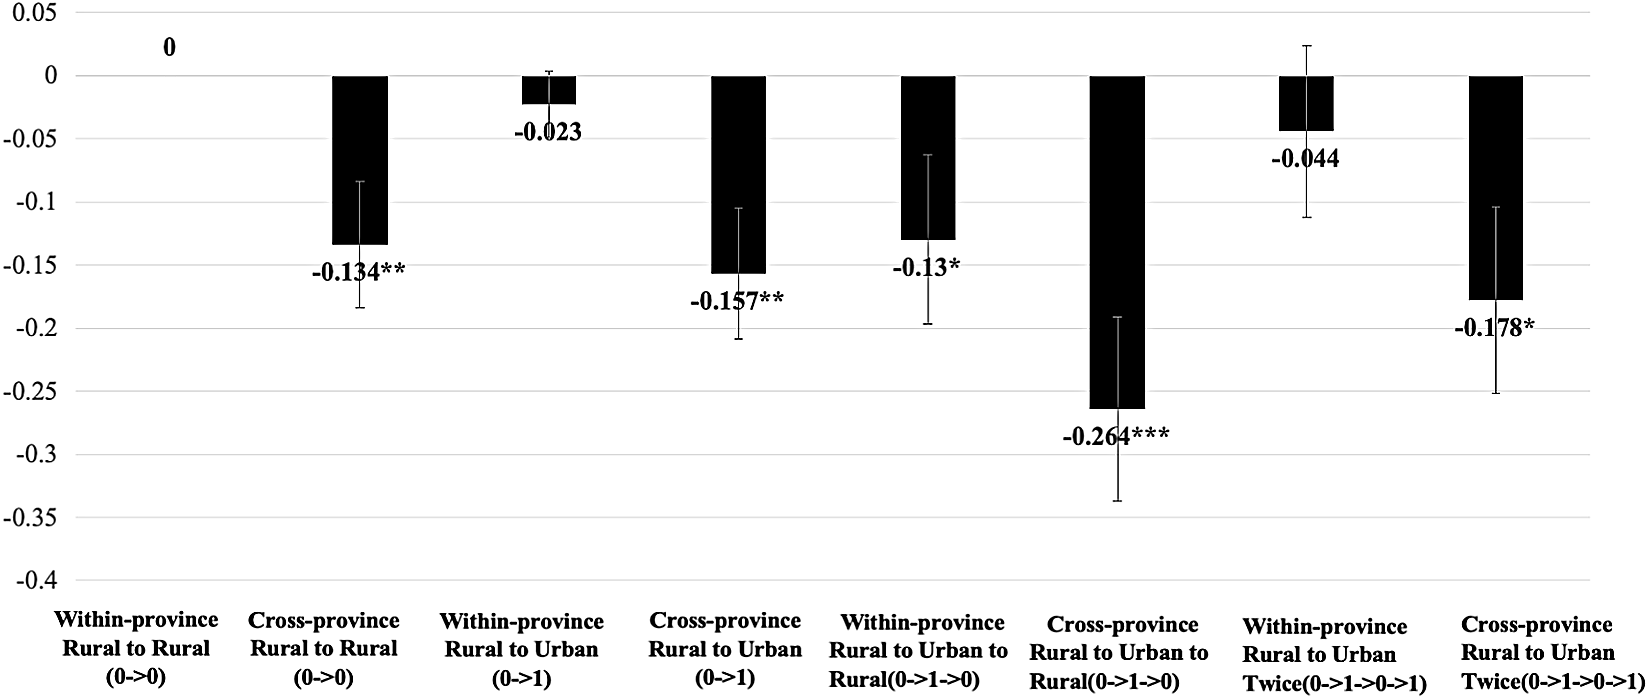
Model 3 further considers the directions and frequencies of migrations by adding two variables representing the cumulative number of transitions from rural to urban areas and from urban to rural areas. Results for these two variables show that every transition from a rural to an urban area increases a migrant child’s probability of school enrolment by 0.086 (s.e. = 0.044, p<0.05). Every transition from an urban to a rural area decreases the probability of school enrolment by -.107 (s.e. = 0.051, p<0.05). According to the results, experiencing a rural–urban residency change itself decreases a migrant child’s probability of school enrolment by 0.109 (s.e. = 0.038, p<0.01). If this migration increases the total number of rural-to-urban transitions experienced, the negative effect of migration will be partially offset by the benefits of migration(s) to a city. However, if this migration brings up the total number of urban-to-rural transitions experienced, the child will suffer increased disadvantages for returning to a rural area. Results from Model 3 allow us to consider various migration scenarios. The coefficients of the four migration indicators in Model 3 should be interpreted together, as their combined effects reveal how migration trajectories affect educational attainment. Figure 3 bears this out. It considers eight different scenarios and calculates their effects compared to staying in rural areas by combining relevant parameters in Model 3 and assuming that all other covariates are held at their means.Footnote 58 First, for rural–rural migrants, while results from Model 3 suggest no effect on school enrolment for an intra-provincial move, an interprovincial rural-to-rural move decreases the probability of school enrolment by 0.134 (s.e. = 0.050, p<0.01). Second, for the first rural-to-urban migration observed, if the migrant remains in the urban area, there is no effect found for within-province migration as the negative effect of moving cancels out the positive effect of moving to a city. However, the combined effect of cross-province migration is negative and statistically significant. Interprovincial rural-to-urban migration decreases a migrant’s probability of school enrolment by 0.157 (s.e. = 0.052, p<0.01). Next, for return migrants, intra-provincial and interprovincial moves negatively impact their school enrolments. For within-province returnees, the migration process from a rural to an urban area and then the return to a rural area in combination decreases their probability of school enrolment by 0.13 (s.e. = 0.067, p<0.05). As for cross-province returnees, the combined migration process decreases their probability of school enrolment by 0.264 (s.e. = 0.073, p<0.000). In alignment with Hypothesis 1, migration returnees suffer stronger impacts from their migration experiences than those who migrate and remain in the cities. Finally, results suggest that multiple intra-provincial rural–urban transitions have no significant effect on a migrant’s probability of school enrolment, while interprovincial moves decrease the probability of school enrolment by 0.178 (p<0.05). However, the results for the last two multiple transitions should be read cautiously because very few cases (N = 18) in the sample migrated twice from a rural to an urban area.
Estimated Effects of Different Migration Trajectories on the Probability of School Enrolment

Furthermore, the results reveal that age and family expenditure on education and training are positively associated with children’s educational attainment. However, as the children grow up, being employed or married is negatively associated with their education. More interestingly, the results also show that children’s co-residency status with their parents is an essential factor influencing their school enrolment. According to the results from Model 3, compared to living with both parents, living with only a father or only a mother does not affect one’s school enrolment in a statistically significant way; living with neither parent significantly decreases one’s chance of enrolling in school by 0.56 per cent.
In Model 4 and Model 5, the high school attainment and years of schooling completed are employed as the outcome variable. Aligning with the main findings, the results from Model 4 and Model 5 highlight the heterogeneity among migrants. First, according to Model 4, cross-province migration exerts a stronger negative impact than within-province migration on migrants’ high-school attainment rates (Hypothesis 3). For within-province migrants, if they remain in the urban area, it does not affect their chance of attending high school. However, if they migrate back from an urban area to a rural area, their chance of attending high school would decrease (Hypothesis 1). Finally, when using the years of schooling as the outcome, results from Model 5 confirm the findings and patterns from Model 3.
In summary, the above results indicate that first, for rural-origin children, a residential switch between a rural and an urban area decreases their chance of school enrolment. An additional penalty applies to school enrolment when the children move across the provincial border. Results from Model 3 and Figure 3 further illustrate that internal migrants suffer from different levels of impact depending on their migration directions, destinations and frequencies. Among the eight scenarios considered in Figure 3, the rural-to-urban migration returnees face a stronger penalty for school enrolment than those who remain in the cities (Hypothesis 1). Migration experiences demonstrate cumulative effects as multiple transitions lead to stronger impacts (Hypothesis 2). Furthermore, all four types of cross-province migrations demonstrate stronger negative impacts on education than within-province migrations (Hypothesis 3). While the rural–urban divide is greatly emphasized in the literature, provincial-level segregation has largely been overlooked. However, the results suggest that when crossing provincial borders, migrants face more substantial institutional barriers and must navigate different education systems, exams and curricula, leading to lower educational attainment. Cross-province migrants not only face challenges in enrolling in schools, but further analysis shows that even if they do enrol in schools, their academic performance is negatively affected by the migration. Cross-province migration leads to a statistically significant decrease in students’ overall performance, particularly in Chinese and mathematics, where their scores decline.Footnote 59
Heterogeneities by age groups
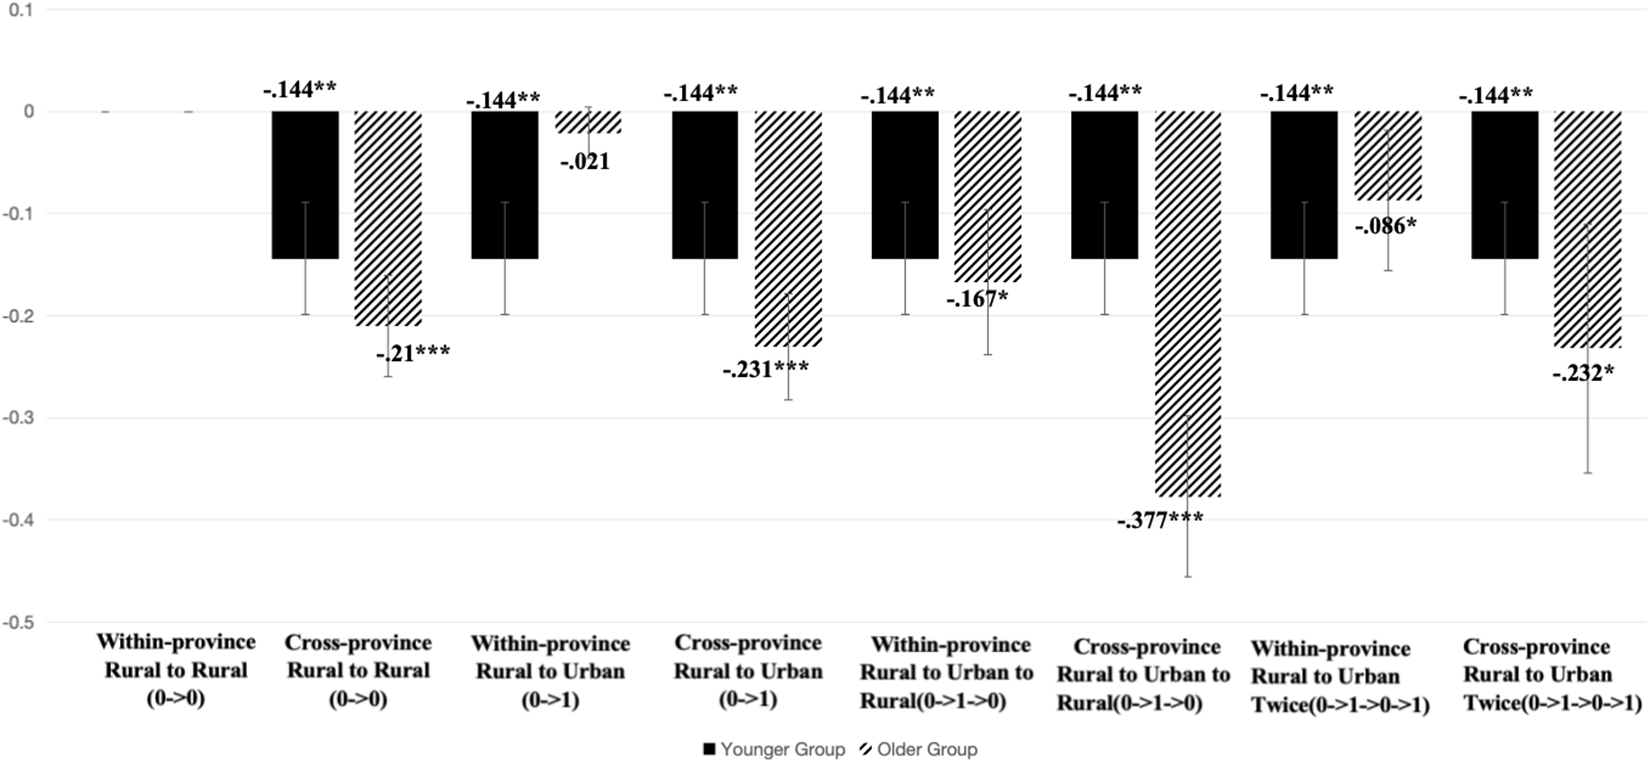
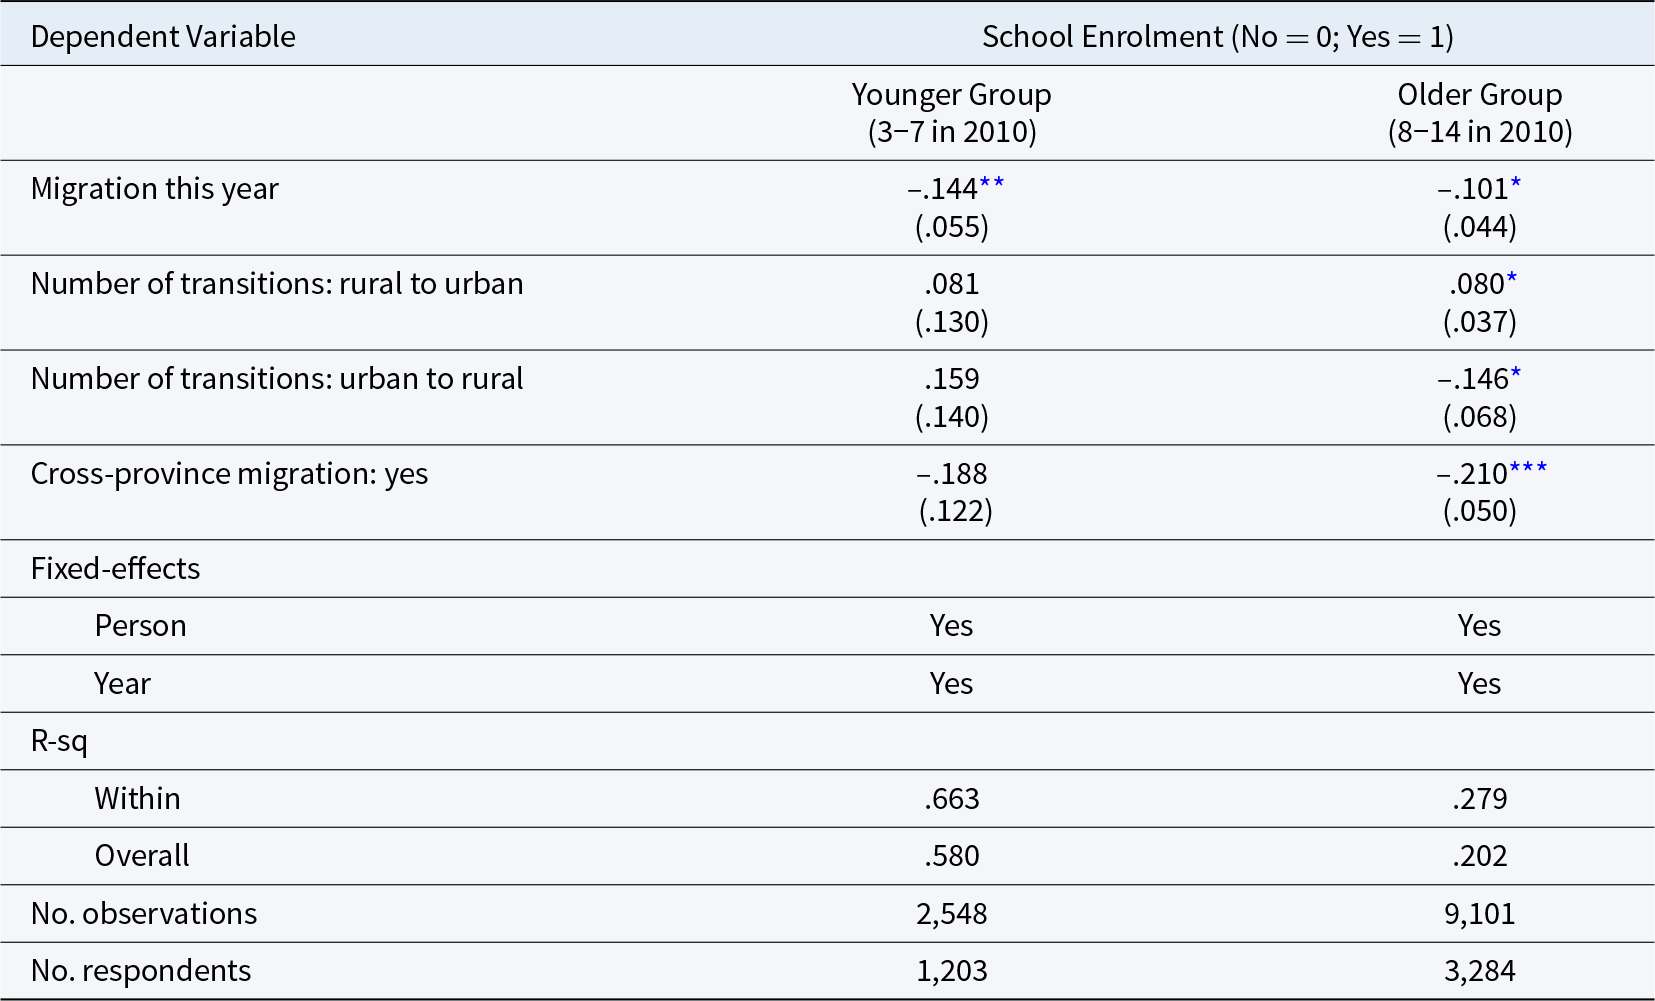
As mentioned above, since the respondents in the sample went through different educational stages over time, the study divided them into two groups and conducted the analysis separately. One group was composed of individuals aged 3–7 in 2010 (who were aged 11–15 in 2018), and the other group included those aged 8–14 in 2010 (who were 16–22 in 2018). The first group (the Younger Group) were of compulsory school age throughout the panel. In contrast, the second group (the Older Group) faced the vital decision of attending high school or not. Results are shown in Table 2. The impact of migration on educational attainment demonstrates different patterns by age group. For the Younger Group, who were of compulsory school age throughout the panel, migration exerts a constant negative impact on their school attainment as they move back and forth between rural and urban areas. In contrast, for the Older Group, who faced the decision to attend high school, such transitions exert more significant and varied impacts on their school enrolment. For the Older Group, a move between a rural and an urban area decreases the probability of school enrolment by 0.101 (s.e. = 0.044, p<0.05). However, if this migration brings up the total number of rural-to-urban transitions experienced, then the negative effect of migration will be partially offset by the benefits of migration(s) to cities by 0.080 (s.e. = 0.037, p<0.05). However, if this migration brings up the total number of urban-to-rural transitions experienced, the penalties of returning to rural areas will be increased by 0.146 (s.e. = 0.068, p<0.05). As shown in Figure 4, migration experiences create greater heterogeneity among the Older Group. For that group, all migration trajectories result in lower school enrolment chances than for the Younger Group. However, those who manage to stay in the urban areas are exempt from this educational disadvantage. The differences by age groups may stem from the fact that when children grow up and finish compulsory education, they face a decision about whether to continue their education each time they move between rural and urban areas. These moves increase the likelihood of them leaving the educational system.
Estimated Effects of Different Migration Trajectories on the Probability of School Enrolment by Age Groups

Fixed-effects Regression Results by Age Groups
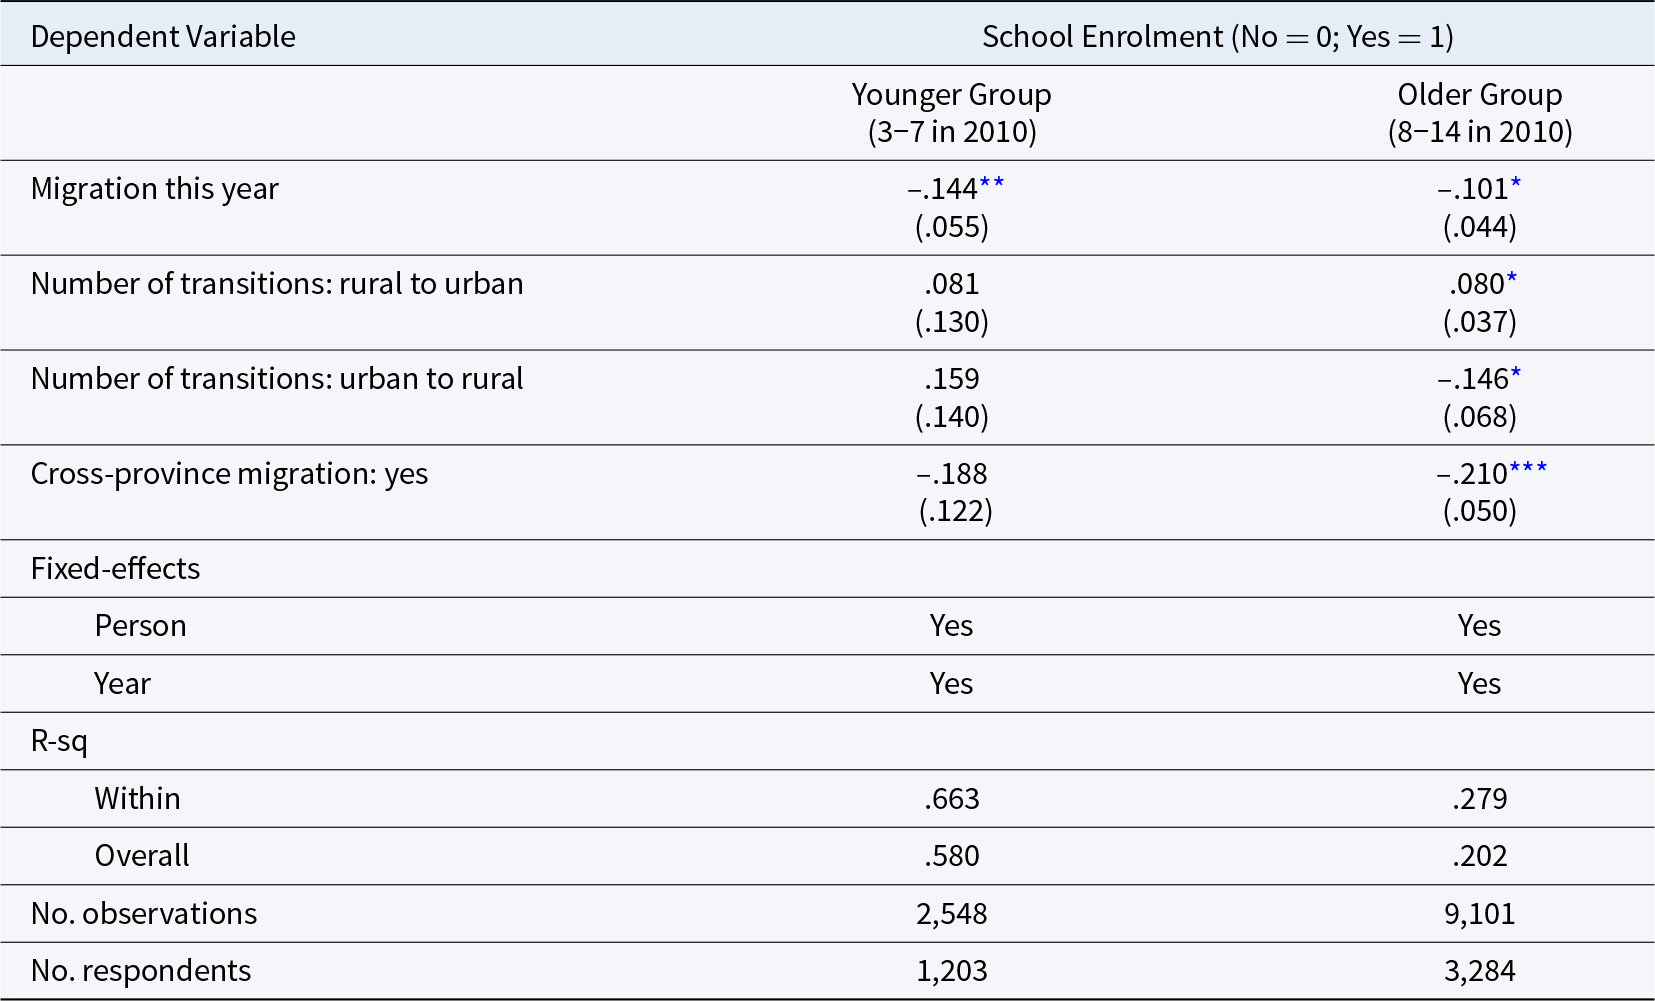
*** Notes: p<0.001, ** p<0.01, * p<0.05; Robust standard errors are in the parentheses. Coefficients for control variables, including hukou status, age, age square, annual expenditure on education and training, employment experience, marital status and co-residency status with parents, are omitted. Individual panel weights are applied to correct for attrition and selection.
Heterogeneities by gender
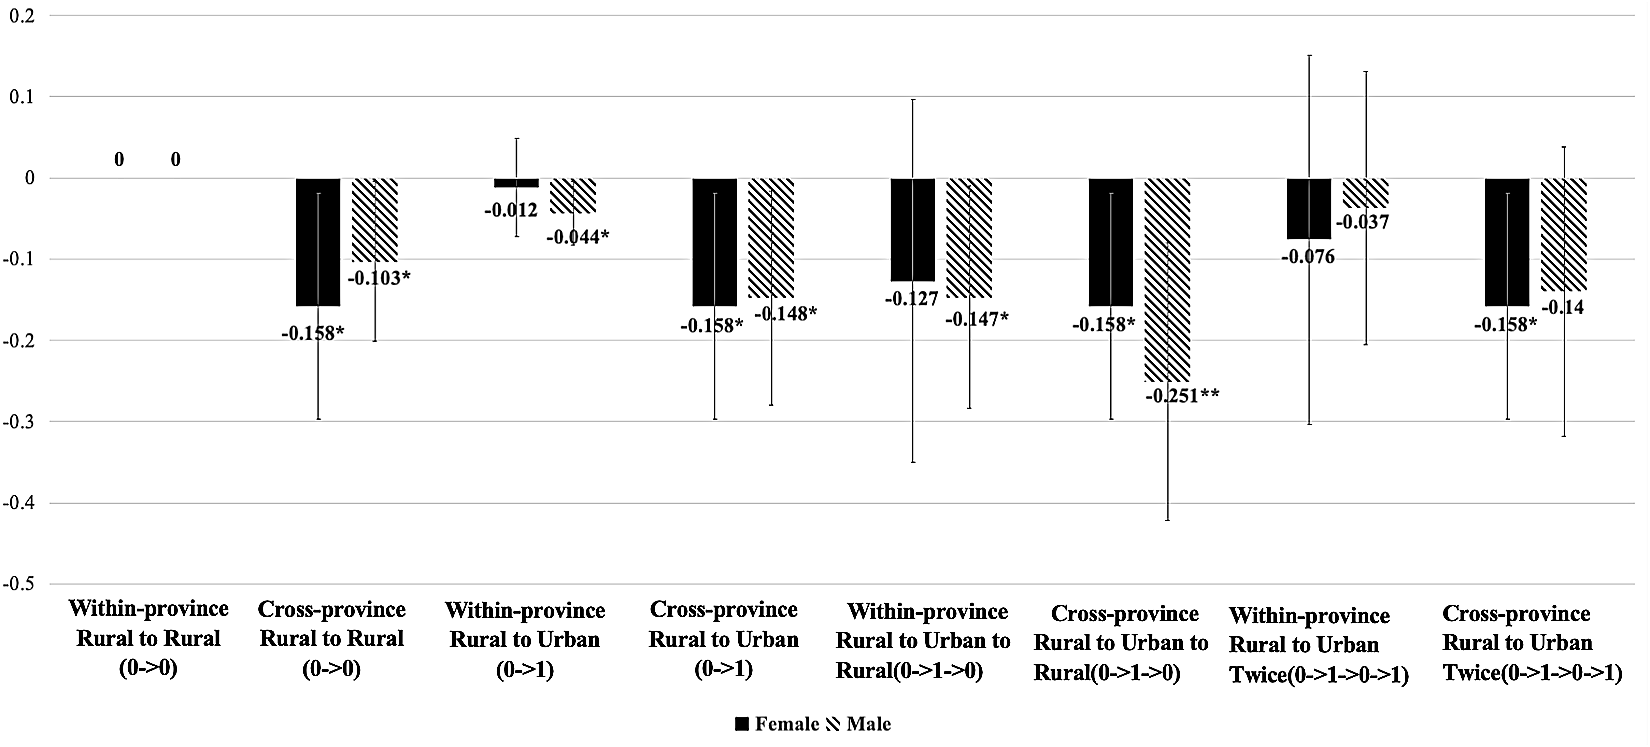
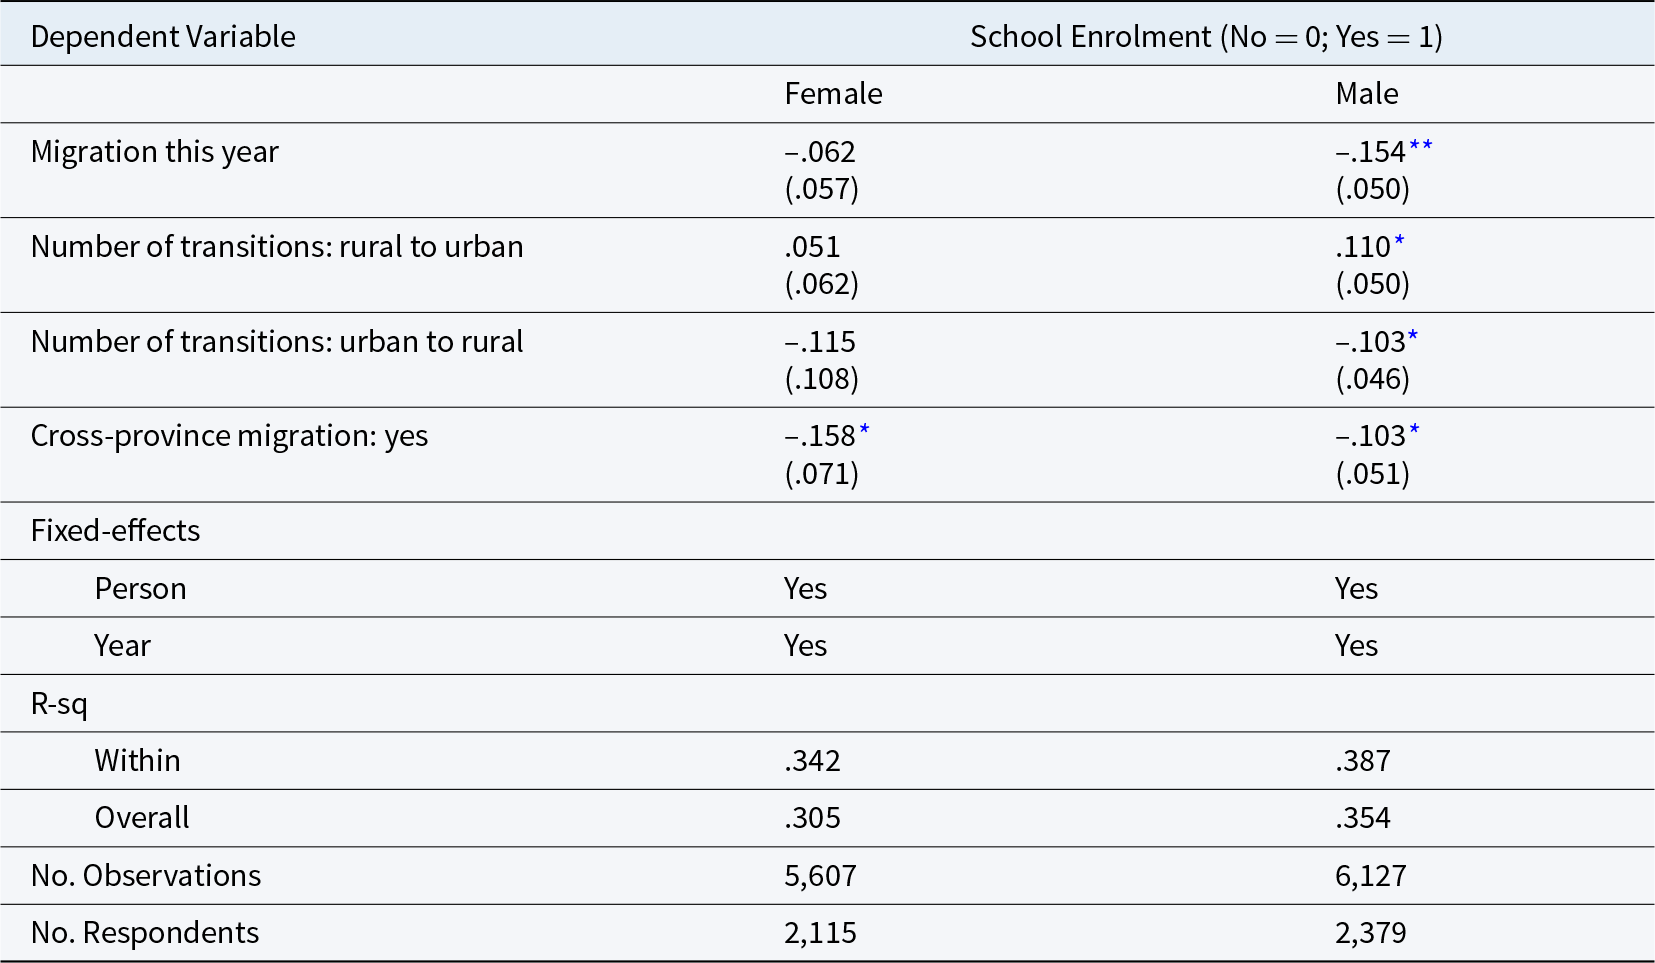
In addition, the study further examined whether the migration experience affects boys and girls differently. Results are presented in Table 3. As shown, the parameters for rural–urban migrations are only statistically significant for males, not females. Among males, a transition between rural and urban areas decreases the probability of school enrolment by 0.154 (s.e. = 0.050, p<0.01). Suppose this migration increases the total number of rural-to-urban transitions experienced. In that case, the negative effect of migration will be partially offset by the benefits of migration(s) to cities by 0.110 (s.e. = 0.050, p<0.05). However, if this migration increases the total number of urban-to-rural transitions experienced, the individual will suffer an additional penalty of 0.103 (s.e. = 0.046, p<0.05) for returning to the rural areas. The negative impacts of interprovincial migration hold for both genders. For females, experiencing a cross-province migration decreases their probability of school enrolment by 0.158 (s.e. = 0.71, p<0.05). It decreases the probability of boys’ enrolment by 0.103 (s.e. = 0.051, p<0.05). Using the same strategy as in Figure 3, the effects for the eight types of migrations by gender are presented in Figure 5. As shown, for females, the impact of the migration stems from crossing provincial borders. Only interprovincial migrants experience statistically significant decreases in the probability of school enrolment by 0.158 (s.e. = 0.071, p<0.05). However, males are affected by both rural–urban migrations and cross-province migrations. Among the eight types of migrations considered, for rural to urban migrations, the intra-provincial migration decreases boys’ probability of school enrolment by 0.044 (s.e. = 0.02, p<0.05). In contrast, interprovincial migration decreases boys’ probability of school enrolment by 0.148 (s.e. = 0.076, p<0.05). As for return migrants, the intra-provincial returnees experience a 0.147 (s.e. = 0.07, p<0.05) decrease in the probability of school enrolment, while the interprovincial returnees experience a 0.251 (s.e. = 0.087, p<0.01) decrease in the probability of school enrolment.
Estimated Effects of Different Migration Trajectories on the Probability of School Enrolment by Gender

Fixed-Effects Regression Results by Gender

*** Notes: p<0.001, **p<0.01, *p<0.05. Robust standard errors are in parentheses. Coefficients for control variables, including hukou status, age, age square, log family income, employment experience, marital status and family size, are omitted. Individual panel weights are applied to correct for attrition and selection.
Conclusion and Discussion
This study uses data from the China Family Panel Studies, 2010–2018, and fixed-effect models to estimate the effect of migration trajectories on educational attainment. Findings demonstrate the complex process and heterogeneous consequences of rural–urban migration in China. In previous studies, different types of migrants (i.e. permanent migrants, migrant returnees, frequent migrants, within-province migrants, cross-province migrants, etc.) are often given the same identity and are categorized as one group; however, in reality, their migration experiences vary greatly. For instance, the school enrolment of rural-to-urban within-province migrants who remained in the cities during the period of observation was not affected by migration. Rural-to-urban migration returnees, however, experienced the most substantial decrease in their likelihood of enrolling in school of all the groups considered. Moreover, heterogeneous effects are found for intra-provincial and interprovincial migrations. On top of the negative impact of a transition between a rural and an urban area, results show that interprovincial migration has a stronger impact than intra-provincial migration on migrants’ educational attainment. While the rural–urban divide is greatly emphasized in the literature, provincial-level segregation has largely been overlooked. The finding that the effects of migration differ between intra-provincial and interprovincial migration should encourage future research to explore the heterogeneity among migrants based on their destinations. Although several studies mention that different destinations attract migrants with various motivations and strategiesFootnote 60 and that local regulations for migrants vary by region,Footnote 61 little is known about how the variations among migration destinations shape the consequences of migration. Future studies should examine the effects of migration based on the combinations of origins and destinations.
Beyond the educational outcomes of Chinese internal rural–urban migrants, the proposed method should have broader applications. This strategy can estimate migration’s accumulated and heterogeneous impacts, generating testable hypotheses for studies on other types of migrants and other aspects of migration’s consequences. For instance, alongside the rapid pace of development, not only is the rural population in China moving to the urban areas, but the country is also experiencing a large-scale movement of people between urban areas. In general, the growing number of migrants who are moving from city to city can be divided into two groups. The first group is the urban citizens, i.e. those who live in the city with urban hukou (referred to as urban migrants for short). They move between cities for study, work, experiences, etc. The second group is the rural residents, who migrate to the city and move from city to city (referred to as rural migrants for short). Urban migrants are not covered in this study as they do not face the institutional barriers and challenges affecting rural migrants. Their education is also likely to be affected by migration; however, the underlying mechanism and their migration experiences will differ significantly from those of rural migrants. With the current data (CFPS), we can only identify those who migrate from rural areas to urban areas and those who migrate across provinces since the city information is confidential and not publicly available. However, the methodology proposed in this study can easily be applied to the between-city movements of urban and rural migrants when the appropriate data become available.
One limitation, however, is that the findings reported in this study can only be generalized to those children who migrated during the observed period and their observed migration experiences. The observation period of this study spans eight years. Although the CFPS offers the longest available longitudinal data with the required information for the migrant study, the relatively short observation window means that, during the observed period, only a limited number of cases involved multiple rural–urban migrations. This limitation reduces the explanatory power of the results regarding the cumulative impact of multiple migrations. However, when longitudinal data with longer observation periods become available, the analytic strategy proposed in this study should facilitate future studies to examine the cumulative effects of an individual’s complete migration history.
Moreover, the findings indicate gender differences in the educational consequences of migration. The results show that while the interprovincial transition decreases school enrolment equally for both genders, the impact of rural–urban transitions on education is greater for males. Contrary to the expectations of Hypothesis 4a and 4b, the results suggest that rural–urban migrations affect only boys. There are two possible explanations. First, the naught effect of rural–urban migrations for girls means that the probability of school enrolment does not change for girls before and after migration. As outlined above, rural-origin parents hold relatively traditional gender norms and strong son preferences,Footnote 62 leading to different expectations for sons and daughters. It could be that, compared to boys, before migration, girls are already less likely to be enrolled in school; thus, no effect is found after migration. If so, the gender differences in the findings reflect the disadvantaged position of rural-origin females in educational attainment compared to males. Second, previous studies suggest that boys are more vulnerable to early-stage stressors and changes in family arrangements.Footnote 63 It could be the case that boys adapt less well to changes in residency and are more likely to drop out of school and, thus, rural–urban transitions are found only to affect boys. Since girls tend to have better language and interpersonal skills, they are less likely to experience discrimination related to accents, allowing them to adapt to a new environment more quickly than boys. If this is the case, the gender differences found in this study should encourage future studies to investigate whether migrant boys and girls experience different levels of discrimination and what coping strategies they employ. Such an investigation could provide valuable insights to parents and teachers when developing targeted strategies to improve migrants’ educational attainment.
Supplementary material
The supplementary material for this article can be found at https://doi.org/10.1017/S0305741025000323.
Acknowledgements
The author thanks Richard Breen for his valuable comments and suggestions on an earlier draft of this paper. Earlier drafts were also presented at the IESR 2022 conference and the 2022 Cambridge workshop on “Chinese migration, diaspora, and mobility.” The author also thanks the participants for their helpful comments. This work is supported by the Chinese Scholarship Council and the “Youth Development Programme” at the Chinese Academy of Social Sciences(CASS) (Grant No. 2025QQJH76).
Competing interests
None.
Hanzhi HU is a research fellow at the Institute of Sociology, Chinese Academy of Social Sciences. Her research interests include family demography, gender and youth studies, and quantitative research methods. Her research articles have appeared in peer-reviewed journals including Population Research and Policy Review and China Youth Studies.