Introduction
Antarctic sea ice is a key driver in Southern Ocean biogeochemical cycles and ecosystem function (Arrigo Reference Arrigo2014). In September–October the sea ice covers an area of c. 19×106 km2 (c. 40% of the surface of the Southern Ocean). The sea ice contains an internal system of delicate brine channels and pockets, which serve as a habitat for a variety of organisms. Together with the organisms that live under the ice, these constitute the sympagic sea ice community (Schnack-Schiel Reference Schnack-Schiel2003). The large standing stock of the sea ice biota has an ecologically important role in the Southern Ocean. Ice algae and the associated sea ice microbial community are considered as a highly enriched and spatially confined food source for Antarctic krill during winter (larvae) and early spring (adults) when food in the water column is scarce (Meyer Reference Meyer2012).
Although sympagic organisms include many autotrophic and heterotrophic organisms, studies of the ice communities have mainly concentrated on ice algae and bacteria (Roberts et al. Reference Roberts, Craven, Cai, Allison and Nash2007). Therefore, little attention has been paid to the faunal components, and especially to microzooplankton (Garrison & Buck Reference Garrison and Buck1989, Kramer et al. Reference Kramer, Swadling, Meiners, Kiko, Scheltz, Nicolaus and Werner2011).
Microzooplankton include organisms between 20 and 200 µm in size. In the Antarctic sea ice, microzooplankton comprise mainly ciliates, heterotrophic dinoflagellates, foraminifers and the first larval stage of micrometazoans. Detailed investigations into the composition of the microzooplankton sympagic communities in Antarctica have generally focused only on specific protozoan groups, such as aloricate ciliates (Song & Wilbert Reference Song and Wilbert2000), heterotrophic dinoflagellates (Archer et al. Reference Archer, Leakey, Burkill, Sleigh and Appleby1996) and foraminifers (Spindler et al. Reference Spindler, Dickmann and Lange1990, Schnack-Schiel et al. Reference Schnack-Schiel, Dieckmann, Gradinger, Melnikov, Spindler and Thomas2001). Moreover, studies during the winter season are particularly scarce (Garrison & Buck Reference Garrison and Buck1989, Garrison & Close Reference Garrison and Close1993, Schnack-Schiel et al. Reference Schnack-Schiel, Dieckmann, Gradinger, Melnikov, Spindler and Thomas2001, Kramer et al. Reference Kramer, Swadling, Meiners, Kiko, Scheltz, Nicolaus and Werner2011).
Sympagic microzooplankton are important because they can accumulate in the sea ice to high concentrations. They can live in the ice at concentrations several orders of magnitude higher than in the water (Garrison Reference Garrison1991, Garrison & Close Reference Garrison and Close1993). They graze on bacteria and algae, and are a food source for heterotrophic consumers (Caron & Gast Reference Caron and Gast2010). The sea ice also represents a nursery ground for larvae of key species, such as Antarctic krill Euphausia superba Dana and many other metazoans.
The aim of this study was to expand our knowledge of Antarctic sympagic microzooplankton diversity, abundance and biomass within sea ice and the adjacent water layer in late winter in the northern Weddell Sea.
Materials and methods
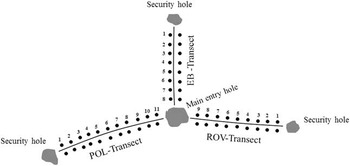
Sampling was carried out during expedition ANT29-7 (14 August–13 October 2013) with RV Polarstern, as part of the WISKY (Winter Sea Ice Study on Key species) project. Ice cores were obtained using a Kovacs Mark II ice corer (0.09 m internal diameter), powered by an electric drill. Sampling was performed on three dive transects (EB, POL, ROV) (Fig. 1) on an ice floe at 60°47.76'S and 26°19.73'W.
Sampling transects from which the ice cores were obtained. The dots represent the sampling on each transect. The distance between samples was 2 m.

Three replicate ice cores were taken every 2 m along the three transects (Fig. 1). One core was used for salinity and temperature measurements, and the other two cores were used for analysis of microzooplankton composition, chl a, and particulate organic carbon (POC) and nitrogen (PON) concentrations. Core temperature was measured immediately after extraction by drilling 5 mm holes into the ice core every 10 cm along the core in to which a Pt 100 digital thermometer was placed. The temperatures recorded along the core were not significantly different, so the data were pooled. The core was then cut into two sections (as outlined below) and melted separately for analysis of salinity with a YSI Model 30 conductivity meter. There were no differences in salinity between the two sections of the cores, so again the data were pooled.
The two remaining ice cores for determining microzooplankton composition, chl a, POC and PON were also cut into two sections for comparison and the replicates were pooled. The ‘lower ice core section’ consisted of the bottom 10 cm of the ice core and the ‘upper ice core section’ included the rest of the ice core. The sections were sealed in separate plastic tubes and were melted in a temperature constant room at -4°C in the dark by adding 200 ml of 0.2 μm filtered seawater per cm ice core length to avoid osmotic stress (Garrison & Buck Reference Garrison and Buck1986). After 24–36 h, when the sea ice was melted, the volume was determined and 3–5 l were concentrated using a 10 μm mesh. Once reduced to 250 ml, the samples were immediately fixed with buffered formaldehyde (final concentration 4%). The remaining melted sea ice was used for chl a measurements and elemental analysis of POC and PON. For chl a analysis, 0.1–0.2 l were filtered onto 25 mm diameter GF/F filters at pressures not exceeding 200 mbar. Filters were immediately transferred to centrifuge tubes with 6 ml 90% acetone and 1 cm3 of glass beads. The tubes were sealed and stored at -20°C for at least 30 min and up to 24 h. The chl a was extracted by placing the centrifuge tubes in a grinder for 20 sec followed by centrifugation at 0°C. The supernatant was poured into quartz tubes and measured for chl content in a Turner 10-AU fluorometer. Calibration of the fluorometer was carried out at the beginning and at the end of the cruise. The chl a content estimated using the different calibration curves differed by <0.5%. Values presented here were calculated using average parameter values from the two calibrations and the equation given in Knap et al. (Reference Knap, Michaels, Close, Ducklow and Dickson1996).
For POC and PON analysis, 0.1–0.2 l were filtered onto precombusted 25 mm Whatman GF/F filters. Filters were immediately transferred to precombusted glass petri dishes and dried overnight at 50°C. Dried filters were stored at -20°C until analysis. Before analysis, filters were treated with a few drops of 1 N HCl and dried overnight at 50°C to remove inorganic carbon. Filters were analysed using a EuraEA elemental analyser (EuroVector). An acetanilide standard series was measured at the beginning and end of each measurement cycle. The POC concentrations in samples were estimated from the standard series after blank correction from measurements on a blank filter taken during the cruise (processed as samples by filtering water from the ship’s Milli-Q system). Total nitrogen and carbon content in blank filters was 3±2 µg and 11±6 µg, respectively.
Water samples were collected through the dive entry hole (Fig. 1) with a peristaltic pump. A tube was located under the ice, at 1 m depth the pump was switched on. Water samples of 5–10 l were collected, concentrated and fixed, as described above.
Subsamples (50–100 ml) of melted ice and seawater were examined in a settling chamber using an inverted microscope (Leica DMI 3000B) equipped with phase-contrast and bright-field illumination (magnification 200x), according to Utermöhl (Reference Utermöhl1958). The entire surface of the chamber was examined. In total, 52 ice core samples were analysed (26 lower sections and 26 upper sections), along with six seawater samples.
Among the microzooplankton community, four main groups were considered: ciliates (naked, tintinnids), heterotrophic dinoflagellates, micrometazoans and other protozoans (e.g. Foraminifera, Radiolaria and Heliozoa). The identification of these groups was based on the descriptions from Alder (Reference Alder1999), Petz (Reference Petz2005) and Petz et al. (Reference Petz, Song and Wilbert1995) for the ciliate, Balech (Reference Balech1976) and McMinn & Scott (Reference McMinn and Scott2005) for the heterotrophic dinoflagellates, Larink & Westheide (Reference Larink and Westheide2006) for the micrometazoans, Kemle-von Mücke & Hemleben (Reference Kemle-von Mücke and Hemleben1999) for the Foraminifera, Kling & Boltovskoy (Reference Kling and Boltovskoy1999) for the Radiolaria Phaeodaria, and Mikrjukov et al. (Reference Mikrjukov, Siemensma and Patterson2000) for the Heliozoa.
Although identification of aloricate ciliates is uncertain without silver staining procedures, in our samples the ciliates were very well preserved and their large dimensions allowed their identification at the genus level, and sometimes even at the species level. Empty loricae were not differentiated from filled loricae because the tintinnid protoplasts are attached to the loricae by fragile strands that can easily detach during collection and fixing of the samples.
The phototrophic ciliate Mesodinium rubrum is an obligate autotroph (Lindholm Reference Lindholm1985), but it was considered in this study, as it was only a minor part of the ciliate biomass. Dinoflagellates were considered heterotrophic on the basis of previous studies (Lessard Reference Lessard1991). Only gyrodinoide species could not be identified to species level, and the contribution of autotrophy or mixotrophy could not be evaluated by this method, although their contribution to the total biomass was <1%.
For each taxon, the biomass was estimated by measuring the linear dimensions of each organism using an eyepiece scale and relating the individual shapes to standard geometric figures. Cell volumes were converted to carbon values using the appropriate formulae and conversion factors: tintinnids pg C cell-1=µm3×0.053+444.5 (Verity & Langdon Reference Verity and Langdon1984), naked ciliates pg C cell-1=µm3×0.14 (Putt & Stoecker Reference Putt and Stoecker1989), dinoflagellates pg C cell-1=µm3×0.11 (Edler Reference Edler1979), micrometazoans pg C cell-1=µm3×0.08 (Beers & Stewart Reference Beers and Stewart1970), and other protozoans pg C cell-1=µm3×0.089 (Gifford & Caron Reference Gifford and Caron2000). To elucidate the relationships between the main taxa in the ice with environmental parameters (temperature, salinity, chl a, POC, PON) a canonical correspondence analysis (CCA) (Legendre & Legendre Reference Legendre and Legendre1998) was performed using PAST v3.14 (Øyvind Hammer, Oslo). Significance of axis was tested by permutation analyses (permutation number 999).
To test the variability of the main microzooplankton taxa present in the upper and lower ice core sections, a cluster analysis was carried out (Warwick & Clarke Reference Warwick and Clarke2001). Multivariate analyses were based on Bray–Curtis similarities or dissimilarities (Bray & Curtis Reference Bray and Curtis1957), as calculated from the square root transformed abundance and biomass data. The analyses were conducted using PRIMER v7 (PRIMER-E, Plymouth). The significance level for all statistical tests was set at 5%. Data are presented as mean±standard deviation.
Results
Lower ice core sections (bottom 10 cm)
The microzooplankton abundance ranged from 128 (EB1) to 1300 ind. l-1 (POL7). The aloricate ciliates were the most abundant group, these ranged from 38 (ROV2) to 1017 ind. l-1 (POL11). The micrometazoans represented mainly the nauplia of copepods with a maximum of 282 ind. l-1 (POL10). Foraminifers were present in all samples and reached a maximum abundance of 461 ind. l-1 (POL1). The heterotrophic dinoflagellates were almost absent, while tintinnids showed a maximum of 542 ind. l-1 (ROV1), although they were generally found at lower abundances.
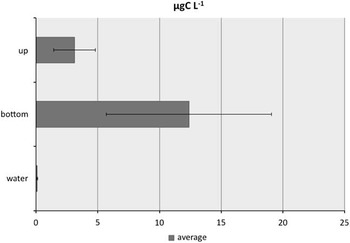
The microzooplankton biomasses ranged from 2.17 (EB1) to 28.2 µg C l-1 (POL10). The higher biomasses were due to the large size of the aloricate ciliates, such as the genera Gymnozoum, Litonotus, Placus and Frontonia, and the large foraminifer Neogloboquadrina pachyderma (Ehrenberg). The naupliar stages of copepods also contributed to the total amount of carbon in the ice. The average microzooplankton abundance and biomass reached 568±325 ind. l-1 and 12.4±6.7 µg C l-1 (Fig. 2), respectively.
Mean (± standard deviation) biomass of microzooplankton (µg C l-1) in the upper ice core sections (up), lower ice core sections (bottom) and in the seawater under the ice (water).

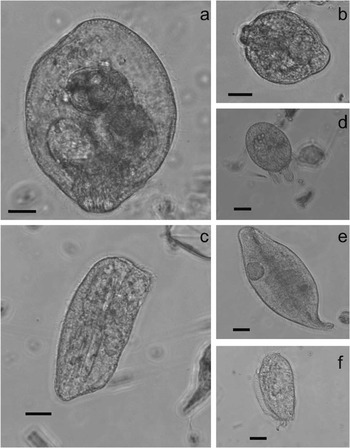
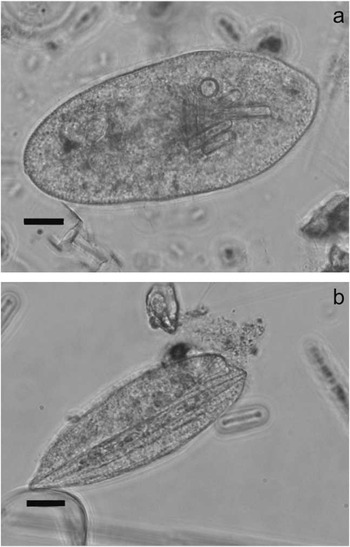
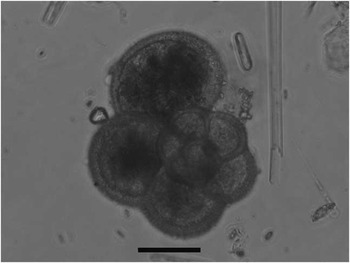
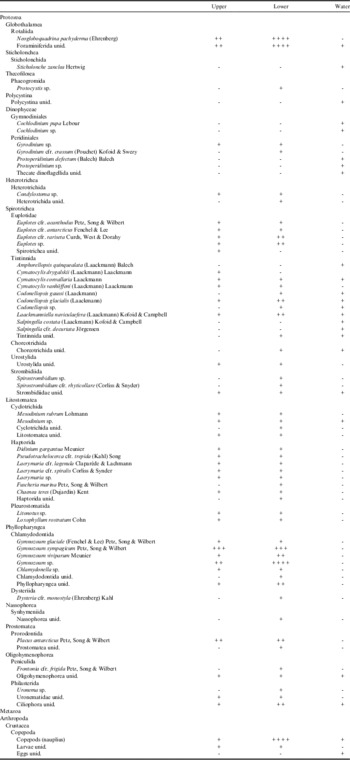
The analysis of the composition of the microzooplankton community in the lower ice core samples identified 56 taxa (Table I). Among the ciliates, the aloricate genus Gymnozoum was found in all of the samples, with Gymnozoum viviparum (Fig. 3a), G. sympagicum (Fig. 3b) and, at lower abundances, G. glaciale. Placus antarcticus (Fig. 3c) and Didinium gargantua (Fig. 3d), and the genera Litonotus (Fig. 3e) and Euplotes (Fig. 3f) were also found frequently. Diatoms, generally pennate diatoms, were observed inside many ciliates (Fig. 4a & b). Tintinnids were assigned to only three genera (i.e. Cymatocylis, Codonellopsis, Laackmanniella) and six species (Table I). The most abundant tintinnid species were Codonellopsis glacialis and Laackmanniella naviculaefera. Most of the tintinnids were empty, but for Laackmanniella the presence of material attached to the lorica hindered the view of the inner cell. Foraminifers were present in almost all of the samples, mainly as N. pachyderma (Fig. 5). Heterotrophic dinoflagellates were very rare, with only the genus Gyrodinium identified (Table I).
Gymnozoum viviparum, b. G. sympagicum, c. Placus antarcticus, d. Didinium gargantua, e. Litonotus sp., f. Euplotes sp. Scale bars=20 µm.

Pennate diatoms inside a. Placus antarcticus and b. Fuscheria marina. Scale bars=20 µm.

Neogloboquadrina pachyderma. Scale bar=40 µm.

Taxa observed during the sampling period, including the mean abundance of each taxa in the ice (upper and lower ice core sections) and in the seawater under the ice. Abundances (ind. l-1): -=0,+= 0.1–10, ++=11–30, +++=31–50, ++++=51–80.

Upper ice core sections
Microzooplankton were less abundant in the upper ice core sections compared with the lower ice core sections. In the upper ice core sections, abundance ranged from 30 (EB4) to 577 ind. l-1 (EB8). Microzooplankton abundance was only higher in the upper ice core sections in two samples (EB8, ROV3). Aloricate ciliates were the most abundant group ranging from 21 (EB4) to 568 ind. l-1 (EB8). Micrometazoans were dominated by nauplia with a maximum abundance of 43 ind. l-1 (POL2). There were very low numbers of heterotrophic dinoflagellates and tintinnids in the upper ice core sections, with a maximum abundance of 11 and 25 ind. l-1, respectively. The levels of foraminifers were generally <70 ind. l-1, with exception for EB5 and POL4 where the abundance reached 238 ind. l-1 and 135 ind. l-1, respectively.
Microzooplankton biomass in the upper ice core sections ranged from 0.37 (EMB4) to 7.14 µg C l-1 (POL9). On average, the microzooplankton abundance and biomass were lower in the upper ice core sections, only reaching 199±109 ind. l-1 and 3.1±1.7 µg C l-1 (Fig. 2), respectively.
For the upper sections of the ice cores, 40 taxa were recorded (Table I). Aloricate ciliates were the most abundant group, with 12 genera, although this remained less than for the lower ice core sections. Spirostrombidium, Fuscheria, Dysteria, Frontonia and Uronema were not found in the upper ice core sections. However, the general microzooplankton species composition was very similar between the upper and the lower ice core sections.
Seawater under the ice
In the samples of seawater from under the ice, the microzooplankton abundance was low at 8–19 ind. l-1 according to the low chl a values of 0.08–0.9 μg l-1. The microzooplankton mostly consisted of micrometazoans and tintinnids. Among the tintinnids, five genera were recorded: Amphorellopsis, Cymatocylis, Codonellopsis, Laackmanniella and Salpingella (Table I). The abundances of aloricate ciliates (Strombididae and Mesodinium sp.) and thecate dinoflagellates (Protoperidinium and Cochlodinium) were also low (<2 l-1; Table I). In accordance with the low microzooplankton abundance, the biomass was <0.15 µg C l-1 in all samples (Fig. 2) and the largest proportion came from large tintinnids, such as L. naviculaefera, and the naupliar stages of copepods.
Statistical analyses
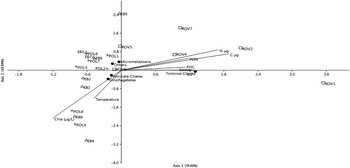
The CCA scatter plot (Fig. 6) shows that axis 1, explaining 70% of variance (P<0.05), is characterized by a decreasing trend of temperature and an increasing trend of salinity, POC and PON. Axis 2 explains only 22% of variance (P<0.05) and is associated with chl a concentration. Tintinnids appear to be positively correlated with salinity, POC and PON. The samples of the ROV transect occupy the right part of the scatter plot, with the exception of ROV6 due to a higher abundance of aloricate ciliates. The samples from the other two transects appear on the left of the scatter plot and only some of them appear to be positively correlated with chl a concentration (EB8, POL9, POL8, EB4).
Canonical correspondence analysis of environmental data and microzooplankton groups (aloricate ciliates, heterotrophic dinoflagellates, tintinnid ciliates, micrometazoans, others). Environmental variables are plotted as correlations with site scores, scaling was used to emphasize the relationships between species.

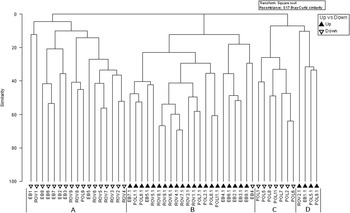
The microzooplankton in all three of these transects (Fig. 1; EB, POL, ROV) were not restricted to the lower sections of the ice core. To define the community diversity, cluster analyses were applied to all of the identified species. Four main groups were identified (Fig. 7): groups A and C constituted the lower ice core samples, and groups B and D the upper ice core samples. There was only one exception, a lower ice core sample (EB4) was included in group B, the largest group of upper ice core samples, because it showed less abundance than all of the other lower ice core samples and totally lacked copepod nauplia. The lower ice core samples showed greater microzooplankton abundances, particularly for group C, which was formed by the samples from the POL transect. Groups B and D were divided on the basis of the presence/absence of some of the aloricate ciliates (e.g. Gymnozoum, Placus).
Cluster analyses of all the upper ice core (black triangles) and lower ice core (open triangles) sections.

Discussion
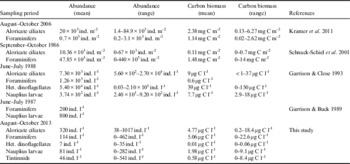
The findings of the present study are in general agreement with previous studies in the same region (Table II), with a dominance of aloricate ciliates and foraminifers in the sea ice communities (Garrison & Buck Reference Garrison and Buck1989, Garrison & Close Reference Garrison and Close1993, Schnack-Schiel et al. Reference Schnack-Schiel, Dieckmann, Gradinger, Melnikov, Spindler and Thomas2001, Kramer et al. Reference Kramer, Swadling, Meiners, Kiko, Scheltz, Nicolaus and Werner2011). In the late winter in the perennially ice-covered western Weddell Sea, ciliates were shown to dominate the protozoan communities in terms of abundance and biomass (median abundance 20×103 ind. m-2, median biomass 2.38 mg C m-2), followed by foraminifers (Kramer et al. Reference Kramer, Swadling, Meiners, Kiko, Scheltz, Nicolaus and Werner2011). Schnack-Schiel et al. (Reference Schnack-Schiel, Dieckmann, Gradinger, Melnikov, Spindler and Thomas2001) reported that in the late winter ice of the Weddell Sea, foraminifers dominated the sea ice communities in terms of abundance (48%), while ciliates reached only 9% representation of the sea ice meiofauna. The foraminifer mean abundance was 47.85×10³ ind. m-2 and mean biomass was 1.48 mg C m-2, while the ciliate mean abundance was 10.36×10³ ind. m-2, with a mean biomass of 0.11 mg C m-2 (Schnack-Schiel et al. Reference Schnack-Schiel, Dieckmann, Gradinger, Melnikov, Spindler and Thomas2001). Garrison & Close (Reference Garrison and Close1993) analysed pack ice floes collected in the same area during a winter cruise and reported that heterotrophic dinoflagellates, entirely comprised of athecate forms, dominated the protozoan biomass (39 µg C l-1), while ciliates averaged 7.30×10³ ind. l-1, with an average biomass of 9 µg C l-1. In another study, Garrison & Buck (Reference Garrison and Buck1989) reported that the maximum abundance of foraminifers, collected from drifting pack ice near the Antarctic Peninsula, was 200 ind. l-1, which is lower than seen in the present study. To explain the paucity of foraminifers, the authors considered the particularly patchy distribution of these organisms.
Comparison of abundance (ind. l-1) and carbon biomass (µg C l-1) of aloricate ciliates, foraminifers, heterotrophic dinoflagellates and nauplius larvae.
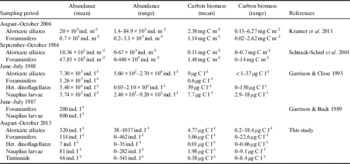
In the samples analysed in the present study, nauplia were well represented (max. 282 ind. l-1, 9 µg C l-1), although this was lower than that reported by Garrison & Close (Reference Garrison and Close1993), who reported maximum nauplia abundance of 3.2×10³ ind. l-1 and a biomass of 18 µg C l-1, and by Garrison & Buck (Reference Garrison and Buck1989), who reported 800 ind. l-1. We did not classify the nauplia, but in previous studies in the same area, the majority of the nauplia in the sea ice belonged to pelagic calanoid copepods (Schnack-Schiel et al. Reference Schnack-Schiel, Thomas, Dahms, Haas and Mizdalski1998).
The majority of the ciliates identified in our samples are considered to be benthic species, typical in ice environments (Petz et al. Reference Petz, Song and Wilbert1995), and generally not found in the planktonic community (Garzio & Steinberg Reference Garzio and Steinberg2013, Monti et al. Reference Monti, Zoccarato and Umani2016). The ice is a favourable environment for these ciliates, it provides shelter from predators and plenty of food to grow, supported by the large size of these organisms, which can transfer a remarkable amount of carbon to the upper trophic levels. In some cases (e.g. P. antarcticus) they were filled with pennate diatoms, demonstrating that these ciliates were feeding on diatoms inside the ice channels. The initial incorporation of these ciliates into the ice remains unclear since such incorporation should require their presence in the water column during sea ice formation, as is known for diatoms and dinoflagellates. The ciliate ice taxa are rarely encountered in the water because presumably the prey abundances are not sufficiently dense or the pelagic habitat not favourable to the development of significant robust ciliates populations. In the water, benthic ciliates can live in low numbers attached to particles but they are probably too rare to appear in routine surveys of water samples. In contrast, these organisms find particularly favourable conditions inside the pack ice that enhances their abundance at the expense of truly planktonic organisms. The fate of the ciliates after the ice melt is still not clear. Most probably, they will sink to the sea floor, either directly or mediated via faecal pellets. On the other hand, ciliates may be grazed upon before melting is complete, as krill and other organisms frequently forage under the sea ice in spring (Garrison & Close Reference Garrison and Close1993, Meyer Reference Meyer2012).
In the present study, only a few tintinnid and heterotrophic dinoflagellate specimens were recorded. Tintinnids were recorded occasionally in ice cores from the western Weddell Sea during winter (Kramer et al. Reference Kramer, Swadling, Meiners, Kiko, Scheltz, Nicolaus and Werner2011), and more often in the meltwater assemblages at the ice–snow interface of pack ice (Caron & Gast Reference Caron and Gast2010). Most of the heterotrophic dinoflagellates in sea ice include the naked forms (e.g. Gyrodinium, Gymnodinium) (Garrison & Buck Reference Garrison and Buck1989), while thecate dinoflagellates can reach high abundances in spring/summer fast sea ice microhabitats (Stoecker et al. Reference Stoecker, Buck and Putt1993). Both tintinnids and thecate dinoflagellates are unusual in compact ice, probably because their movements can be hampered by the presence of lorica and theca. Tintinnids showed a positive correlation with salinity, PON and POC. Therefore, based on these results, we can hypothesize that tintinnid abundances might be linked to the abundance of organic matter (including bacteria).
The only recorded foraminifer species was N. pachyderma, a species that is typically associated with the sea ice and can dominate sea ice communities in terms of their abundance (Schnack-Schiel et al. Reference Schnack-Schiel, Dieckmann, Gradinger, Melnikov, Spindler and Thomas2001). Neogloboquadrina pachyderma grows inside the brine channels and can survive salinities up to 82 (Spindler et al. Reference Spindler, Dickmann and Lange1990). The chamber formation rates are slower at higher salinities and the final size of specimens decrease with increasing salinity. Reproduction of N. pachyderma was never observed at salinities > 50, suggesting that this species does not reproduce within sea ice.
The areal and vertical distribution of organisms within sea ice can be highly variable due to differences in the sea ice conditions. These variable conditions may arise from differences in the type of ice (deep water pack ice vs land fast ice), interannual variability or the heterogeneity of sympagic communities (Garrison & Buck Reference Garrison and Buck1989, Garrison & Close Reference Garrison and Close1993, Schnack-Schiel et al. Reference Schnack-Schiel, Dieckmann, Gradinger, Melnikov, Spindler and Thomas2001). Sympagic organisms generally occupy the layer nearest to the ice–water interface because the temperature and salinity are more similar to that of the underlying water, although they can occupy the whole ice core. Schnack-Schiel et al. (Reference Schnack-Schiel, Dieckmann, Gradinger, Melnikov, Spindler and Thomas2001) suggested that the bulk of the meiofanua is concentrated in the lowest parts of the sea ice, especially in winter and autumn, because the ice is less porous in the upper sections. Garrison & Buck (Reference Garrison and Buck1989) noted that although organisms were found throughout ice floes, the highest concentrations and diversity occurred in a slush-like layer near the snow–ice interface. Our study confirms the findings of Kramer et al. (Reference Kramer, Swadling, Meiners, Kiko, Scheltz, Nicolaus and Werner2011), with sympagic protozoans present all through the ice cores and not restricted to a specific level. It is still unknown which factors control the vertical distribution of sympagic organisms. Kramer et al. (Reference Kramer, Swadling, Meiners, Kiko, Scheltz, Nicolaus and Werner2011) reported that the distribution of sympagic meiofauna in the western Weddell Sea was correlated with vertical pigment profiles, but not with any of the abiotic variables measured (i.e. temperature, salinity, brine volume). The ciliate diversity presumably reflects the physical and chemical complexity of the sea ice microhabitats. Here, despite the similarity in the taxonomic composition of the lower and upper ice core samples, cluster analysis still distinguished between the samples belonging to the two different sections, with only one exception. Thus, the main difference between the lower and upper ice core sections was quantitative in character.
In our study, the majority of samples were not affected by environmental factors such as temperature, salinity, chl a, POC or PON. Only the samples from the ROV transect appeared to be positively correlated with salinity, POC, PON and tintinnid abundance, and inversely correlated with temperature. A few samples from the POL and EB transects were positively correlated with chl a.All the other samples showed no significant relationships with environmental variables and presented a typical patchy distribution reflecting the heterogeneity of the ice environment (Caron & Gast Reference Caron and Gast2010).
In the present study, the microzooplankton community in the water below the sea ice was profoundly different from that in the ice cores. In the water below the ice, microzooplankton abundance never exceeded 20 ind. l-1 and the community was mainly composed of micrometazoans and tintinnids. Our results contrast with previous studies conducted in the same area during summer. The microzooplankton found during two cruises along the western Antarctic Peninsula in summer 2010 and 2011 showed athecate dinoflagellates and aloricate ciliates as the dominant groups in terms of the abundance and biomass in the seawater (Garzio & Steinberg Reference Garzio and Steinberg2013). Tintinnids were also encountered. Furthermore, there was correlation between biomass and latitude, with tintinnids and larger dinoflagellates in particular showing higher biomass with increasing latitude (Garzio & Steinberg Reference Garzio and Steinberg2013). The aloricate ciliates in the water column during summer were mostly from genera Strombidium, Strobilidium and Didinium, while dinoflagellate mainly belonged to the genus Protoperidinium. During a summer cruise in the Weddell Sea, Boltovskoy & Alder (Reference Boltovskoy and Alder1992) reported that dinoflagellates dominated the microzooplankton community both in terms of number and biomass, followed by tintinnids. The differences between our seawater results and the findings from the other studies may reflect the different seasons.
The differences observed between the seawater and sea ice communities in winter highlight that the microzooplankton in the sea ice are unique protozoan assemblages that may not be a major source of the summer microzooplankton population. Organisms within the ice microhabitat may not have to compete for food, even in the winter, as prey, such as diatoms, flagellates and bacteria, are abundant. Since the microzooplankton in the sea ice has the potential to contribute a high carbon biomass it may constitute an important food source for organisms that live under the ice, such as krill.
Conclusions
During the Antarctic winter, the abundance and biomass of microzooplankton in the sea ice are high. Although these organisms occupy the whole ice core, their abundance and biomass were concentrated in the bottom 10 cm of the ice, probably as a consequence of the differing frequencies of brine channels and their dimensions and levels of ramification in the different ice core sections. The sea ice populations strongly differed from ice-free water communities. The sea ice communities were very similar across all of the ice core samples, in both the lower and upper ice cores, and these were mainly formed by benthic ciliates, while tintinnids and heterotrophic dinoflagellates were scarce. The microzooplankton in sea ice do not appear to be a major source of the spring/summer populations. The data from the present study demonstrate that microzooplankton represent an important fraction of the sympagic community in the Antarctic sea ice. The diversity, abundance and biomass of Antarctic sympagic microzooplankton have been underestimated to date. Microzooplankton contribute to the food supply for the upper trophic levels, they have a potential role in the control of microalgal production and biomass, and they may contribute to the POC when they are released into the water in summer. However, the continued reduction of the ice caused by global warming could undermine these particular ice organisms, and thus lead to a reduction or complete loss of the diversity, abundance and biomass of these sympagic protists.
Acknowledgements
This work was supported by the Italian National Programme for Antarctica (PNRA). This project is a contribution to the research program PACES II (topic 1, work package 5) of the Alfred Wegener Institute. We would like to thank Laura Halbach and Hannelore Cantzler for analysing the chl a, POC and PON samples and Klaus Meiners for his advice on processing sea ice samples. Christopher Berrie is acknowledged for language revision. We are grateful to the two anonymous referees for their review comments and suggestions on the manuscript.
Author contributions
MM-B was responsible for the study, contributed to the microzooplankton analyses and wrote the paper. TD was involved in the microzooplankton and statistical analyses. SFU supervised this PhD research project and assisted with writing the paper. BM was responsible for the project, took the samples and contributed to the writing of the paper.