I. INTRODUCTION
Highly magnetostrictive thin films (<5 μm) of Terfenol-D have been successfully produced by sputtering,Reference Quandt, Gerlach and Seemann1 ion beam deposition,Reference Wada, Uchida, Matsumura, Uchida and Kaneko2 and Pulsed Laser Deposition (PLD).Reference Ma, O’Brien and Kovar3 Thicker magnetostrictive films (5–100 μm) would be useful in many devices such as micropumps, microvalves, and microactuators. However, the few methods that have been reported produce particulate thick films with pore space between the active particles that are either unfilledReference Ma, Becker, Keto and Kovar4 or filled with an inactive polymer binder.Reference Grabham, White and Beeby5 Since magnetostriction is severely degraded by oxidation that occurs in open pores spaces,Reference van Dover, Gyorgy, Frankenthal, Hong and Siconolfi6, Reference Wada, Uchida and Uchida7 the use of such particulate films as actuators requires a viable approach for further densifying the films during a post-process annealing. Higher film density has the added advantage of increasing the displacement and/or force capability for thick film actuators since the displacement/force capability increases with Young’s modulus of the films, which is in turn strongly dependent on relative density.Reference MacKenzie8, Reference du Tremolet de Lacheisserie and Peuzin9 In this article, microstructure, crystallization, composition, and magnetic properties are studied before and after annealing of nanoparticulate Terfenol-D films in vacuum or in a reducing atmosphere in attempt to understand the changes that occur during annealing.
II. EXPERIMENTAL PROCEDURES
The process for producing Terfenol-D films by laser ablation of microparticle aerosols (LAMA) has been described in detail elsewhere.Reference Ma, Becker, Keto and Kovar4 Briefly, an aerosol of micron-sized particles was used as the feedstock source for LAMA. Micron-sized particles were prepared by crushing Tb0.3Dy0.7Fe1.92, purchased from Etrema (Ames, IA), using a mortar and pestle in a glovebox containing an Ar (99.999% purity) atmosphere. After sieving, the resulting microparticles were composed of irregularly shaped particles of between 0.2 and 45 μm. These microparticles were aerosolized by a fluidized bed and fed into the ablation chamber with helium gas (99.999% purity). A coaxial flow of helium gas was used around the aerosol to ensure that the microparticle aerosol remained laminar through the ablation cell.
A KrF excimer laser with a 248-nm wave length, operating with a 12-ns pulse width, was used for ablation. The laser fluence at the ablation zone was 2.5 J/cm2, and the repetition rate was 200 Hz. The ablated species coalesced into nanoparticles (NPs) downstream from the ablation region. A virtual impactor was used to remove unablated microparticles, larger nanoparticles, and larger agglomerates. A detailed description of the virtual impactor design is discussed elsewhere.Reference Henneke10
The deposition chamber was held at ∼200 mTorr and was separated from the ablation chamber (∼760 Torr) by a flat plate nozzle with a 250-μm diameter orifice that was positioned 2 mm above the substrate. The pressure differential between the ablation and deposition chambers accelerated the nanoparticles through the nozzle orifice causing them to reach velocities of 600–1000 m/s,Reference Huang, Nichols, O’Brien, Becker, Keto and Kovar11 depending on the nanoparticle size, before impacting onto alumina substrates (AD996; CoorsTek, Golden, CO). The substrates were placed on an X–Y, motor-controlled stage that allowed patterning of thick films from the nanoparticles. For analysis of the nanoparticles, selected samples were prepared by placing carbon-coated, copper transmission electron microscope (TEM) grids on the stage and depositing directly onto the grids. The nozzle-to-substrate distance was raised to ∼6 mm to prepare the TEM samples to avoid rupturing the carbon coating on the grids during deposition. For the nozzle-to-substrate distances of 2–6 mm used here, calculations show that all NPs larger than 1 nm should impact the substrate.Reference De La Mora, Hering, Rao and McMurry12
Prior to production of NPs and films, the ablation chamber was baked at 200 °C for 24 h under vacuum to achieve a pressure of 10−6 Torr. The deposition chamber was baked at 200 °C under vacuum for 48 h prior to deposition, resulting in a pressure that was less than 5 × 10⁻⁹ Torr prior to deposition. Alumina substrates were cleaned with phosphoric acid/water (1:1 ratio) and then rinsed in methanol and ethanol. After the substrates were loaded in the deposition chamber, they were baked under vacuum at 200 °C for 2 h prior to deposition.
For in vacuo annealing studies, the samples were transferred directly from the deposition chamber to the annealing chamber using a magnetic sample manipulator to avoid exposure to the ambient atmosphere. Annealing was performed under vacuum that ranged from 2 to 8 × 10⁻⁸ Torr. Annealing temperatures were varied from 300 to 700 °C, and the hold time at the target temperature was 1 h. Heating rates were manually controlled with an approximate rate of 50 °C/min up to 400 °C and then approximately 25 °C/min for temperatures greater than 400 °C.
For reduction annealing experiments, the films were removed from the vacuum chamber after deposition and annealed in a quartz tube. Flowing ultra high purity (UHP), hydrogen (99.999%) was used as the reducing gas, and annealing temperatures were varied from 250 to 950 °C. The temperature was increased at 5 °C/min to 100 °C, held for 1 h, and then increased to the target temperature at 5 °C/min. The hold time at the specified temperatures was 1 h.
Magnetic measurements were made at 300 K using a superconducting quantum interference device magnetometer. The reported magnetic responses are those from the films, after subtraction of the diamagnetic response from the substrates. The maximum magnetic field that was applied for these measurements was 10,000 Oe, which is sufficient to saturate bulk, polycrystalline Terfenol-D. However, since this was not sufficient to fully saturate the magnetization of the films, the magnetization, M, reported at 10 kOe was used to compare the magnetizations of the films.
Magnetostriction was determined from tip displacements, under a known magnetic field, of cantilever beams onto which the magnetostrictive films were deposited. A diode laser was used as a light source and aimed at the tip of the cantilever while a position-sensitive diode was used to monitor the reflected light from the tip of the cantilever. A magnetic field, up to 2.3 kOe, was applied using a variable, permanent magnet to actuate the cantilever beams. This device was specifically designed to minimize changes in temperature that would have resulted from the use of an electromagnet.Reference O’Brien13 Such temperature changes would have complicated the interpretation of tip deflection since both magnetostriction and changes in temperature result in displacement of the tip of the bilayer cantilever samples.
Compositions and particle size distributions were measured on individual NPs and clusters of NPs using a transmission electron microscope/scanning transmission electron microscope (TEM/STEM) equipped with energy dispersive spectroscopy (EDS). Particle size measurements were made using image analysis from bright-field images on a minimum of 300 particles. STEM imaging was performed using an electron beam that was focused to a 1.0-nm diameter. EDS spectra were taken with a variable beam size that was adjusted to cover only the particle of interest. A 1.5-nm probe was used for nanobeam EDS on particles larger than 40 nm, and a 1-nm probe was used for all other particles.
The morphologies of the films were studied using scanning electron microscopy (SEM). The thicknesses of the deposited films were determined using mechanical profilometry. Portions of the substrate were masked prior to deposition to create a bare region of the substrate. The film thickness was determined from the step height between the films and bare regions of the substrate.
III. RESULTS
The as-deposited films were amorphous with thicknesses that ranged from 4 to 20 μm. SEM EDS measurements showed that the overall composition of the as-deposited films was Fe0.68Tb0.08Dy0.24 indicating that the composition was similar to the feedstock starting material (Fe0.66Tb0.10Dy0.24). SEM images (discussed in detail later) showed significant nanoscale porosity. Magnetic measurements revealed that the maximum magnetization for the as-deposited films was 13.8 emu/g, which was about 50% lower than that measured on thin, dense films produced by PLD.Reference Ma, O’Brien and Kovar3
A. Influence of annealing on magnetic properties of films
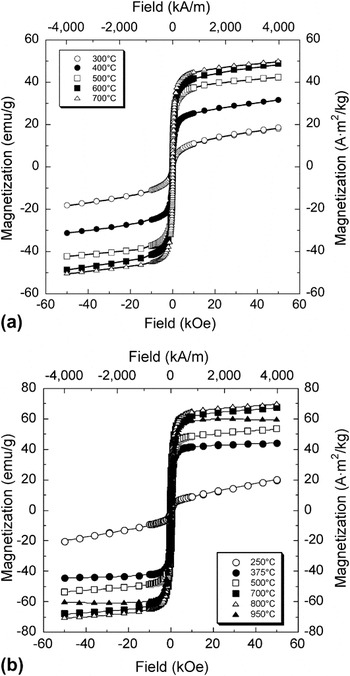
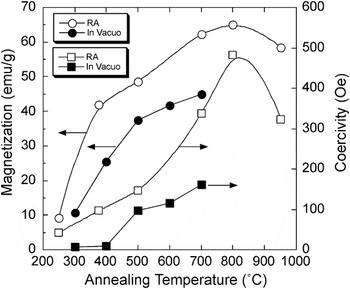
Figure 1 shows the magnetic hysteresis curves for films annealed in vacuo [Fig. 1(a)] and reduction annealed [Fig. 1(b)]. For all of the annealing temperatures studied, the maximum magnetizations of the films increased with annealing temperature. For films annealed in vacuo at temperatures below 500 °C, the magnetization increased sharply from 12 emu/g for an annealing temperature of 300 °C to 37 emu/g for films annealed at 500 °C. For annealing temperatures of 500–700 °C, the rate of increase in magnetization slowed so that for an annealing temperature of 700 °C, the magnetization was 45 emu/g. The magnetizations for the reduction annealed samples [Fig. 1(b)] increased even more sharply at low annealing temperatures than for the in vacuo annealed samples. For example, the magnetizations for the reduction-annealed samples increased from 10 emu/g to more than 40 emu/g when the annealing temperature was increased from 250 to 375 °C. The magnetization continued to increase with annealing temperature, reaching 64 emu/g at 800 °C. The coercivity for reduction-annealed samples reached 480 Oe at 800 °C, nearly three times that of the in vacuo annealed films.
Hysteresis curves for films annealed (a) in vacuo and (b) reduction annealed as a function of annealing temperature.

Figure 2 shows magnetizations and coercitvities for the films that were annealed in vacuo or reduction annealed. The coercivity of the in vacuo annealed films was initially very low and remained below 15 Oe up to an annealing temperature of 400 °C, but then increased sharply. The coercivities of the films continued to increase rapidly for annealing temperatures above 500 °C, reaching 160 Oe at an annealing temperature of 700 °C.
Magnetization and coercivity of films as function of reduction-annealing temperature for reduction-annealed films (RA) and films annealed in vacuo.

Measurements of the magnetostriction for the as-deposited, in vacuo annealed, and reduction-annealed samples revealed that none of the samples exhibited significant deflection under a strong magnetic field. The lack of measurable deflection for the as-deposited and the annealed films is in contrast to films of the same material deposited previously by PLD.Reference Ma, O’Brien and Kovar3 To determine the causes of the small magnetostrictions, the nano- and microscale compositions and morphologies of the films were studied using a variety of techniques that are discussed below.
B. X-ray diffraction
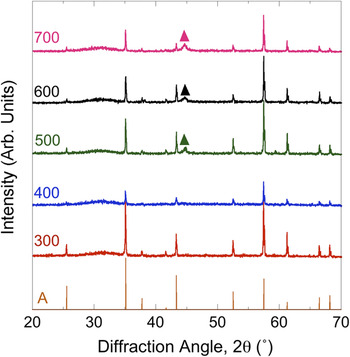
Figure 3 shows XRD patterns for films annealed in vacuo. As-deposited films (not shown) were amorphous with no visible diffraction peaks other than those for the substrate. The diffraction patterns for the annealed samples show no change from the as-deposited condition up to an annealing temperature of 400 °C. For films annealed at 500 °C, a small, broad peak is visible at 2θ = 44.7°, which corresponds to the (110) peak for α-Fe. The broadness of this peak indicates that the crystallite size within these α-Fe precipitates is nanocrystalline. For annealing temperatures from 500 to 700 °C, there is little change in the breadth of the Fe (110) peak, indicating that the crystallite size of the iron is relatively constant up to an annealing temperature of 700 °C.
X-ray diffraction spectra for films annealed in vacuo at temperatures ranging from 300 to 700 °C. Also shown are the known peak intensities for the for the alumina substrate (A = alumina) and for elemental iron (▲ = Fe).

A broad, diffuse peak is also visible at 2θ = 30–35° for all of the annealing temperatures. This peak likely results from rare earth oxides and/or nitrides but cannot be unambiguously indexed because there are several compounds with similar diffraction peaks in this range of diffraction angles. The lack of diffraction peaks corresponding to the Fe2R Laves phase confirms that the films did not crystallize to the highly magnetostrictive Laves phase during in vacuo annealing, even at temperatures as high as 700 °C.
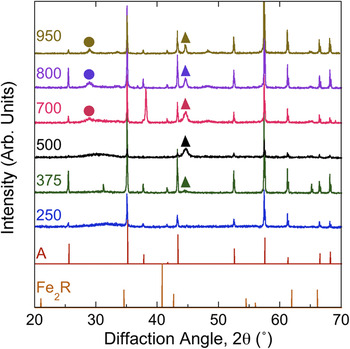
Figure 4 shows XRD patterns for reduction-annealed films. The diffuse, broad peak at 2θ = 30–35° that was apparent in the in vacuo annealed samples is also visible in the reduction-annealed samples, but only for annealing temperatures of 500 °C and below. Previous measurements on films made using LAMA under that same condition showed that there was less than 0.001% oxygen present during ablation.Reference Ma, Becker, Keto and Kovar4 This indicates that the films likely oxidized when they were removed from the deposition chamber, prior to reduction annealing, and then were reduced during reduction annealing at temperatures above 500 °C. Like the in vacuo annealed films, the reduction-annealed films are amorphous until α-Fe nucleated at intermediate temperatures. However, the temperature at which the crystallization of α-Fe begins during reduction annealing is slightly lower (375 °C) compared with that for in vacuo annealed films. For samples annealed at 700 °C and higher, diffraction peaks corresponding to R2O3 (R = Tb or Dy) are also present. Even at annealing temperatures as high as 950 °C, no diffraction peaks corresponding Laves phase R2Fe are observed.
X-ray diffraction spectra for films annealed in a reducing atmosphere at temperatures ranging from 250 to 950 °C. Also shown are the known peak intensities for the Fe–rare earth compound (Fe2R, where R = Tb or Dy) and for the alumina substrate (A = alumina). v = R2O3 and ▲ = Fe.

C. TEM compositional analysis of NPs
To determine why crystallization to the R2Fe Laves phase did not occur during annealing, analyses were conducted on individual nanoparticles and clusters of nanoparticles from which the films were produced. Three distinct size distributions of nanoparticles were observed: small particles (<10 nm), intermediate-sized particles (10–40 nm), and large particles (>40 nm). Only a few particles in the large particle size regime were observed. These particles were too big to have been ablated and thus either resulted from feedstock material that was only partially ablated or were in the shadow of other particles, and therefore they were missed by the laser. A larger fraction of the particles were between 10 and 40 nm and spherical. From previous analysis on LAMA of silver nanoparticles,Reference Nichols, Malyavanatham, Henneke, O’Brien, Becker and Keto14 we postulate that these formed either in very dense regions of the plasma or, more likely, by evaporation prior to breakdown. The largest fraction of particles was spherical NPs with diameters of between 1 and 10 nm. These particles likely formed by coalescence in the low-pressure region behind the shock wave after breakdown.Reference Nichols, Malyavanatham, Henneke, Brock, Becker, Keto and Glicksman15
The range of compositions found in large particles determined by nanoarea TEM/EDS was Tb0.16–0.27Dy0.25–0.44Fe0.31–0.59. Thus, the average composition of these large nanoparticles was slightly rare earth-rich compared with the feedstock starting material that had a composition of Tb0.10Dy0.24Fe0.66. In contrast to the larger particles, the range of compositions observed from intermediate-sized particles was closer to bulk Terfenol-D and in the range from Tb0.09–0.14Dy0.25–0.32Fe0.53–0.66. Nanoarea EDS of 3 or 4 of the smallest particles showed that they had a composition of Tb0.09–0.12Dy0.22–0.31Fe0.56–0.69, which was similar to that for the intermediate-sized particles and also close to that for the bulk feedstock from which the NPs were produced.
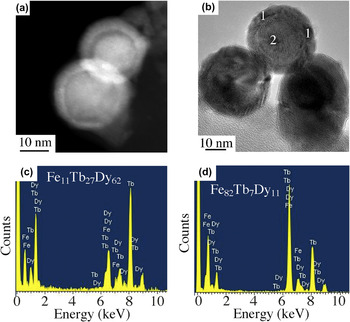
The large- and intermediate-sized NPs exhibited differences in contrast between the core and the shell when viewed under bright-field TEM or STEM imaging conditions, which suggests that these variations were likely due to compositional variations within the nanoparticle. To further probe the differences in composition, nanobeam EDS experiments were conducted across selected regions of the same nanoparticle. Representative bright-field and STEM images are shown in Fig. 5 along with EDS spectra taken from different regions of this nanoparticle. Nanobeam spectra show that the composition of the shell is Tb0.27Dy0.62Fe0.11, whereas the core has a composition of Tb0.07Dy0.11Fe0.82. This suggests that the outer portions of nanoparticles are rare earth-rich and that the inner portions are significantly rare earth-deficient. Similar nanobeam EDS spectra for the intermediate-sized NPs showed that the outer regions of these particles were also rare earth-rich and that the inner regions were very rare earth-deficient. The variations in the compositions of the smaller NPs could not be determined using this technique because the minimum spot size was too large.
(a) Scanning transmission electron microscope (STEM) image of and (b) bright-field TEM image of NPs, and corresponding nanobeam EDS spectra taken (c) in the shell at points 1 and from (d) the core taken at point 2.

D. XPS analysis on films
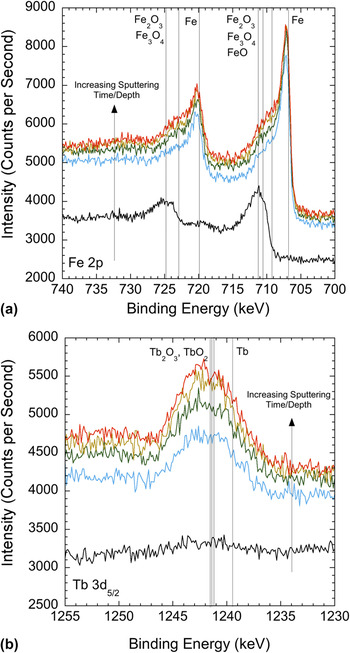
Figure 6 shows the XPS spectra in the vicinity of the 2p1/2 and 2p3/2 regions for iron and terbium for different sputtering times/depths into the as-deposited film. Also shown in this plot are vertical lines that correspond to the known spectral lines for the Fe, Fe2O, Fe3O4, Fe2O3, Tb, Tb2O3, and TbO2. The initial scan shows that there is iron oxide near the surface but with increasing sputtering time/depth into the film, there is a shift in the spectra indicating that the oxidation state of the iron is decreasing. Terbium oxide is not present in the initial near-surface scan. However, peaks corresponding to terbium oxide appear throughout the rest of the depths surveyed. Unlike the iron spectrum, the spectrum for terbium does not shift toward elemental terbium with increasing depth, indicating that the terbium is oxidized throughout the film.
Region for terbium showing spectra as a function of sputtering depth. XPS spectra for (a) 2p1/2 and 2p3/2 regions for iron and (b) 5d5/2 region for terbium showing spectra as a function of sputtering depth. Vertical lines show known locations of peaks for iron and iron oxidesReference Bhargava, Gouzman, Chun, Ramanarayanan and Bernasek16 and for terbium and terbium oxides.Reference Padalia, Lang, Norris, Watson and Fabian17, Reference Sarma and Rao18

E. Film morphologies
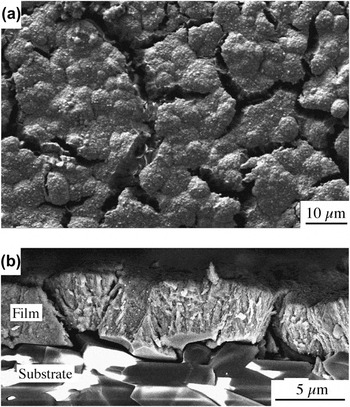
Figure 7 shows plan-view [Fig. 7(a)] and cross-section [Fig. 7(b)] SEM micrographs of the morphology of a film after reduction annealing at 500 °C. From the plan-view micrograph, it is clear that the film was extensively cracked during the annealing process. The cross-sectional micrographs show that the cracks extend to the substrate and result in partial delamination of the film from the substrate. Similar crack patterns were observed in all of the films that were annealed.
(a) Plan-view SEM micrograph of film after reduction annealing showing extensive cracking. (b) Cross-sectional SEM micrograph of film after annealing showing cracking and delamination of the film.

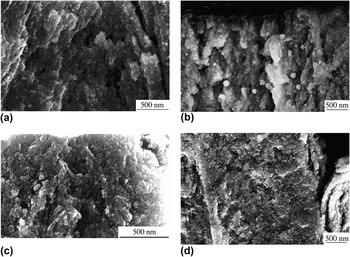
Figure 8 shows a sequence of SEM cross sections of films that were reduction annealed at temperatures ranging from 250 °C [Fig. 8(a)] to 800 °C [Fig. 8(e)] and then were broken to reveal the cross-sectional fracture surfaces of the films. In Fig. 8(a), the nanoparticulate nature of the films is clearly visible. The sizes of the grains within the film are consistent with the sizes of the nanoparticles produced by LAMA (i.e., most of the grains are significantly smaller than 20 nm), and significant porosity is visible. As the annealing temperature is increased to temperatures as high as 800 °C, there do not appear to be any significant changes in the grain sizes or the densities of the films.
SEM cross sections of films after reduction-annealing at temperatures of (a) 250 °C, (b) 375 °C, (c) 500 °C, and (d) 800 °C.

IV. DISCUSSION
A. Densification of films
No detectable densification of the nanoparticulate films was observed in in vacuo annealed samples at temperatures as high as 700 °C or in reduction-annealed samples at temperatures as high as 800 °C. This is surprising because sintering in most materials typically takes place at temperatures of 0.5–0.9 T m (where T m is the absolute melting temperature), and the melting temperature of Tb0.3Dy0.7Fe1.92 is about 1180 °C for micron-sized powders. Reducing the particle size from the micronscale to the nanoscale, as was done here, would be expected to decrease the required sintering temperature due to the increased driving force for densification and enhanced kinetics due to the smaller diffusion distances. For example, we have previously shown that nanoscale silver powders produced by LAMA sinter at temperatures below 0.3 T m.Reference Albert, Becker, Keto and Kovar19
Mei et al. showed using conventional micron-sized TbDyFe powders that densification is possible at temperatures exceeding 1050 °C, particularly for rare earth-rich compositions that contain a liquid phase at the sintering temperature.Reference Mei, Umeda, Zhou and Wang20 However, for compositions that were closer to stoichiometric, like the materials used in this study, the amount of liquid phase was reduced and densification was sluggish. In addition, they found that the presence of oxygen on the powder surfaces significantly inhibited densification. This effect was so strong that reducing the powder size by milling led to a reduced densification rate rather than the expected increase in densification rate because the increased surface area of the finer powders increased the oxygen content in the powders.
B. Crystallization and oxidation
Our TEM/EDS results showed that the composition of LAMA-produced nanoparticles were, on average, similar to that of the starting material.Reference Ma, Becker, Keto and Kovar4 XRD experiments showed that nanocrystalline α-Fe nucleated from the amorphous Terfenol-D films at low annealing temperatures (<375–500 °C) and the fraction of α-Fe proceeded to slowly increase as the annealing temperature was increased. No evidence was found, however, for crystallization of the RFe2 Laves phase, even at high annealing temperatures. The lack of crystallization to the Laves phase does not agree with previous work on “dense” thin films. These previous studies showed that crystallization of Terfenol-D films occurs at annealing temperatures below 600 °C.Reference Ried, Schnell, Schatz, Hirscher, Ludescher, Sigle and Kronmueller21 This suggests that the nanoscale open porosity present in particulate films significantly influences the densification and crystallization behavior of Terfenol-D films.
Films that were reduction-annealed behaved similarly to those that were annealed in vacuo with one exception; crystalline R2O3 (R = Dy or Tb) was observed in samples that were reduction-annealed at temperatures of 700 °C and higher. Given the highly reducing atmosphere, it is unlikely that this R2O3 formed during reduction annealing but instead likely formed by oxidation in ambient of elemental Tb, Dy, or Tb–Dy alloys present in the films after the reduction annealing and prior to the x-ray diffraction experiments that were conducted in air.
Results from the TEM/EDS and XPS experiments clarify the source of the elemental rare earth metals following reduction annealing. These experiments showed that nanoparticles that were exposed to ambient conditions exhibited chemical segregation. The surfaces of the nanoparticles tended to be rare earth-rich and the cores tended to be rare earth-deficient. Van Dover et al. previously showed using auger electron spectroscopy that segregation occurs during oxidation of Tb–Fe films at high temperatures.Reference van Dover, Gyorgy, Frankenthal, Hong and Siconolfi6 In their dense, sputtered thin films, a thin layer of Fe2O3 (2 nm) was observed on the surface of the film followed by a thicker layer of Tb2O3 + iron-rich Tb–Fe (6 nm) before reaching the underlying layer of Tb–Fe. Wada et al. have shown that oxidation occurs in TbFe thin films even under vacuum conditions (5 × 10⁻⁶ Torr).Reference Wada, Uchida and Kaneko22
Our STEM and nanobeam EDS results on 10–30 nm, individual nanoparticles produced by LAMA confirmed that segregation produced a rare earth-rich shell and iron-rich core (see Fig. 5). If a very thin layer of Fe2O3 was present on the surface of the nanoparticles, as would be expected based on van Dover et al.’s results,Reference van Dover, Gyorgy, Frankenthal, Hong and Siconolfi6 it would be difficult to detect in particles of this size using TEM/STEM. However, XPS on as-deposited LAMA films confirmed that the surfaces of the films consisted of iron oxide (Fig. 6). With increasing sputtering depth, the oxidation state of the iron decreased and oxidized Tb was also observed beneath the iron oxide layer.
For the in vacuo annealed films, the oxides present on the surfaces of the nanoparticles likely acted as a diffusion barrier that inhibited interdiffusion and, therefore, the crystallization of the R2Fe Laves phase. The segregation of elemental iron resulted in the preferential nucleation of α-Fe from the iron-rich core of each nanoparticle. The oxide shell present on the nanoparticles also slowed the rate of further oxidation and segregation during annealing and when the films were removed from the vacuum chamber and exposed to ambient conditions. However, because the particles were small and the oxidization was not totally suppressed, prolonged exposure of the Tb0.3Dy0.7Fe1.92 films to ambient conditions resulted in a high degree of oxidation and segregation of the iron to the core and rare earth elements to the shell.
When the films were reduction-annealed, the surface oxide was reduced at annealing temperatures above 375 °C. However, because oxidation and segregation occurred prior to annealing, iron present in the core and rare earth elements or alloys present in the shell crystallized and remained segregated. When the film was removed from the furnace, the rare earth phase oxidized and formed crystalline R2O3. The result after reduction annealing at high temperatures followed by cooling and exposure to air was a mixture of crystalline Fe and R2O3 along with amorphous Fe–Tb in the core.
Our results indicate that successful crystallization of porous Terfenol-D films to the Laves phase requires that oxidation be prevented because once it occurs, the temperature required for crystallization of the segregated species is lower than the temperature required for homogenization of the segregated species by interdiffusion. The observed segregation and oxidation are detrimental to the magnetostriction of Terfenol-D because magnetostriction is much lower for iron-rich compositions compared with RFe2, and the oxides of the rare earths are not magnetostrictive.Reference Clark and Belson23
C. Magnetic properties
The magnetization of the as-deposited films was about 50% lower than that measured for dense films produced by other methods, likely as a result of the high degree of oxidation in these films. The magnetization for the films was found to increase with annealing temperature for both in vacuo and reduction-annealed samples. For films annealed in vacuo, the magnetization initially increased sharply for annealing temperatures below 500 °C and then, for annealing temperatures from 500 to 700 °C, increased more slowly. Corresponding XRD patterns showed that nanocrystalline α-Fe was clearly detectable in films annealed at 500 °C or higher and likely began to form at even lower temperatures, but at sizes or levels that were below the detection limit for XRD.
This suggests that the initial increase in magnetization was likely caused by the crystallization α-Fe. During the initial stages of crystallization, the volume fraction of α-Fe increased rapidly, leading to the dramatic increase in magnetization that was observed with increasing annealing temperature in the in situ annealed LAMA films at lower annealing temperatures. During the latter stages of crystallization, the rate of increase in magnetization decreased as the rate of crystallization slowed and the crystallites within the NPs began to coarsen. Similar observations have been made previously on FeTbDy films.Reference Wada, Uchida and Kaneko22
For the reduction-annealed samples, the magnetization increased much more sharply between 250 and 375 °C than for the in vacuo sintered samples. This temperature range was found to correspond to the onset of the reduction of rare oxides; thus, the reduction of these rare earth oxides was likely responsible for the initial increase in magnetization. At higher temperatures, crystallization of α-Fe occurred as was observed in the in vacuo annealed samples, and likely lead to further increases in magnetization.
Herzer et al. have shown that in ferromagnetic alloys, the coercivity increases with crystallite size when the crystallites are small,Reference Herzer24 reaches a peak, and then decreases for larger micron-sized crystallites. The increase in coercivity that we observed with annealing temperature for both in vacuo and reduction annealing is consistent with the transition from superparamagnetism to ferromagnatism that is expected for small Fe crystallites embedded in the NPs.Reference Cushing, Golub, Henry, Oliva, Cook, Holmes and O’Connor25 Increasing the annealing temperature likely increases the fraction of crystallites that are above the superparamagnetic limit, resulting in an increase in the coercivity.
The lack of measurable magnetostrictive deflection for the as-deposited and annealed films can be explained from observations of the film morphologies (see Figs. 7 and 8). The as-deposited films as well as the annealed films all exhibited significant porosity, and as the annealing temperature was increased, they exhibited severe cracking and delamination. The presence of even small amounts of porosity significantly reduces Young’s modulus,Reference MacKenzie8 which in turn reduces the measured deflection. In addition, the presence of open porosity such as that observed in the films results in oxidation of the films and further reductions in magnetostrictive performance. Cracking of the annealed films caused a further significant reduction in the apparent Young’s modulus of the films, and the delamination effectively removed the constraint between the films and the substrates that is required for actuation of a bilayer.
There were two significant causes of this cracking during annealing: (i) low fracture toughness as a result of significant porosity in the films and (ii) significant thermal expansion mismatch between the film and the substrate and the large temperature change from the annealing temperature to room temperature. The thermal expansion coefficient is 8.3 × 10⁻⁶/°C for alumina,Reference Green26 and for bulk Tb0.3Dy0.7Fe1.92, it is 12 × 10−6/°C.27 This mismatch in thermal expansion coefficient results in a biaxial tensile stress in the films upon cooling from the annealing temperature that explains the fracture morphologies of the films. In principle, cracking could be minimized by (i) densifying the films to increase the fracture toughness, (ii) reducing the annealing temperature to reduce the mismatch strain, or (iii) using a substrate with a closer match to the thermal expansion coefficient of Terfenol-D. Unfortunately, lower annealing temperatures do not lead to densification, leaving the films with a low Young’s modulus and making them susceptible to oxidation that degrades the magnetostriction of the films, so, in practice, this approach is not effective. In addition, the substrate must exhibit low solubility for Fe, Tb, and Dy at the annealing temperature, be nonreactive with respect to the film species, and be chemically stable. This severely limits the choices for suitable substrates with a similar thermal expansion coefficient to Tb0.3Dy0.7Fe1.92.
V. CONCLUSIONS
The LAMA process was used to produce porous, nanoparticulate, thick films of Tb0.3Dy0.7Fe1.92 to study the compositional and microstructural changes that occur during annealing. Significant densification did not occur during in vacuo annealing in ultra high vacuum (UHV) or reduction annealing in H2 to temperatures as high as 800 °C, despite the ultrafine grain size of the films. It was shown that the NPs and the nanoparticulate films exhibited oxidation and segregation that likely impeded densification. A thin iron oxide layer was observed on the NPs that covered a core of an iron-rich FeTb alloy and rare earth oxide. This segregation phenomenon has been observed previously in dense films. Upon annealing, even in a reducing atmosphere, the segregated elements crystallize into α-Fe and Tb, which subsequently oxidized upon exposure to air.
The measured magnetizations of the films increased significantly during low-to-intermediate annealing temperatures due to the crystallization of α-Fe. At annealing temperatures above 500 °C, the rate of increase of magnetization decreased as the crystallization rate slowed. The coercivity, which was less than 15 Oe for the as-deposited films, increased upon nucleation and subsequent coarsening of the α-Fe crystallites present within the NPs to sizes above the superparamagnetic limit.
As-deposited films showed little or no magnetostrictive deflection under a magnetic field as a result of the open porosity in the Terfenol-D thick film. This porosity allowed the Terfenol-D to oxidize and also significantly reduced the stiffness of the films. Thick films of Terfenol-D that were annealed in vacuo or reduction-annealed did not exhibit measurable magnetostrictive displacements because significant densification did not occur at annealing temperatures below 800 °C. In addition, the films cracked and delaminated during annealing due to the low film density and significant thermal expansion mismatch between the films and the substrates. Selection of a substrate with a better thermal expansion match with Terfenol-D might eliminate cracking and allow higher annealing temperatures so that densification could occur. However, selection of a suitable substrate is complicated by the constraints that the substrate must also exhibit low solubility and be nonreactive with the film constituents, which, in practice, is difficult to accomplish simultaneously.
Our results show the complex series of events that occurs during annealing of Terfenol-D nanoparticulate films and highlight the challenges that must be overcome if high-quality magnetostrictive thick films are to be produced. These results suggest that the following conditions must be met to produce highly magnetostrictive particulate films of Terfenol-D: (i) The films must be deposited on substrates that are nonreactive, have limited solubility for Fe, Tb, and Dy at the annealing temperature, are not magnetostrictive, and have a thermal expansion coefficient that is well matched to the film; (ii) the films must be produced and annealed in situ in a reducing atmosphere to prevent oxidation and the concomitant segregation that occurs during oxidation; and (iii) the films must be rapidly heated to a temperature that is sufficient for grain boundary or lattice diffusion to dominate over surface diffusion so that densification can take place before significant coarsening of the NPs occurs.Reference Rahaman28
ACKNOWLEDGMENTS
This work was supported by the National Science Foundation under grant DMI-0304031. The authors thank Dr. Daniel T. O’Brien for assistance with measurements.