1. Introduction
The vehicle's current and future states, such as position and velocity, are the cornerstone for both advanced driver assistance systems (ADAS) and autonomous driving (AD) because they enable the vehicle to understand current and upcoming situations. In order to obtain the state, multiple sensors are mounted on the vehicle, such as global positioning system (GPS), inertial measurement unit (IMU) and light detection and ranging (LiDAR). Unfortunately, these sensors inherently suffer from noise, meaning that the raw sensor data cannot be used directly, in general. The method introduced by Kalman (Reference Kalman1960) is the method most commonly used for addressing such noise. There are two models of Kalman filter (KF): the process model, describing the system's temporal evolution; and the observation model, describing the sensors’ properties. The standard KF is designed for linear systems. When the system is nonlinear, KF is extended by linearising the nonlinear models; this is the so-called extended KF (EKF) (Gelb, Reference Gelb1974). In EKF, the nonlinearities are approximated analytically through first-order Taylor expansion. For decades, EKF has been the dominant state estimator for nonlinear problems. However, it has two flaws: (1) the linearisation may lead to poor performance and divergence when the nonlinearities are considerable, because the higher order terms of Taylor expansion are ignored; (2) the derivation of the Jacobian matrices may be nontrivial in some applications. In contrast with EKF, the unscented KF (UKF) (Julier et al., Reference Julier, Uhlmann and Durrant-Whyte1995) is founded on the intuition that it is easier to approximate a Gaussian distribution than it is to approximate an arbitrary nonlinear function or transformation (Julier and Uhlmann, Reference Julier and Uhlmann1997). In UKF, a minimal set of deterministically sampled sigma points is utilised to capture completely the true mean and covariance of the Gaussian random variables and when propagated through the true nonlinearity, captures the posterior mean and covariance, accurate to the third order (Taylor expansion) for any nonlinearity; in contrast, EKF only achieves first-order accuracy (Wan and Van Der Merwe, Reference Wan and Van Der Merwe2000).
There are ample studies that compare the performance of EKF and UKF. Lefebvre et al. (Reference Lefebvre, Bruyninckx and De Schutter2004) theoretically compared the performance in process and measurement update step of some KFs. In vehicle localisation, the performances of EKF and UKF are compared experimentally and they were found to behave similarly in terms of accuracy and consistency (Ndjeng Ndjeng et al., Reference Ndjeng Ndjeng, Lambert, Gruyer and Glaser2009). In vehicle navigation, the accuracy and computational time of EKF and UKF were evaluated by St-Pierre and Gingras (Reference St-Pierre and Gingras2004); it was found that UKF had just a slight improvement in accuracy whereas it cost much more computational time than EKF. Yang et al. (Reference Yang, Shi and Chen2017) investigated the performance of EKF and UKF with different feedback control models and showed the superiority of UKF. In vehicular state estimation, the performance of EKF and UKF is rarely discussed, because UKF is seen as a better choice and sufficient for most current applications where only several vehicles are involved.
Besides the KF form (EKF or UKF), the process model also affects the performance of a filter. An elaborate process model significantly improves the filter's performance (Julier and Durrant-Whyte, Reference Julier and Durrant-Whyte2003). In road safety related applications, kinematic models prevail (Lefèvre et al., Reference Lefèvre, Vasquez and Laugier2014), such as the constant velocity/acceleration (CV/CA) model and constant turn rate and velocity/acceleration (CTRV/CTRA) model. A comprehensive comparison and evaluation of these models was carried out by Schubert et al. (Reference Schubert, Adam, Obst, Mattern, Leonhardt and Wanielik2011, Reference Schubert, Richter and Wanielik2008); they concluded that the sophisticated model did not demonstrate better performance in any case, and the appropriateness of model heavily depended on the application. In the literature, CTRV and CTRA models are popular choices in various applications (Madhavan et al., Reference Madhavan, Kootbally and Schlenoff2006; Polychronopoulos et al., Reference Polychronopoulos, Tsogas, Amditis and Andreone2007; Lytrivis et al., Reference Lytrivis, Thomaidis, Tsogas and Amditis2011; Houenou et al., Reference Houenou, Bonnifait, Cherfaoui and Yao2013).
The cooperative intelligent transportation system (ITS) has been regarded as the next important step towards the vision of accident-free driving (Weiß, Reference Weiß2011). The applications involved with cooperative ITS and vehicular networking are of real-time nature (Karagiannis et al., Reference Karagiannis, Altintas, Ekici, Heijenk, Jarupan, Lin and Weil2011). For instance, recently Dynamic Map 2⋅0 (DM2⋅0) has been proposed to manage city-scale traffic data to facilitate safe and comfortable driving (Watanabe et al., Reference Watanabe, Sato and Takada2018). In DM2⋅0, massive sensor data are uploaded to the server and that poses a compelling real-time need for the system.
The available studies compared either EKF/UKF or motion models separately, focusing on the one-sided aspect of accuracy. In their conclusions, only an appropriate KF form or motion model was recommended. In practice, the best filter is a tradeoff between accuracy and efficiency. In this paper, the accuracy and efficiency of both EKF and UKF, incorporating CTRV and CTRA models, are evaluated extensively. The analyses can guide the reader to make an appropriate filter considering their specific demands. Moreover, in path prediction, the affecting factors and the models’ properties are also investigated.
The remainder of this paper is structured as follows. Section 2 presents the methodology of this paper. In Section 3, the experimental results are discussed in details. Finally, the conclusions are drawn in Section 4.
2. Methodology for comparative evaluation
2.1 System framework
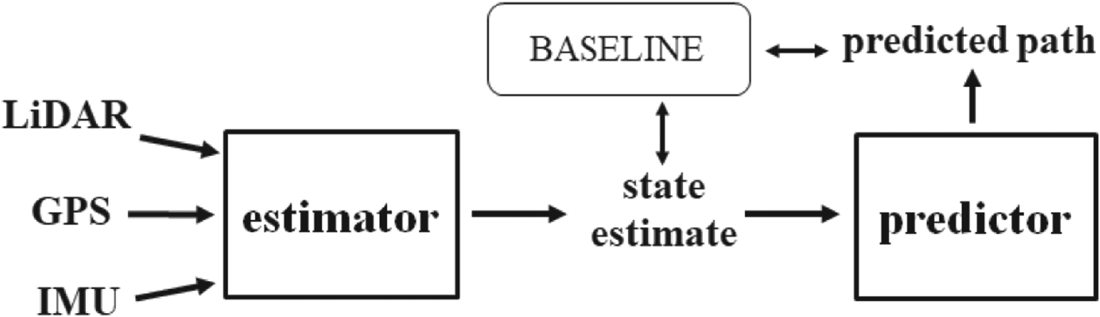
The system framework of this study is illustrated in Figure 1. In this system, LiDAR, GPS and IMU are used. Due to the sensor data inherently containing greater or lesser uncertainties, it is not suggested that the raw sensor measurements should be used directly in application. Especially in path prediction, the uncertainties will be propagated and accumulated. In application, it is necessary initially to employ a state estimator to reduce the uncertainties considering real-time sensor data and vehicular motion model. An accurate vehicular state estimate helps both current and future situation awareness.
Overview of system

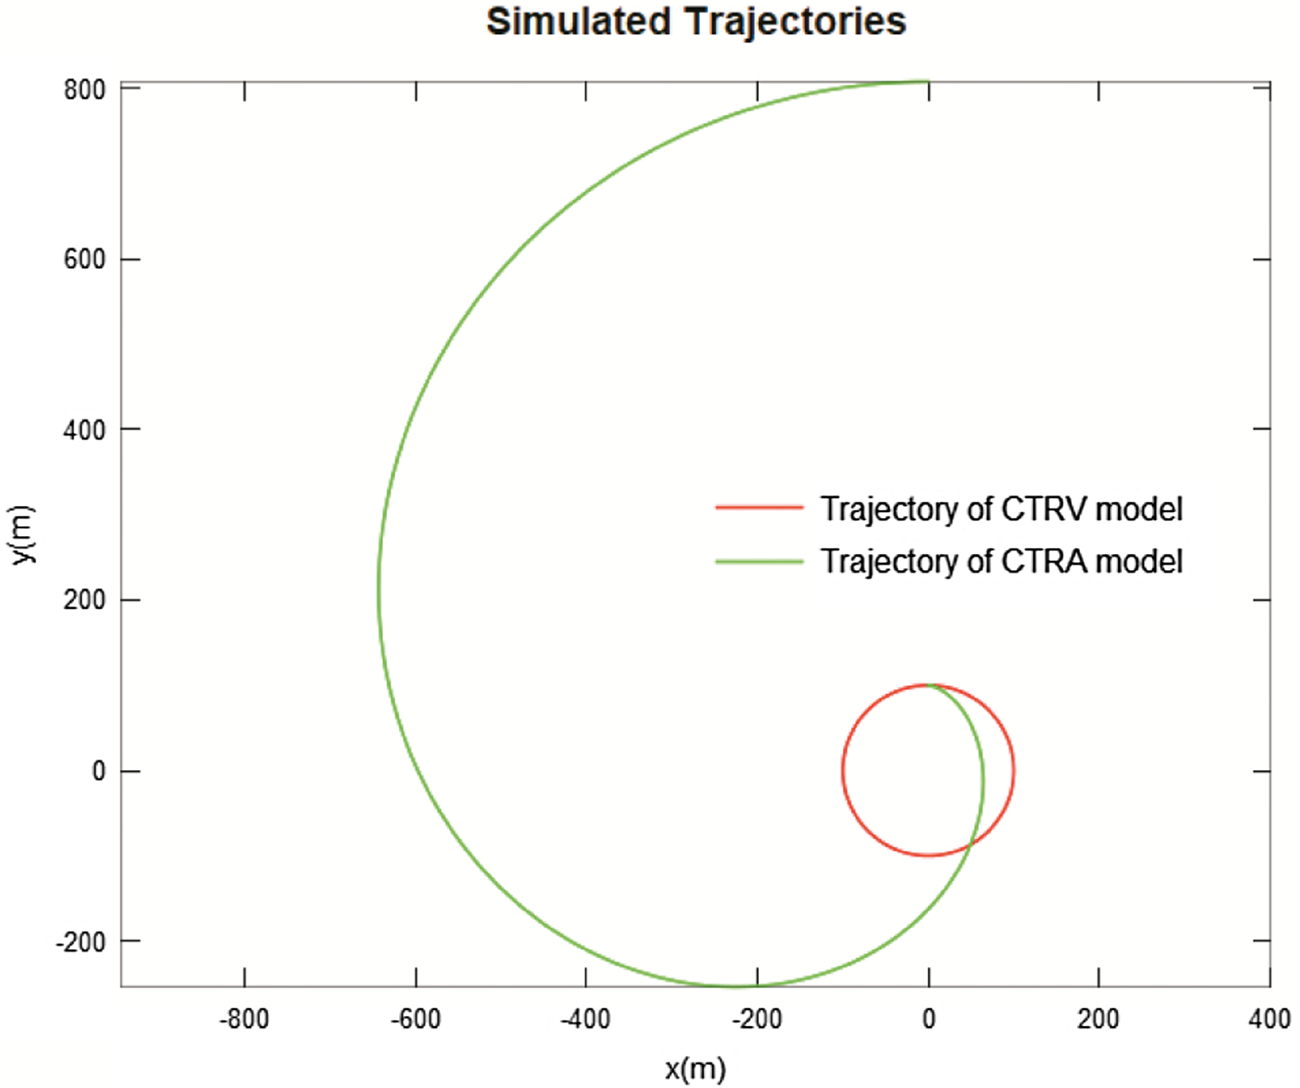
To gain awareness of the upcoming situations, path prediction is usually performed in ADAS and AD applications. In this paper, a future path is defined as a moving trajectory between the current time (instant k) and few seconds later. In each instant (…, k−1, k, k + 1, …), a future path is iteratively predicted by the kinematic model. The obvious advantages of utilising the models to predict path are feasibility and simplicity. Given an initial state, a path can be generated iteratively in real time, as shown in Figure 2. Such predicted path has been used in some vital applications, such as collision warning (Tan and Huang, Reference Tan and Huang2006) and emergency electronic brake lights (Lytrivis et al., Reference Lytrivis, Thomaidis, Tsogas and Amditis2011). The estimated state and predicted path are compared with the baseline to assess their relative difference.
Simulated trajectories of CTRV and CTRA models

2.2 Vehicular motion models
The vehicle movement is governed by physical laws. Therefore the vehicle's motion can be explicitly expressed by mathematical equations. In this paper, vehicular motion models, specifically the CTRV and CTRA models, play the roles of KF's process model and path predictor. Certainly, more sophisticated models do exist, e.g., that of Julier and Durrant-Whyte (Reference Julier and Durrant-Whyte2003). The reasons these two models are chosen are: (1) they are sufficient for most ITS applications; (2) more elaborate models may contain unobservable parameters; (3) they are widely used in intelligent vehicles.
2.2.1 CTRV model
The CTRV model hypothesises that the vehicle is moving at a constant turn rate and velocity, which results in a circular trajectory, as shown in Figure 2 (simulated with initial state [0 m, 100 m, 0 deg, 3⋅14 m/s, −18 deg/s]T and duration 200 s). The state vector of CTRV model at instant k is

where x, y represent the position; θ is the heading; v the velocity; ω the angular rate. Based on the hypothesis, the next instant's state is derived through

Consequently, the CTRV model's state transition equation is

where T is the prediction time interval.
2.2.2 CTRA model
Regarding the velocity derivative as constant, the CTRV model is extended to the CTRA model. The trajectory of this model follows a clothoid, as Figure 2 shows (simulated with initial state [0 m, 100 m, 0 deg, 3⋅14 m/s, 0⋅11 m/s2, −1⋅8 deg/s]T and duration 200 s). At instant k, the CTRA model's state vector is

where a denotes the tangential acceleration. Through Equation (2), the model's state transition equation is derived as follows.

2.3 KFs for vehicular state estimation
2.3.1 State space model
The discrete-time nonlinear dynamic system for vehicular state estimation is formed by


where xk +1 denotes the L-dimensional state of the system at instant k + 1, and yk is the observation. F and H are the process and observation functions. wk and ek are the process and observation noises, which are assumed as independent zero-mean white Gaussian noise of covariance matrices Qk and Rk.
2.3.2 EKF
EKF follows the same prediction-correction mechanism as the standard KF. The main difference is that EKF has to linearise the nonlinear state space models [Equations (6) and (7)] at each iteration through first-order Taylor expansion around the most recent state estimate, employing the Jacobian matrices in Equation (8).

where JF and JH denote the Jacobian matrices of the process and observation functions (for more details see Appendix A). EKF is initialised via

Suppose the system state has been estimated at instant k, the state and covariance at next instant are then predicted through


As long as the new observations are available, the prediction is corrected by


where Gk +1 is Kalman gain. The EKF approximates an optimal estimate through Equations (8)–(14), recursively. The first-order linearisation and the Taylor expansion around the recent estimates (not the true state) lead to additional error. UKF, which is derivative free, is proposed to overcome the limitations.
2.3.3 UKF
Unlike EKF, UKF copes with the nonlinearities by deterministically sampling around the optimal estimate ${\hat{\textbf{x}}_k}$ . Firstly, 2L + 1 sigma points ${{\bf {\cal X}}_{k,i}}$
 (with the weights Wi) are selected through

where ${(\sqrt {(L + \lambda ){\textbf{P}_k}} )_i}$ is the i-th column of the matrix square root. $\lambda ={\alpha ^2}(L + \kappa ) - L$
 is the scaling parameter; $\alpha$
 determines the spread of the sigma points around ${\hat{\textbf{x}}_k}$
 and is usually set to a positive value not more than 1; $\kappa$
 is the second scaling parameter usually set to 0; $\beta$
 is used to incorporate prior knowledge of the distribution of x; for Gaussian distribution, $\beta =2$
 is optimal (Wan and Van Der Merwe, Reference Wan and Van Der Merwe2000). In the prediction step, each sigma point is propagated through

The state and covariance prediction is derived from the weighted mean and covariance of the transformed sigma points


In the correction step, the observations are predicted through


Then the predicted state and covariance are corrected via


where Kalman gain Gk +1 is

where


Both UKF and EKF are based on the standard KF framework; they just differ in addressing the nonlinearities: UKF approximates the state probability distribution, while EKF approximates the nonlinear state space models. Theoretically, UKF outperforms EKF and they have equal computational complexity of O(L 3). However, UKF needs to transform each sigma point through the process and observation functions at each prediction and update process, which may cost more time for high dimensional problems.
3. Experiments on vehicular state estimation and path prediction
3.1 Experimental setup
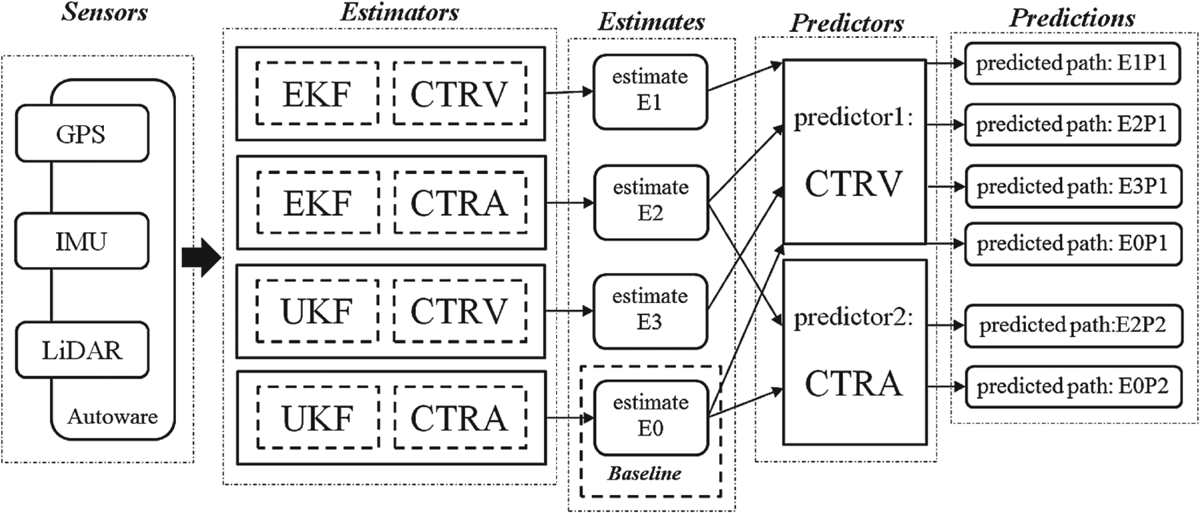
The setup of the experiments is described in Figure 3. The experiments were implemented in C++. GPS, IMU and LiDAR are installed on the Autoware (Kato et al., Reference Kato, Takeuchi, Ishiguro, Ninomiya, Takeda and Hamada2015) platform to provide vehicle state measurements, including position, heading, velocity, acceleration and angular rate. The measurements are fused by the four estimators considering the kinematic models to generate vehicle state estimates. In the experiments, all the combinations of the most popular KF derivatives (EKF and UKF) and motion models (CTRV and CTRA) are investigated. In both theory and practice, UKF outperforms EKF (Wan and Van Der Merwe, Reference Wan and Van Der Merwe2000; Julier, Reference Julier2002; Yang et al., Reference Yang, Shi and Chen2017); and the CTRA model outperforms other kinematic models (Schubert et al., Reference Schubert, Richter and Wanielik2008). Therefore, in this paper, the estimate (E0) of the UKF-CTRA filter is regarded as the baseline with which the other filters’ estimates (E1, E2 and E3) are compared to find out the relative difference.
Experimental setup

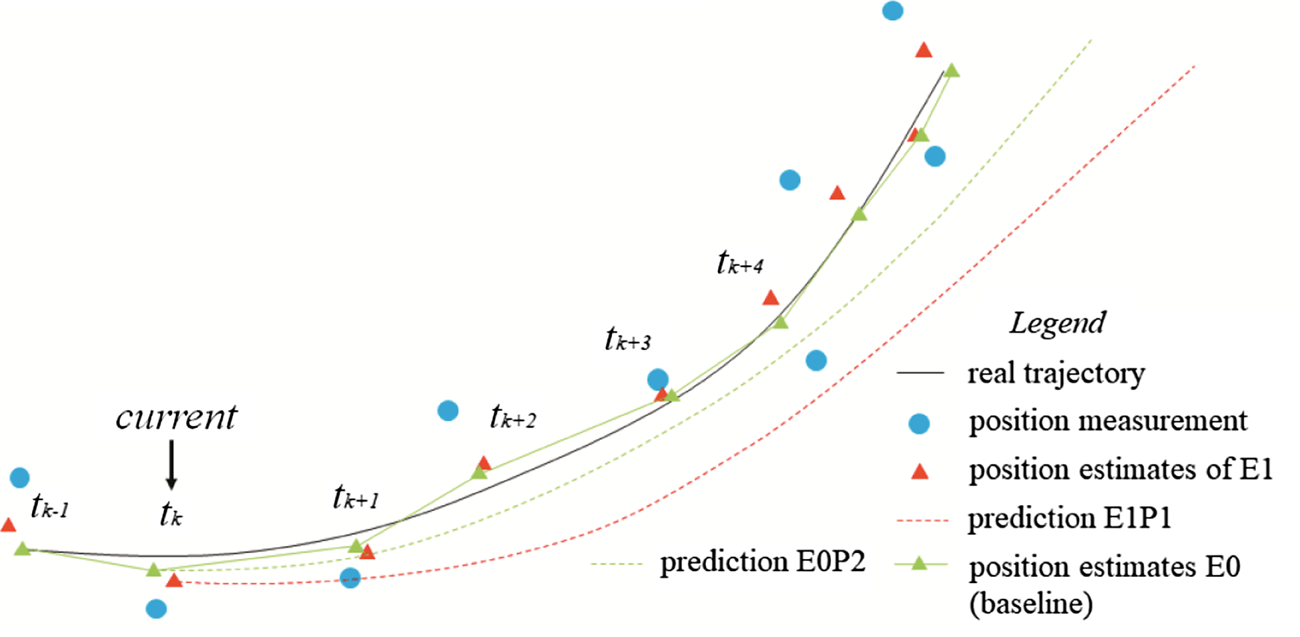
The predictors, CTRV and CTRA, generate 3 s-ahead paths using the estimated states and the paths’ reliabilities are checked through comparison with the baseline. The notation of the path indicates the used state estimate and predictor. For example, E0P2 is generated by predictor2 based on estimate E0. The relationship of measurement, estimate and prediction is illustrated by Figure 4, where, for the sake of brevity, only some of them are drawn. The blue point represents the raw position measurement that inevitably contains noise. The KF is used to reduce the noise. As the figure illustrates, the position estimates (the triangles) are closer to the real trajectory. In practice, the real trajectory cannot be completely known but approximated, since the uncertainties cannot be removed completely. Based on different state estimates, different paths are predicted by the motion models solely and their reliabilities decrease over time. The efficiency of the estimator is also investigated through the mean computational time of each iteration.
Relationship of measurement, estimate and prediction

3.1.1 Sensors of experimental vehicle
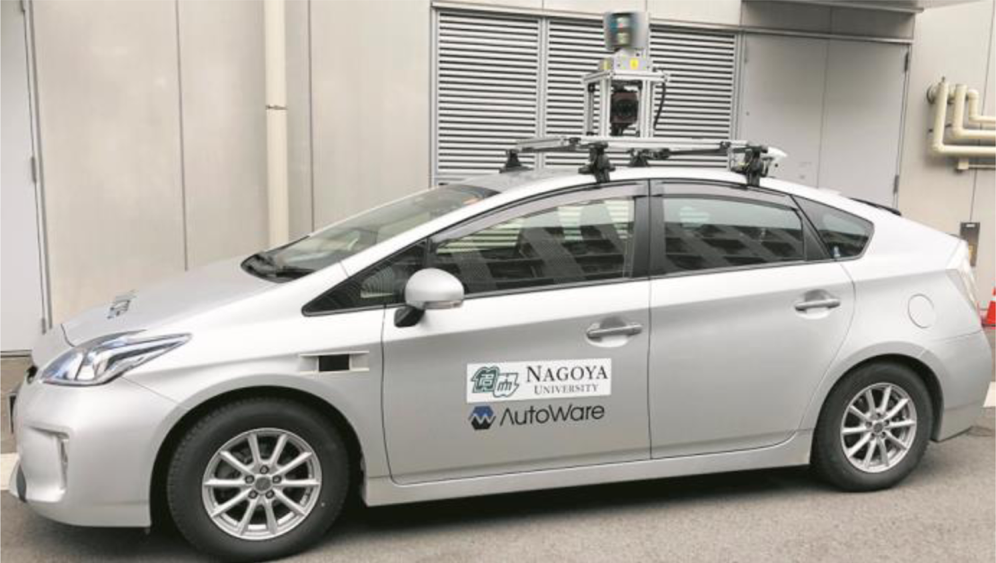
The experiments were carried out via the vehicle shown in Figure 5. Several kinds of sensors are mounted on the vehicle. In the experiments, LiDAR (Velodyne HDL-64ES3), IMU (Xsens MTi-300) and GNSS (global navigation satellite system) receiver (Trimble NetR9) were used. Only fixed GPS data were received in the test fields.
Test vehicle

In these experiments, Autoware just generates raw vehicle state measurements within a unified coordinate system (some sample data, see Appendix B). The LiDAR measurements were generated at 10 Hz, the GPS at 20 Hz (in two drives, GPS worked at 10 Hz) and the IMU 100 Hz. In urban areas, the measurements of LiDAR and IMU were fused by the estimators; on the highway, GPS and IMU were used instead. In KF, the prediction process is performed at 100 Hz and the update process is performed as soon as a new measurement is available. The observation functions are presented in Equation (26), where the bold subscript x and y respectively indicate the system state and observation vector. As the equation expresses, all the states are observed directly, except the velocity and acceleration.

3.1.2 Configurations of EKF and UKF
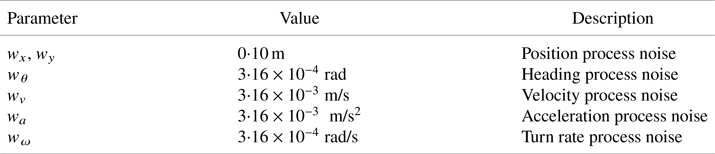
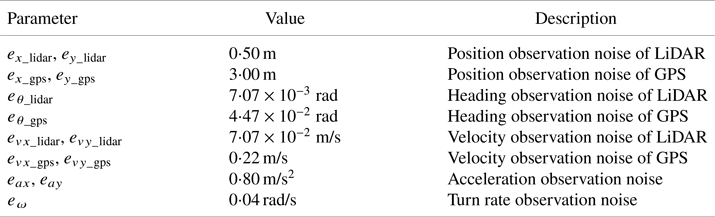
For EKF and UKF, it is necessary to select the appropriate process and observation noise covariance matrix Q and R and to start the algorithm with initial ${\hat{\textbf{x}}_0}$ and P0. In this paper, Q and R are considered to be constant. The setting of these parameters follows the approach proposed by Schneider and Georgakis (Reference Schneider and Georgakis2013), and some of them are tuned empirically. Since Q and R are system and sensor dependent, they should be determined based on the user's system and sensors. The parameters used in the experiments are listed in Tables 1 and 2. In the experiments, CTRV and CTRA use identical process noise parameters. The first aligned observation is assigned to ${\hat{\textbf{x}}_0}$
 and P0 is set by

Standard deviation of process noise

Standard deviation of observation noise

In this paper $\sigma = 10$ . In addition, the parameters $\alpha$
 , $\beta$
 and $\kappa$
 of UKF are set to 0⋅1, 2 and 0, respectively.
3.2 Collected sensor data
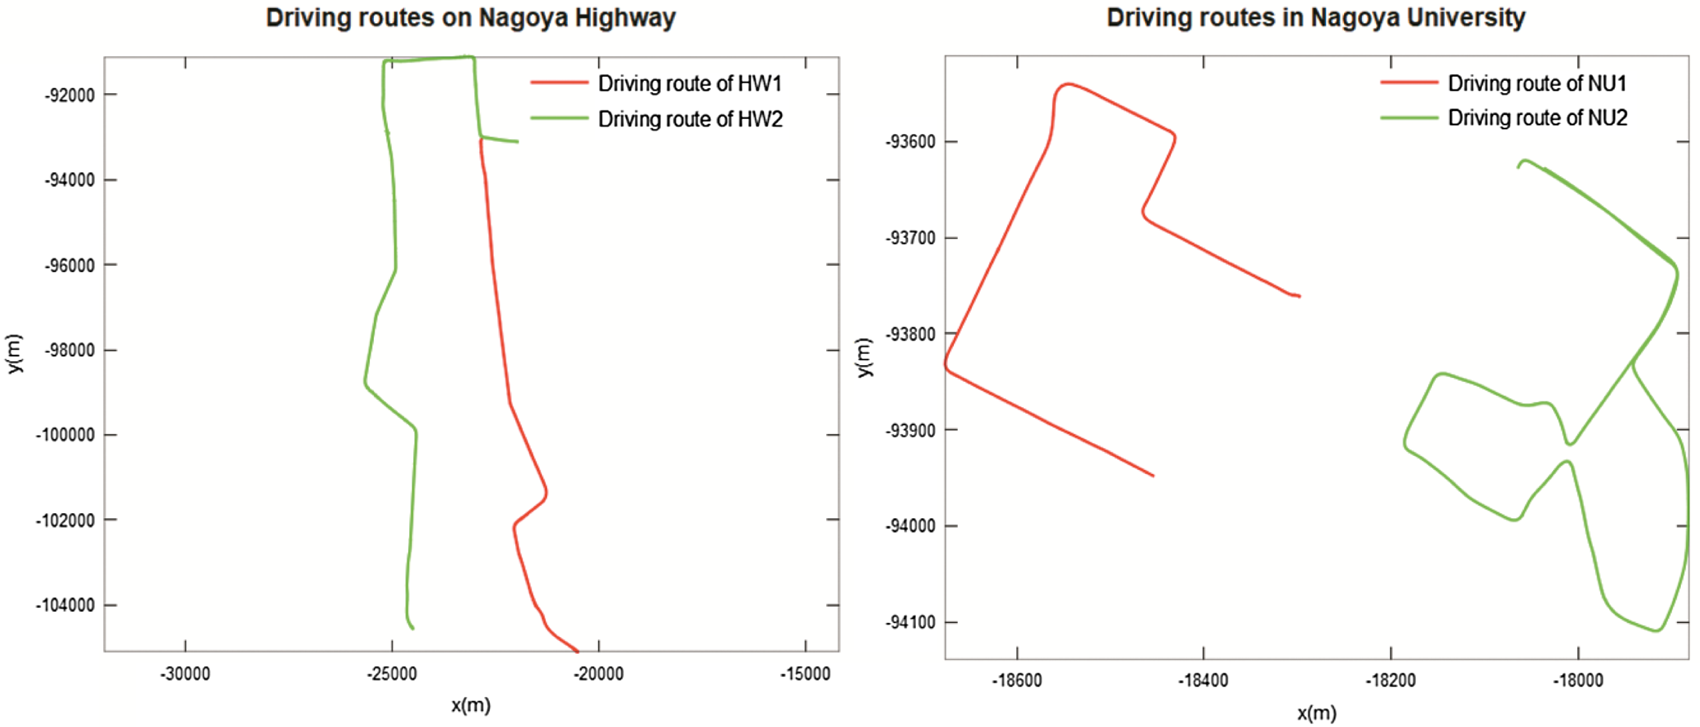
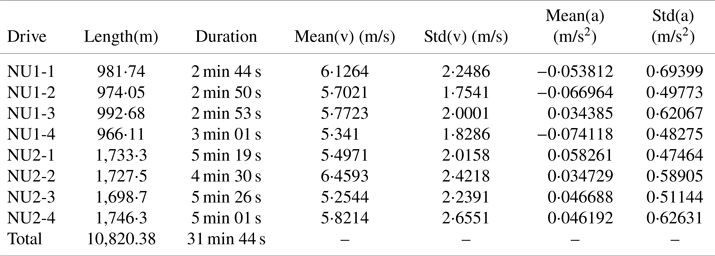
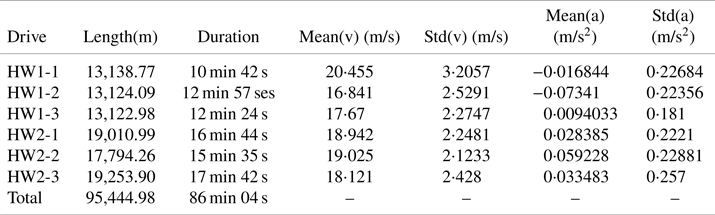
Four typical routes in urban and highway scenarios were selected for the experiments presented in this paper. Figure 6 (left) shows the routes on Nagoya highway (HW) and Figure 6 (right) the routes in the Nagoya University campus (NU). In both the HW and NU experiments, drives were repeated three and four times, respectively. The statistics of all these drives are summarised in Tables 3 and 4. The total length of the driving routes was more than 105 km and the total driving time was nearly 2 h. In these drives, most of the commonest driving manoeuvres were performed: car following, overtaking and lane change on Nagoya highway; braking, stop, accelerating and turning on the campus of Nagoya University.
Driving routes of experiments

Statistics of each drive at Nagoya University

Statistics of each drive on Nagoya highway

3.3 Comparative evaluation of the filters’ performance in vehicular state estimation.
3.3.1 Relative difference
The most popular indicator for estimation accuracy is root-mean-square error (RMSE). In this paper, the relative difference evaluation was provided, instead of the absolute error evaluation. In the NU and HW experiments, the state estimates E1, E2 and E3 are respectively compared with the corresponding baseline E0 to assess their relative difference. (Both the baselines of NU and HW were generated by UKF-CTRA, integrating LiDAR-IMU and GPS-IMU respectively. The configurations are presented in Section 3.1.2.) The relative RMSE (RRMSE) is formulised as

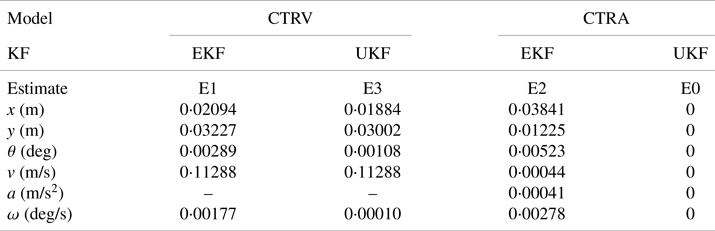
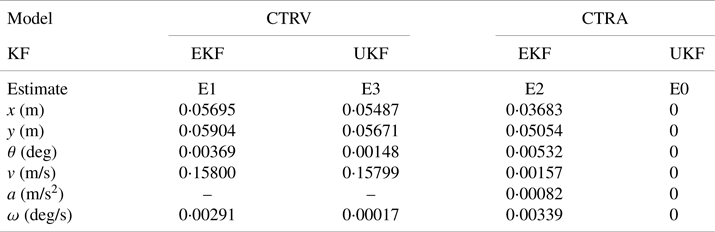
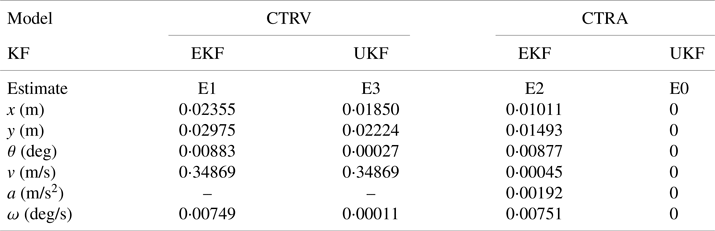
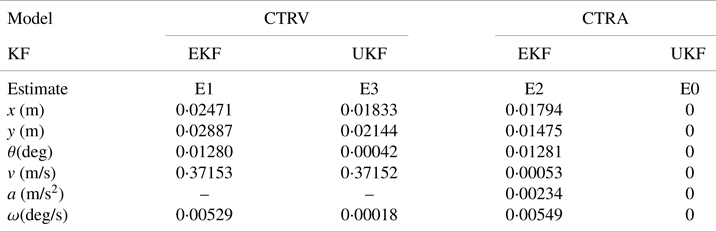
The mean RRMSEs of all the state estimates of each route are presented in Tables 5–8. From the tables, it can be found that the four filters have not made a significant difference to state estimation (not positioning). UKF and the EKF have roughly identical performance in contrast to the simulation-based experiments where UKF shows a distinct improvement of accuracy (Tsogas et al., Reference Tsogas, Polychronopoulos and Amditis2005; Yang et al., Reference Yang, Shi and Chen2017).
The mean RRMSE of HW1

Mean RRMSE of HW2

Mean RRMSE of NU1

Mean RRMSE of NU2

A trend can be found in position estimation that E2 has the smallest relative difference, then E3 and E1 has the largest relative difference, with respect to E0. This matches the conclusions of the existing literature that UKF outperforms EKF (Yang et al., Reference Yang, Shi and Chen2017) and CTRA based filters make slightly better position estimates than CTRV based filters (Schubert et al., Reference Schubert, Richter and Wanielik2008, Reference Schubert, Adam, Obst, Mattern, Leonhardt and Wanielik2011). The heading and turn rate estimates of the four filters appear to be exactly the same, which is due to the CTRV and CTRA models having the same constant turn rate hypotheses.
Compared with other state estimates, the velocity estimates of CTRA and CTRV based filters produced relatively obvious differences, in both highway and urban scenarios. The reason is the different velocity assumptions of the two models. The CTRA model takes acceleration into account and the velocity is driven by acceleration; however, the CTRV model assumes the velocity remains constant. In velocity alone, it can be observed that the relative difference of the velocity estimate in urban driving is larger than that of highway driving, which is caused by different driving styles on highway and urban routes. On the highway, drivers prefer to drive the car at an even speed most of the time; whereas, in urban areas, many accelerating/decelerating manoeuvres have to be performed, especially at road intersections. That is why acceleration in urban driving shows higher standard deviations than highway driving (Tables 3 and 4). The changes in acceleration result in the greater relative difference in velocity estimation. In low dynamic situations (Tables 5 and 6), the performance of the two models is approximately the same.
The overall results indicate that the motion model has more effect on the filter's performance than the KF form; with the same process model, the accuracy performance of EKF and UKF is almost identical. In high dynamic situations and where the speed estimate is critical, the CTRA model based filter is recommended. Otherwise, the performance of the CTRV model based filter is also acceptable.
The negligible estimation differences among the four filters are explained by the non-severe nonlinearities of the CTRV and CTRA models, which mean that the linearisation in EKF does not cause much information loss. Besides, the low dynamics of the vehicle and the high sampling rate of the sensor make the vehicular motion quasi-linear. UKF thus does not have obvious superiority.
3.3.2 Time efficiency
Limited by the space of this paper, in this section, the results of HW1-1 and HW2-1 drives, where GPS worked at 10 Hz, arre not presented. In the experiments, when using LiDAR and IMU, a complete iteration consists of 10 predictions, 10 IMU updates and one LiDAR update; for GPS and IMU, a complete iteration consists of five predictions, five IMU updates and one GPS update. This is done by using an ROS (Robot Operating System) time synchroniser (for more information, please see http://wiki.ros.org/message_filters). The experiments were run on a normal personal computer (Inter Core i7-4790 CPU @ 3⋅6 GHz, RAM 8G, Windows 10). Each drive's experiment was repeated 10 times. The running time of each estimator was recorded and the average time cost (microsecond) per iteration was calculated and shown in Tables 9–12.
Average time cost per iteration of HW1 (GPS@20 Hz)

Average time cost per iteration of HW2 (GPS@20 Hz)

Average time cost per iteration of NU1 (LiDAR@10 Hz)

Average time cost per iteration of NU2 (LiDAR@10 Hz)

In Tables 9–12, each row records the time cost of EKF and UKF, using the same model; and each column is the time cost of the filter using identical KF form and different models. The UKF/EKF column records the time cost rate of UKF and EKF with the same model, and the CTRA/CTRV row records the time cost rate of the filters using identical KF form and different models. In particular, the bottom-right cell is the time cost rate of the slowest (UKF-CTRA) and the fastest filters (EKF-CTRV). A clear conclusion can be drawn that, when utilising the same model, EKF is faster than UKF; and when utilising the same KF form, the filter using CTRV is faster than the filter using CTRA. For a higher dimension model, EKF is obviously faster than UKF since UKF has to calculate 2L + 1 sigma points by taking a matrix square root of the state covariance matrix at each iteration and propagating these sigma points at the prediction and update steps.
In Tables 9 and 10, the average time cost of each filter is shorter than that in Tables 11 and 12. This is caused by the higher update frequency of GPS (20 Hz) compared with LiDAR (10 Hz). Despite that, the UKF/EKF and CTRA/CTRV rates are approximately equal.
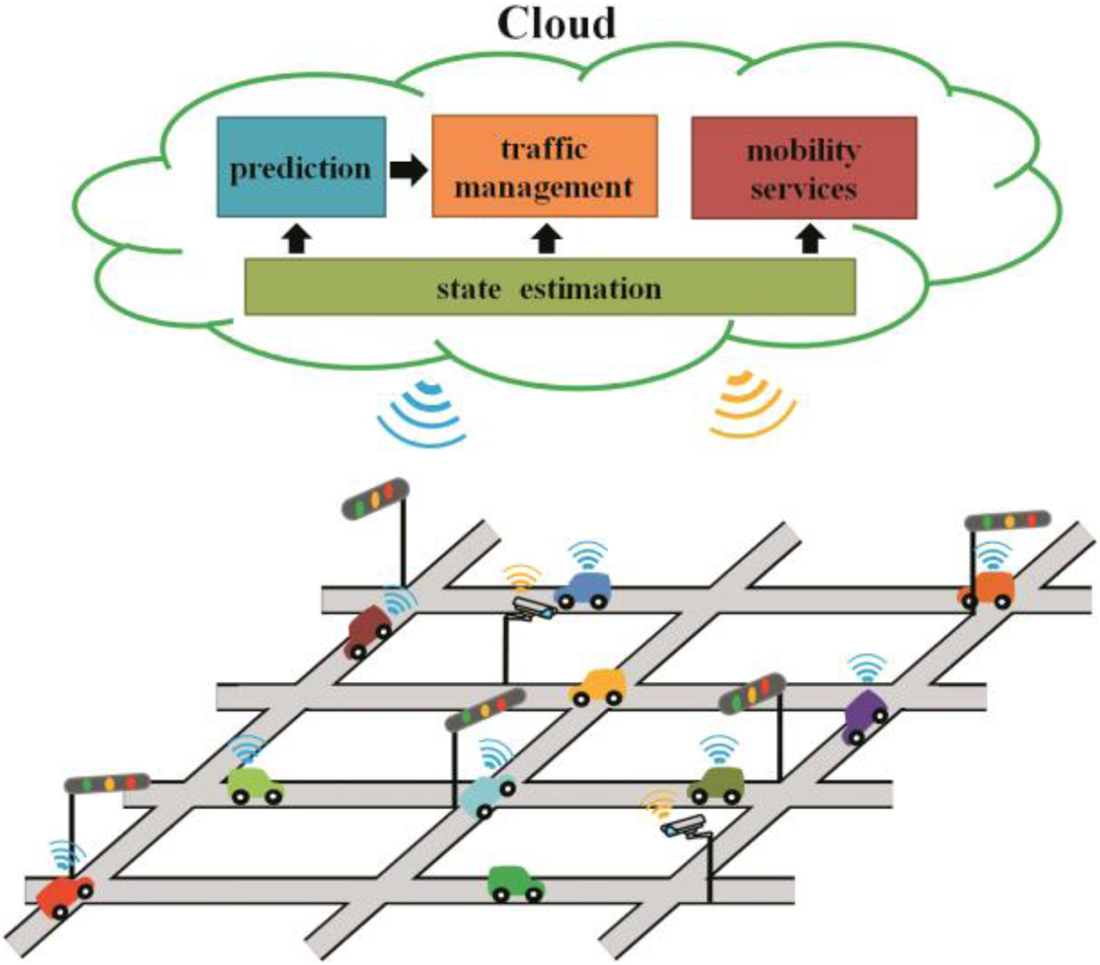
It is remarkable that the EKF-CTRV is about 2⋅6 times faster than the UKF-CTRA while their accuracies are almost equal (see Tables 5–8). EKF-CTRV may not make a significant improvement in efficiency in most current applications, where just the states of several vehicles need to be estimated. When the amount of vehicles increases substantially, however, it becomes another situation, such as SENSORIS (SENSORIS, 2017) where data is exchanged between the vehicle sensors and a dedicated cloud. As Figure 7 illustrates, the data from vehicles and roadside sensors are gathered into the cloud, where vehicle state estimation is essential for mobility related applications. Such a system has urgent need of real-time processing. In this situation, the EKF-CTRV filter will show its distinguished performance. For example, in the same amount of time, the EKF-CTRV can process information from nearly 2,600 vehicles; however, the UKF-CTRA can only process information from 1,000 vehicles. The efficiency of the system can be greatly improved, with negligible accuracy loss.
Dedicated cloud for vehicle and road side sensor

In summary, for a specific application, an ideal filter is composed of the most appropriate motion model and KF form, taking both accuracy and efficiency into consideration. In vehicular state estimation, EKF and UKF have not made distinct differences in accuracy; however, in the efficiency aspect, EKF is faster than UKF. The state estimation performance of the CTRV and CTRA model based filters is roughly identical.
3.4 Comparison of the models’ performance in path prediction
To investigate the models’ properties and the affecting factors in path prediction, the predicted path is defined by Equation (29).

where the path consists of sequential position points predicted by the kinematic model F (CTRV or CTRA). Given an initial state ${\textbf{x}_{{t_0}}}$ , a path can be generated iteratively via Equation (29).
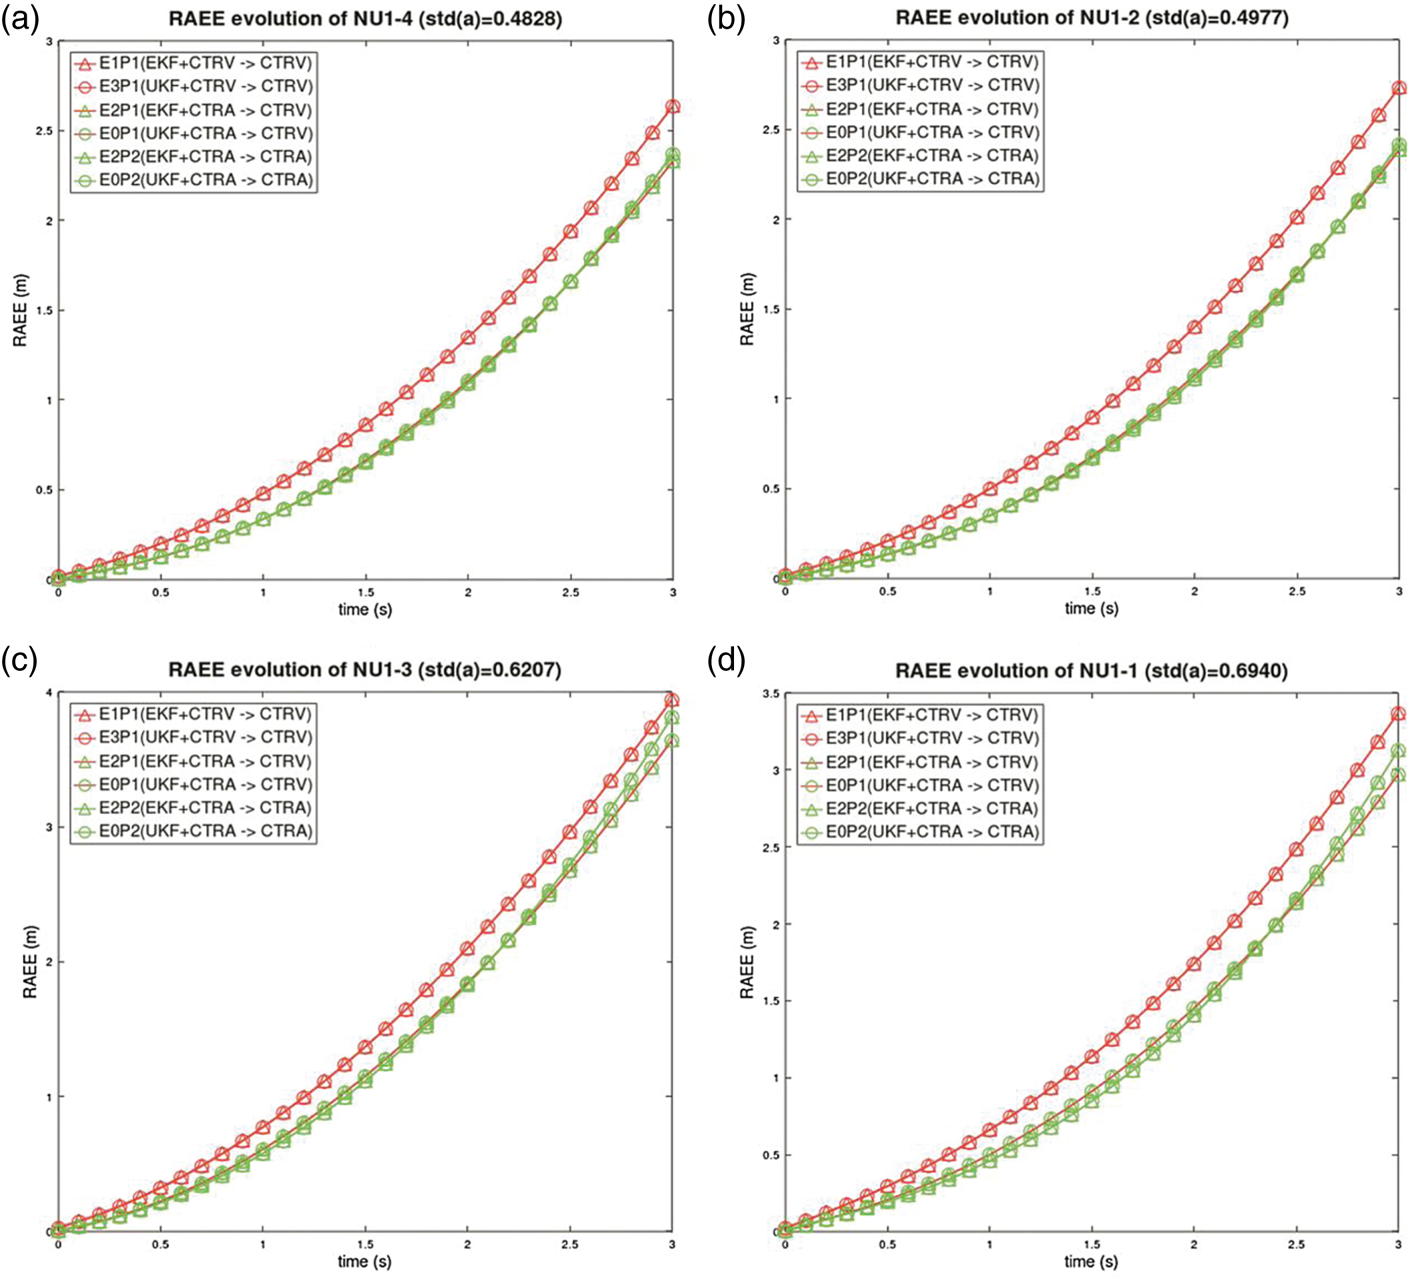
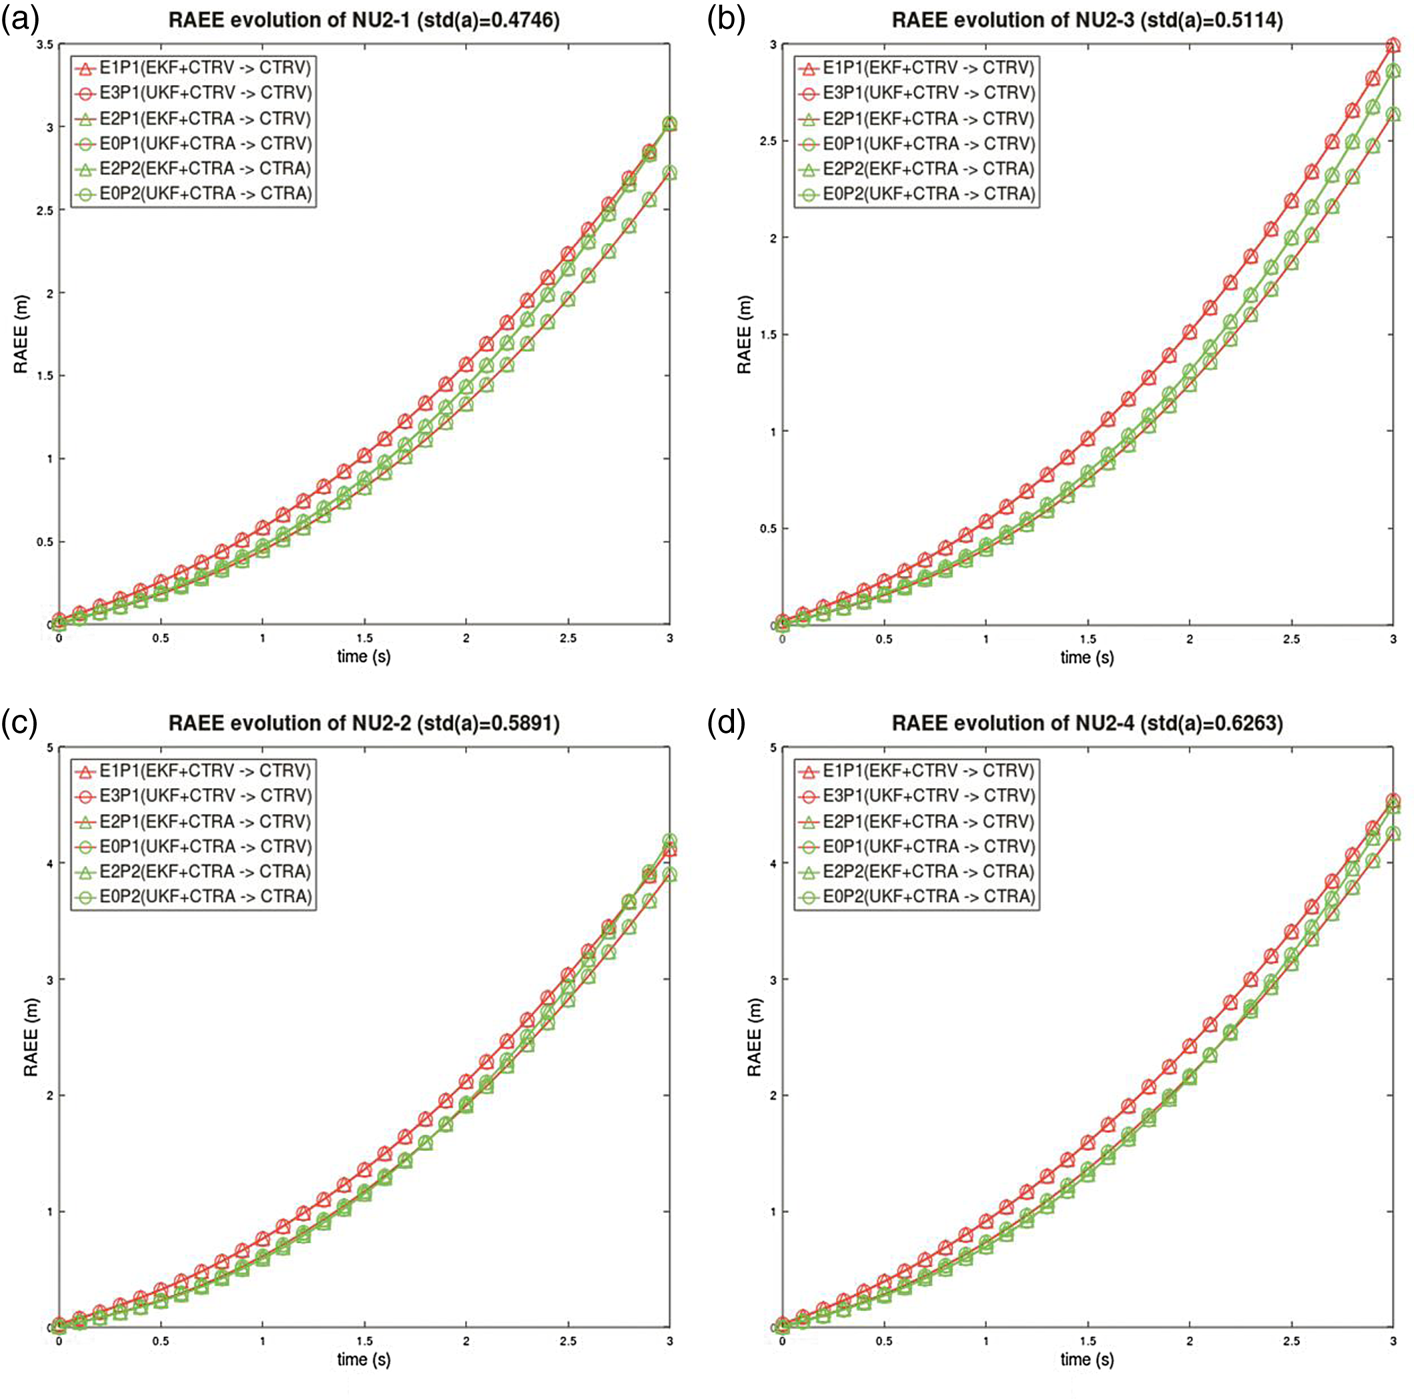
The relative average Euclidean error (RAEE) at instant ti of a certain PATH defined in Equation (30) is used to measure the path's reliability evolution, where pathj denotes the j-th predicted path; N is the number of predicted paths and $\textrm{PATH} \in \{{\textrm{E1P1,}\;\textrm{E3P1,}\;\textrm{E2P1,}\;\textrm{E0P1,}\;\textrm{E2P2,}\;\textrm{E0P2}} \}$ .

Since the baseline estimated based on GPS measurements still retained residuals of several metres, for reasons of caution, the path prediction experiment was not conducted on the highway drive. In contrast, LiDAR provided sub-metre positioning results, at least (Liu et al., Reference Liu, Wang and Zhang2020). In this section, just the experiments at Nagoya University are discussed.
The evolution of RAEE over the time of each drive on routes NU1 and NU2 is presented in Figures 8 and 9, respectively. In the figures, the RAEE evolution of a certain PATH is represented by a marked line with different colour. The red and green lines indicate CTRV and CTRA based prediction, respectively. The triangular and circular marks, respectively, indicate that the EKF or UKF estimate is used in the prediction. The colour of the mark indicates the process model used in state estimation; red is CTRV and green is CTRA.
RAEE evolution over time of each drive on route NU1

RAEE evolution over time of each drive on route NU2

In Figures 8 and 9, there are three outstanding characteristics: (1) the red lines with red marks have the largest RAEE, which means the paths predicted by CTRV using the state estimates of CTRV-based filters have the largest relative difference; (2) the triangular and circular marks are superposed, which means the KF form (EKF or UKF) barely affects the path prediction; (3) all the RAEEs increase exponentially over time. It can be inferred that (1) is caused by the different initial velocity estimates because the red lines with green marks have the lowest RAEE and the only obvious differences between them are the initial velocities, see Tables 7 and 8. The reason for (2) is the negligible estimate difference between identical-model based EKF and UKF, see Tables 7 and 8. The cause of (3) is that the prediction, in fact, is an open-loop KF without any updates, thus the prediction becomes divergent over time.
It can be observed in NU1-4 and NU1-2 drives [Figures 8(a) and 8(b)] that the CTRV and CTRA models have almost identical performance. This is because the acceleration was steady in the drives [low standard deviation of acceleration (std-a)] which results in low standard deviation of velocity (std-v), see Table 3. In such condition, the vehicle was likely to move uniformly; therefore, the two models produced almost identical predictions. However, with low std-a, in NU2-1 and NU2-3 drives [Figures 9(a) and 9(b)], CTRV predicted better than CTRA. The reasons are associated with the road conditions. The NU2 route is the most curved and sloped, so it is harder for the driver to keep a constant acceleration than a constant velocity on NU2. Therefore, the constant velocity hypothesis of CTRV is more realistic than the constant acceleration hypothesis of CTRA. It can be summarised that in low std-a situations (low dynamics) CTRV model predicts more reliably. With std-a increasing, RAEE of the CTRA prediction decreased with respect to that of CTRV at the beginning (Figures 8 and 9, (c) and (d)]; however, RAEE of the CTRA prediction became larger than that of CTRV about 2 s later. This reveals the fact that continuous long-term accelerating is not permitted on the Nagoya University campus. It can be inferred that the CTRA model predicts more reliably when the vehicle has high dynamics [Figures 8(d) and 9(d)].
From the experiments, some conclusions can be drawn. Firstly, the reliability of predicted path decreases over time; a standalone model should not be used for long-term prediction. Secondly, velocity estimate affects path prediction. Thirdly, the model that matches with the vehicle's driving status predicts better; the prediction model should be chosen dynamically considering the vehicle's behaviour, as done by Lytrivis et al. (Reference Lytrivis, Thomaidis, Tsogas and Amditis2011).
4. Conclusions
This paper has been devoted to comparing the accuracy and efficiency performance of UKF and EKF with different motion models, in vehicular state estimation. The models’ properties and the factors affecting path prediction have also been investigated. UKF and EKF show roughly the same accuracy; the only obvious difference occurs in velocity estimation which is caused by different velocity hypotheses of the CTRA and CTRV models. However, they differed significantly in efficiency. With an identical process model, EKF works faster than UKF; with identical KF form, the filter using CTRV is faster than that using CTRA. The fastest filter, EKF-CTRV, is about 2⋅6 times faster than the slowest, UKF-CTRA. For the application that needs to process mass data with strict real-time demands, EKF-CTRV might be an ideal choice. The velocity estimate and the motion model used affect the reliability in path prediction. A realistic model that reflects the real driving status generates a reliable path. A standalone motion model is not recommended for performing long-term prediction; some additional information should be taken into account, such as the road geometry and topology.
The experiment in this paper was conducted according to urban and highway scenarios. We can also consider more complex scenarios with sensor problems: multipath effect and signal blockage in GPS, drifting in IMU, and LiDAR's sensitivity to the weather. Experiments with UKF and EKF with these factors will be included in the authors’ future work.
Acknowledgements
This work was supported by JST-OPERA Programme, Grant Number JPMJOP1612. The support provided by the China Scholarship Council (CSC) during the studies of Lu Tao at Nagoya University are also acknowledged.
APPENDIX A: JACOBIAN MATRICE OF PROCESS AND OBSERVATION MODELS
For CTRV model, suppose the state transition function is

Then, the Jacobian matrix of CTRV model is as follows.

where


For CTRA model, suppose the state transition function is

Then, the Jacobian matrix of CTRA model is as follows.

where


For the directly observed measurements: position, heading and turn rate, their measurement models’ Jacobian matrices are

The velocity measurement models’ Jacobian matrices are


And acceleration measurement model’ Jacobian matrix is

APPENDIX B: SAMPLE DATA
The sample data from LiDAR, GPS and IMU generated by Autoware in this paper are available at: https://github.com/LuTaonuwhu/LiDAR-GPS-IMU-Data.git.