

Introduction
The incidence of breast muscle myopathies has been reported to increase over the past five to ten years. These myopathies mainly affect the breast fillet, which is the most valuable part of the broiler carcass for Western markets. The three primary myopathies of concern are the so-called white striping (WS), woody breast (WB), and spaghetti meat (SP) which are associated with fast growing, heavier birds. The presence of the deep pectoralis myopathy (DPM; known also as the green-muscle disease) has been reported to a much lesser extent. It should be noted that other myopathies in areas such as the leg muscle (the adductor muscle) and the dorsal cranial area of the bird are detected on occasion, but not at the levels of WS or WB, and, hence, do not represent major economic concern.
There are a growing number of scientific publications focussed on WS, SP, and WB myopathies. Additionally, a number of articles have been published in the popular press, such as the 2016 Wall Street Journal article titled ‘Bigger Chickens Bring a Tough New Problem: Woody Breast’. The author, Gee (2016), quoted a number of researchers estimating that 5-10% of commercial chicken breast products could be affected by WB. They noted that this affects the texture of the fillet, but does not pose a food safety hazard. There was a quote from another researcher reporting that the problem is not necessarily associated with the final weight of the bird but more with how fast the bird achieves this final weight. Other popular press articles, such as the ‘Poultry Industry Digs for Solutions to Woody Breast’, published by the Poultry Times (Keiger, Reference KEIGER2017), reported on the industry experiences dealing with several myopathies.
Kuttappan et al. (Reference KUTTAPPAN, HARGIS and OWENS2016) estimated the cost to the American industry to be around US$200 million per year. However, recent discussions with industry personnel suggested that this number is on the low side, especially when considering that, in the US, about 12.8 billion lb (5.82 billion kg) of chicken breast meat is processed annually (Kuttappan et al., Reference KUTTAPPAN, HARGIS and OWENS2016). At a retail cost of approximately US$1.50 per lb, the market value of this product can be calculated to be US$18 billion per year, and therefore US$200 million only represents about 1% of this.
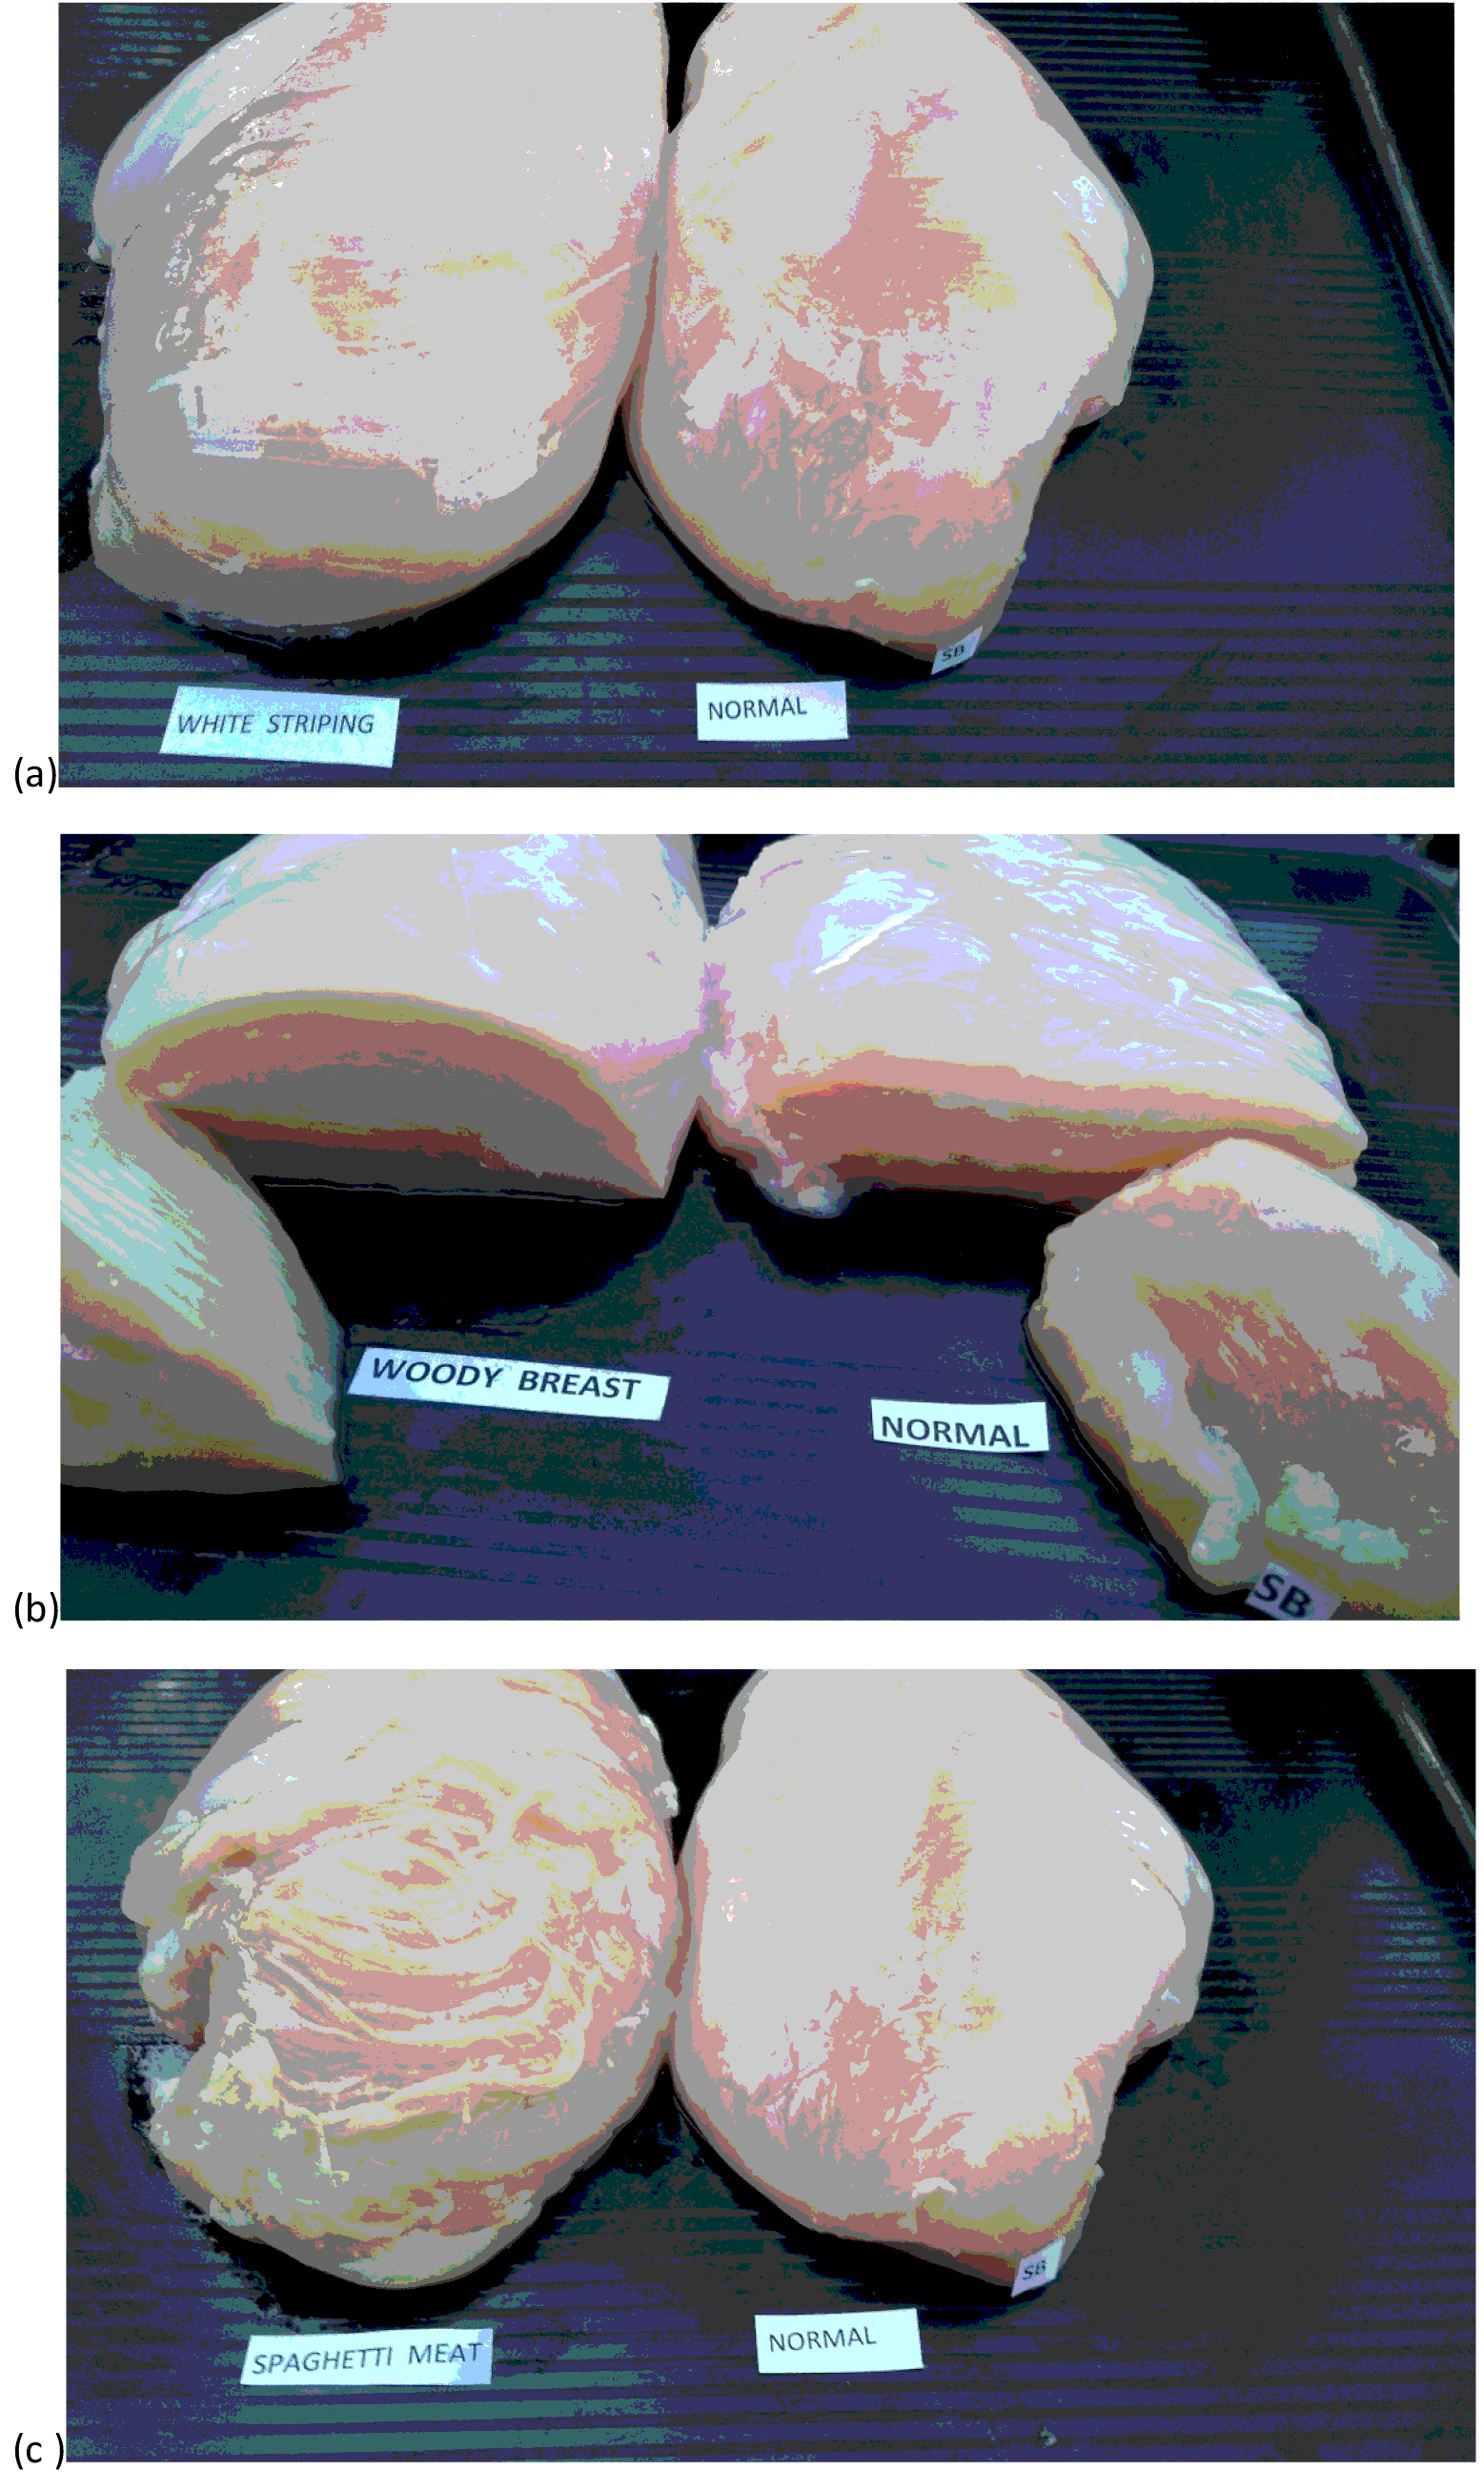
Overall the poultry industry has made major advances in raising chickens faster and in a more efficient way (Figure 1). Some have suggested that fast growth contributes to the increasing incidence of myopathies (Petracci et al., Reference PETRACCI, MUDALAL, SOGLIA and CAVANI2015; Sihvo et al., Reference SIHVO, LINDÉN, AIRAS, IMMONEN, VALAJA and PUOLANNE2017) such as WS (Figure 2a), which results in parallel white stripes on the surface of the young chicken/turkey pectoralis muscle (white striping can sometimes be also seen on the thigh muscle). WB syndrome (Figure 2b), results in the accumulation of connective tissue fibres and fat cells in the inner muscle tissue, causing a firm texture. The third myopathy is the so-called SM (Figure 2c) which is manifested as splitting of the muscle bundles (Baldi et al., Reference BALDI, SOGLIA, MAZZONI, SIRRI, CANONICO, BABINI, LAGHI, CAVANI and PETRACCI2018) into strings.
Age-related changes in size (mixed-sex BW and front view photos) of University of Alberta Meat Control strains unselected since 1957 and 1978, and Ross 308 broilers (2005). Within each strain, images are of the same bird at 0, 28, and 56 d of age. From Zuidhof et al., Reference ZUIDHOF, SCHNEIDER, CARNEY, KORVER and ROBINSON2014.

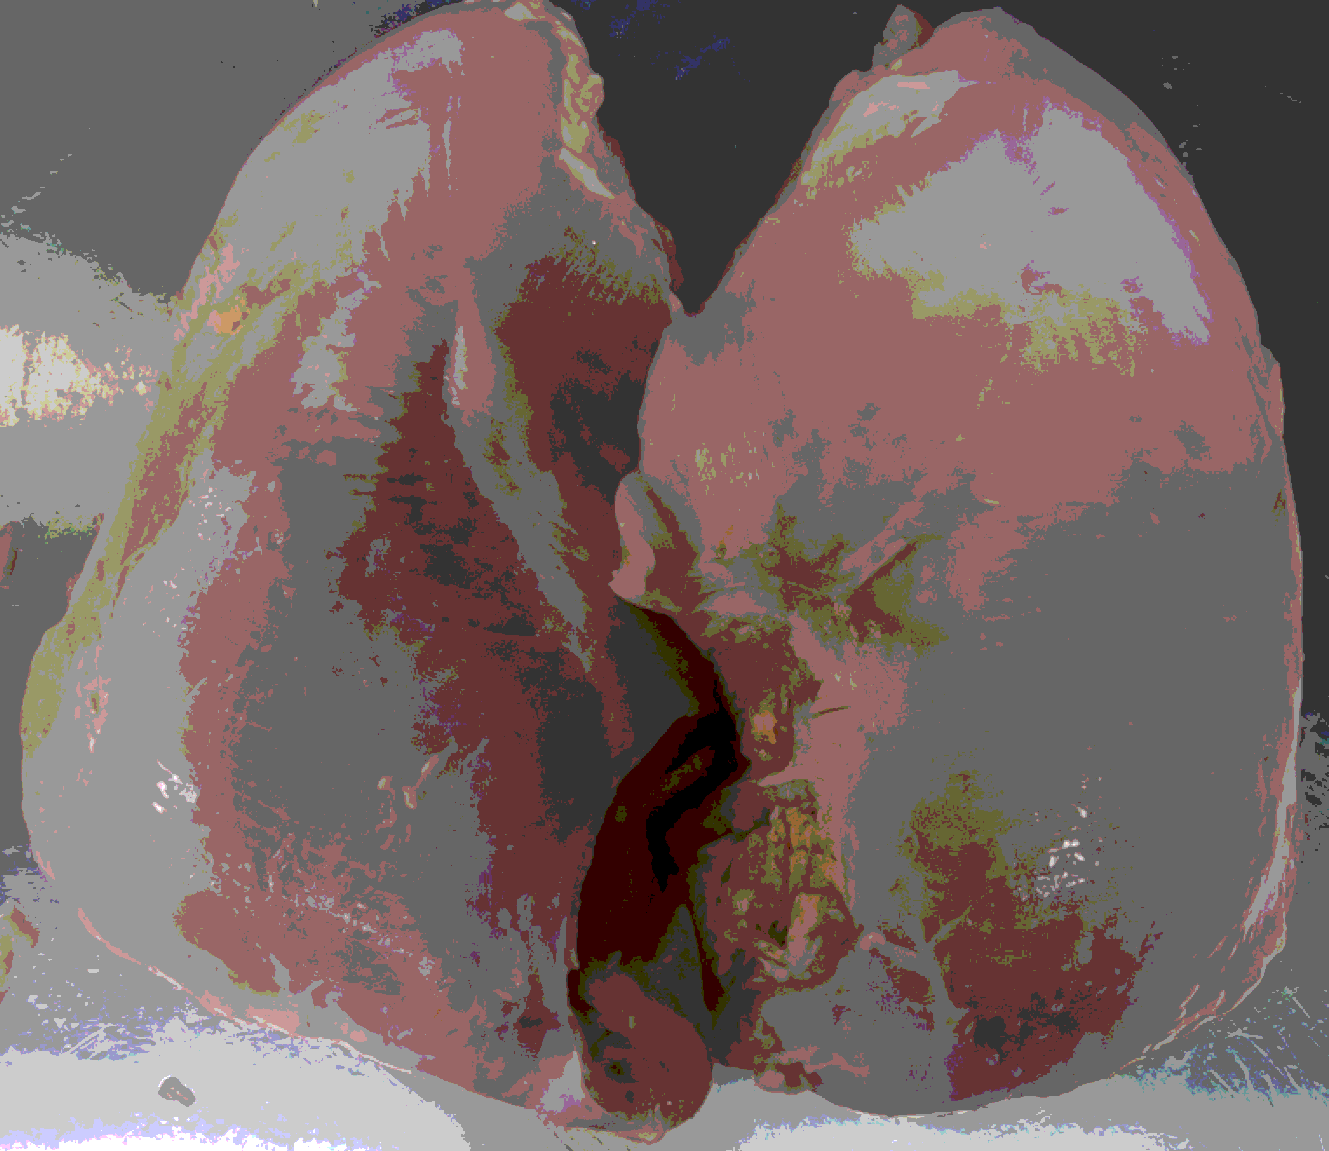
The WS and deep pectoral myopathy (DPM) have been reported in turkeys (Siller, Reference SILLER1985). Figure 3 shows WS in a relatively young turkey tom (22 weeks old). It should be mentioned that DPM used to be seen more in turkeys, but today most modern commercial turkeys do not show this myopathy, and it is believed that this improvement has been achieved via genetic selection. In any case, DPM can still be seen today in a small number of heavy broilers (Bianchi et al., Reference BIANCHI, PETRACCI, FRANCHINI and CAVANI2006; Barbut, Reference BARBUT2015), but it is not as significant as WB or SM. In terms of WS in turkeys, Zampiga et al. (Reference ZAMPIGA, TAVANIELLO, SOGLIA, PETRACCI, MAZZONI, MAIORANO, MELUZZI, CLAVENZANI and SIRRI2019) have reported 46% and 60% occurrence in two different commercial hybrids. The occurrence of SM was negligible.
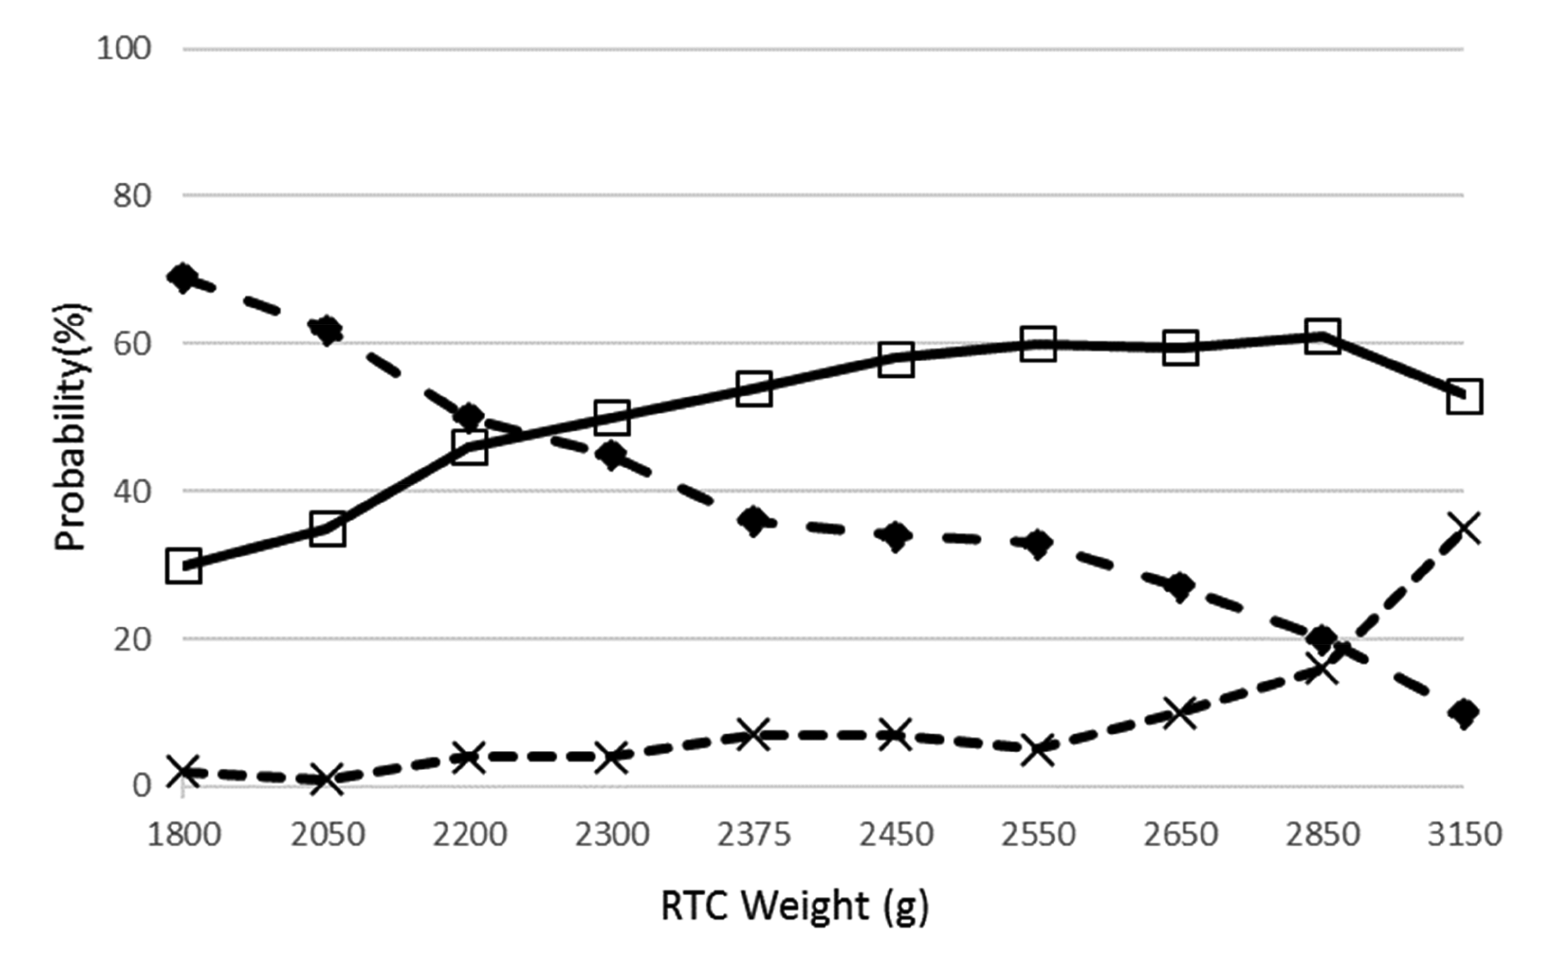
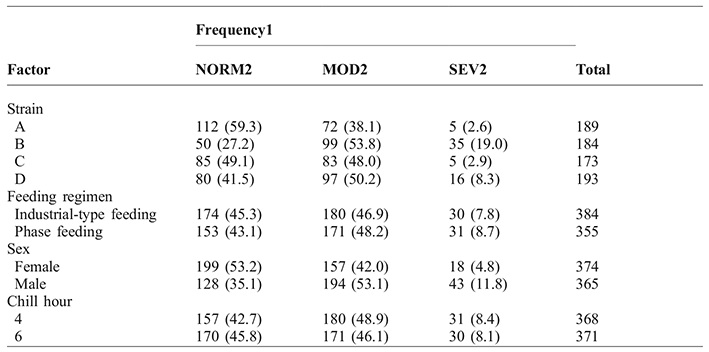
According to the literature relating to broiler chickens, the incidence of WS increases as body weight increases (Figure 4). As broilers grow above 2.7 kg, the number of severe WS cases increases and the proportion of low WS decreases. However, today it is known that this is related to growth rate at a specific age of the bird (as described in the discussion below), and not only related to the absolute body weight. Researchers have looked at four different broiler strains (Table 1) and showed that the frequency of severe WS was 2.6% for strain A, 19% for strain B, 2.9% for strain C, and 8.3% for strain D (Kuttappan et al., Reference KUTTAPPAN, BREWER, MAUROMOUSTAKOS, MCKEE, EMMERT, MEULLENET and OWENS2013a).
Myopathies in chicken breast meat. (a) white striation, (b) woody breast; showing also differences in rigidity, (c) the so-called “spaghetti meat” myopathy. Pictures by Barbut, 2019.

White striation in turkey meat. Picture by Barbut, 2019.

Probability of the occurrence of NORM (black circles), MOD (open squares), and SEV (black crosses) fillets with respect to ready-to-cook (RTC) weight. NORM = normal (no white striping); MOD = moderate degree of white striping; SEV = severe degree of white striping. Redrawn from Kuttappan et al., Reference KUTTAPPAN, BREWER, MAUROMOUSTAKOS, MCKEE, EMMERT, MEULLENET and OWENS2013a.

Frequency and the probability of occurrence of 3 degrees of white striping1 with respect to the factors or categorical independent variables. From Kuttappan et al., Reference KUTTAPPAN, BREWER, MAUROMOUSTAKOS, MCKEE, EMMERT, MEULLENET and OWENS2013a.

1n (% based on the total number in the respective rows).
2NORM = normal (no white striping); MOD = moderate degree of white striping; SEV = severe degree of white striping.
Industrial type feeding vs. phase feeding did not cause an effect. However, males showed higher numbers of severe WS compared to female birds (11.8 vs. 4.8%). It is important to note that new information from a large grower (personal communication) suggested that, if such a comparison is made (male vs. female), overall body weight should be taken into account, as recent field data showed that, for the same body weight, female birds tended to have a higher proportion of WS.
The triggers for developing those myopathies can vary substantially and there are different factors that potentially contribute to the development of WB, WS and SM. Figure 5 shows a schematic diagram illustrating that myopathies can be a result of muscle cell damage that usually does not have enough time for repair, especially in a fast growing bird (i.e. normal muscles cells usually go through injury and repair cycles without showing any lasting effects, Barbut, Reference BARBUT2015). Figure 5 illustrates the role of satellite cells in the repair mechanism. The list of factors found outside the two central circles, indicates different possible causes.
Today, farmers are more aware that decreasing growth rate can minimise myopathies; however, this affects overall production efficiency which is a major financial driver for growers. Genetics plays a role and currently breeding companies are working on selecting birds which are less susceptible to these myopathies. Additionally, there is a growing body of literature focusing on oxidative stress and insufficient oxygen supply to the fast-growing pectoralis muscle, and how these can impact myopathy development (Abasht et al., Reference ABASHT, MUTRYN, MICHALEK and LEE2016; Lilburn et al., Reference LILBURN, GRIFFIN and WICK2018).
The factors that influence the incidence of breast meat myopathies in poultry. Red arrows indicate negative factors and the green arrows positive factors (colour image is online). Factors shown with a “?” have only tentative evidence that they are important. From Aviagen, 2016.

Field observations
White striping is a condition where parallel white lines appear on the surface of the Pectoralis major (Figure 2a). This is the result of muscle fibre infiltration with fat and connective tissue (Figure 6).
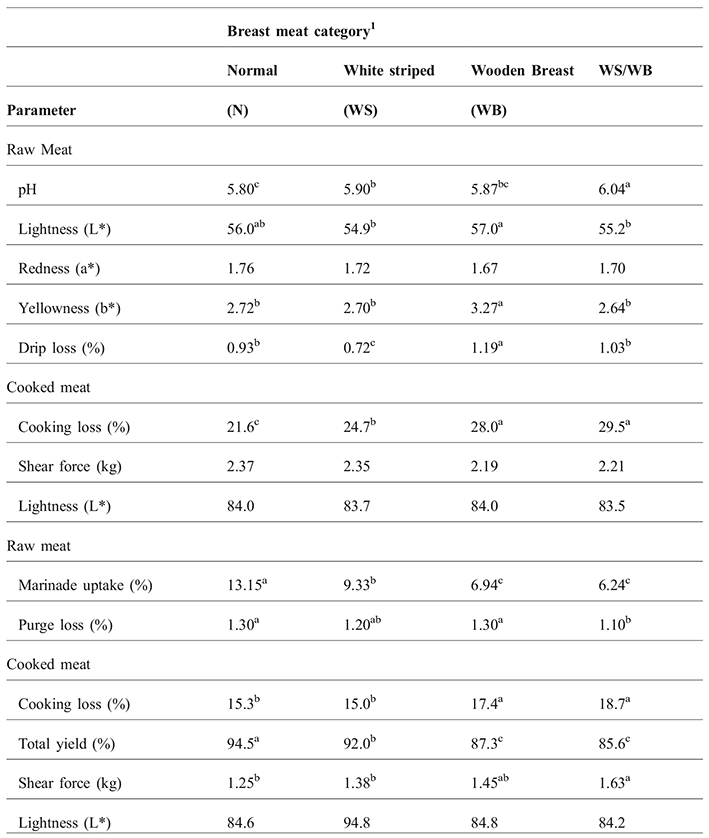
In the past, it was more typical to see WS in older laying hens, but today it can be seen in young (30-50 day old) broilers, or in birds younger than 30 days (Griffin et al., Reference GRIFFIN, MORAES, WICK and LILBURN2018). Figure 6 shows the accumulation of fat cells (white areas) and connective tissue fibres (stained blue by the Masson stain), while unaffected fillets predominately had no accumulation of fat cells and intact collagen fibres. Fillets with WS showed some myodegenerative muscle fibres, inflammatory cells and infiltration of eosinophilic material (Kuttappan et al., Reference KUTTAPPAN, BREWER, MAUROMOUSTAKOS, MCKEE, EMMERT, MEULLENET and OWENS2013a; Reference KUTTAPPAN, SHIVAPRASAD, SHAW, VALENTINE, HARGIS, CLARK, MCKEE and OWENS2013b), all of which were indicative of muscle cell injury. Table 2 summarises field observations of meat quality differences between normal and WS fillets. Overall, the WS fillets showed higher cooking loss because they had less functional proteins (i.e. some of the myofibrillar proteins, which have high water holding capacity, have been replaced by connective tissue proteins). The WS fillets showed lower marinade uptake, resulting in overall lower cooking yield, for the same reason (Mudalal et al., Reference MUDALAL, LORENZI, SOGLIA, CAVANI and PETRACCI2015).
Histology of white striation. Myofibers replaced by bundles of collagen (stained blue by Masson) and fat cells (white areas). Micrograph from Barbut, 2018 (personal communication).

Woody breast fillets are characterised by a firmer texture of the harvested meat, which can be detected in the live bird by palpation (Sihvo et al., Reference SIHVO, AIRAS, LINDÉN and PUOLANNE2018), and the presence of a harder ridge when deboned fillets are placed on a flat surface (Kuttappan et al., Reference KUTTAPPAN, HARGIS and OWENS2016; Papah et al., Reference PAPAH, BRANNICK, SCHMIDT and ABASHT2017). Sometimes this is accompanied by a paler appearance, some surface haemorrhages, and clear exudate on the surface (Figure 2b). It should be mentioned that the severity of WS and of WB varies among birds, and therefore simple scales have been developed to rank the degree and severity (commonly a 0, 1, 2, 3 scale is used; examples and a picture are provided here in the Detection and Grading section, see also Griffin et al., Reference GRIFFIN, MORAES, WICK and LILBURN2018). Grading is important to the industry as fillets with a low degree of WS or WB do not pose a problem in meat processing and marketing. However, if severity and proportion of WS or WB increases in the flock, some action or sorting of the fillets is required. Today a number of processors sort the meat in their plants and divert severe cases to specific operations. Table 2 provides actual values of some of the meat processing characteristics of WB meat (e.g. higher drip loss and cooking loss compared to normal meat). When this meat is marinated, the percentage uptake is lower than in normal meat and it has higher cooking losses compared to normal and WS meat. Other researchers have published similar results (Cai et al., Reference CAI, SHAO, CHEN, CAMPBELL, NAIR, SUMAN, BEACH, GUYTON and SCHILLING2017), suggesting that the lower cooking yield is related to the substitution of injured muscle fibres with connective tissue and fat. Figure 7 shows the microstructure of the WB-affected muscle and the accumulation of adipose tissue cells (on the left), and lymphocyte accumulation in a pre-vascular location (on the right). The latter indicates the beginning of injured muscle cell removal. Sihvo et al. (Reference SIHVO, LINDÉN, AIRAS, IMMONEN, VALAJA and PUOLANNE2017) have described this type of histology and stated that white striping often coexisted with WB. Histological evaluation revealed a significant association of myodegeneration and lymphocytic vasculitis with WB. Vasculitis and perivascular cell infiltration were restricted to the veins. Results indicated that WB started focally and spread to form a diffuse and more severe lesion.
Bilgili (Reference BILGILI2013) hypothesised that localised hypoxia is present in WB tissue due to vascular disruption and/or stagnant tissue perfusion. Later, Lilburn et al. (Reference LILBURN, GRIFFIN and WICK2018) discussed why localized hypoxia is a potential cause of the anomalies of WS and WB in the muscle (see more in next section). Sihvo et al. (Reference SIHVO, AIRAS, LINDÉN and PUOLANNE2018) compared the pectoral vessel density between unaffected birds and two areas of focal WB in affected chickens, using light and transmission electron microscopy. They reported that the transverse myofiber area, per vessel, was highest in the unaffected area of muscle from cases of focal WB. This was higher (P<0.01) than in macroscopically unaffected tissue, indicating that relatively decreased blood supply may trigger the development of WB in affected birds. The authors mentioned that such changes typically originate from osmotic imbalance, for which the most likely aetiologies in developing WB include tissue hypoxia or myodegradation of the surrounding myofibers.
Effects of breast abnormalities on raw meat quality. From Mudalal et al., Reference MUDALAL, LORENZI, SOGLIA, CAVANI and PETRACCI2015.

a to c Means within a row followed by different superscript letters differ significantly (P≤0.05).
1 n = 48/group.
Histology of wooden breast syndrome. Micrograph from Barbut and Susta 2018 (personal communication).

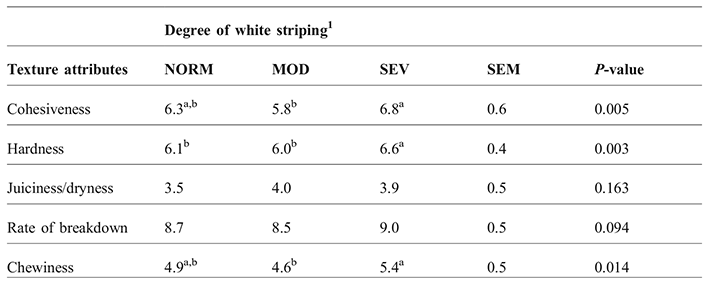
In terms of sensory characteristics of the resulting cooked meat, Sanchez Brambila et al. (Reference SANCHEZ BRAMBILA, BOWKER and ZHUANG2016) reported that the hardness of severe WS meat was significantly higher than normal and moderate WS meat (Table 3). Tasoniero et al. (Reference TASONIERO, CULLERE, CECCHINATO, PUOLANNE and DALLE ZOTTE2016) noted that the simultaneous presence of WB and WS resulted in higher taste panel perception of toughness compared to normal meat (6.22 vs. 5.56; P<0.01), and instrumental toughness (22.8 vs. 20.0N; P<0.01). Sanchez Brambila et al. (Reference SANCHEZ BRAMBILA, CHATTERJEE, BOWKER and ZHUANG2017) have reported higher (P<0.05) sensory analysis scores when comparing WB to normal fillets for springiness and hardness. However, no difference was found when the meat was ground and made into patties. Aguirre et al. (Reference AGUIRRE, OWENS, MILLER and ALVARADO2018) reported that severe WB marinated fillets scored higher for hardness, springiness, denseness, cohesiveness, fracturability and fibrousness compared to normal fillets cooked in a conventional oven or on a flat-top grill. However, it should be noted that some other reports indicated that sensory panellists could not detect differences after cooking.
Intensity scores (0 to 15 scale) of sensory analyses of texture attributes of cooked broiler breast fillets (P. major) with different degrees white striping (n = 14). From Sanchez Brambila et al. (Reference SANCHEZ BRAMBILA, BOWKER and ZHUANG2016).

a,bMean values with no common superscript in the same column are significantly different (P<0.05).
1NORM = Normal (No white striping); MOD = Moderate degree of white striping; and SEV = Severe degree of white striping.
Occurrence of SM is a fairly new problem which is seen as the separation of muscle bundles, mainly in the cranial region of the P. major, and sometimes can be seen together with WS (Baldi et al., Reference BALDI, SOGLIA, MAZZONI, SIRRI, CANONICO, BABINI, LAGHI, CAVANI and PETRACCI2018). These authors reported an association with increased Pectoralis thickness, weight and length in both SM and WS fillets. Industry reports have indicated difficulties in processing the meat because of loose texture of the splitting muscle bundles, as well as higher moisture losses. Both factors mean that producers can separate and divert the affected meat to special uses (e.g. ground meat plus binding agents). It is not clear yet if this already occurs in the live muscle, or after cutting/detaching the muscle from the bones. Histology of commercially processed fillet samples showing SM revealed poor fibre uniformity and progressive rarefaction of the endo- and peri-mysial connective tissue (Baldi et al., Reference BALDI, SOGLIA, MAZZONI, SIRRI, CANONICO, BABINI, LAGHI, CAVANI and PETRACCI2018). They showed higher proportion of extra myofibrillar water in the superficial section of the SM fillets (using NMR analysis) which led to a reduction in the water holding capacity of the meat.
Potential causes
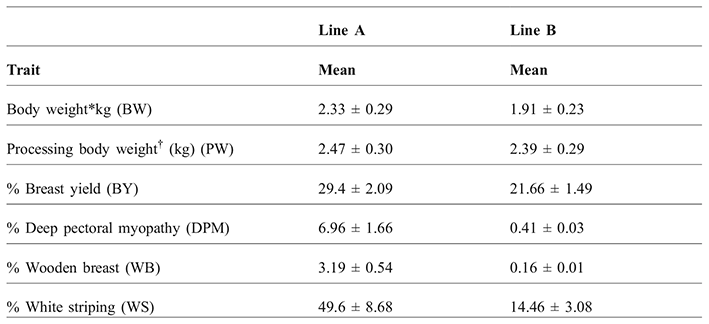
Researchers and commercial companies are currently looking at the contribution of genetic, nutrition, environment and management factors to the occurrence of WS, WB and SM myopathies in breast meat fillets. Data from a large group of broilers (>100,000), presented in Table 4, showed that there is a difference between two purebred lines of commercial broilers; e.g. selection history resulted in breast meat yields of 29 vs. 21% for breeds A and B respectively (Bailey et al., Reference BAILEY, WATSON, BILGILI and AVENDANO2015).
Descriptive statistics for the traits for each line. Breast yield is expressed as a percentage of processing body weight. The myopathies are expressed here as percentage incidence within the flocks. From Bailey et al., Reference BAILEY, WATSON, BILGILI and AVENDANO2015.

*42 d of age Line A, 32 d of age Line B.
†47 d of age Line A, 40 d of age Line B.
The interesting fact reported by this group (Bailey et al., Reference BAILEY, WATSON, BILGILI and AVENDANO2015) was that there are birds with a high genetic potential for increased body weight and below average for WB problem, as seen in Figure 8 at the bottom right quadrant of the plot. The authors reported that these birds may be used for selection for both traits in the desired direction, and currently that is what is being done by several breeding companies.
XY plot of breeding values (BVs) for WB and % BY of line A (high yielding line). It shows that WB can occur in birds with both high and low BY. It can be seen that there is a proportion of birds with a high genetic potential for BY and below average WB in the bottom right quadrant of the plot. This proportion of birds represents those which can be selected for both traits in the desired direction. From Bailey et al., Reference BAILEY, WATSON, BILGILI and AVENDANO2015.

Overall, the authors reported that data analysis (from the two broiler lines: A and B) indicated that patterns of heritability and genetic correlations were similar. Heritabilities (h2) of body weight (BW), processing body weight (PW) and breast yield (BY) ranged from 0.271-0.418; for DPM and WB h2 <0.1; and for WS h2 ≤0.338. Genetic correlations between breast muscle myopathies (BMM) and BW, PW, and BY were ≤0.132 in Line A and ≤0.248 in Line B. According to the authors, this demonstrated the polygenic nature of these traits and the low genetic relationships with BW, PW, and BY, which facilitated genetic improvement across all traits in a balanced breeding programme. The report highlighted the importance of understanding the environmental and management factors that appear to contribute greater than 65% of the variance in the incidence of WS and over 90% of the variance in the incidence of WB and DPM. Another research group (Alnahhas et al., Reference ALNAHHAS, BERRI, CHABAULT, CHARTRIN, BOULAY, BOURIN and LE BIHAN-DUVAL2016) reported a higher genetic determination for fast growth in broilers and WS (h2 = 0.65), highlighting the importance of using the right selection criteria.
Zuidhof et al. (Reference ZUIDHOF, SCHNEIDER, CARNEY, KORVER and ROBINSON2014) indicated that both genetic selection and nutrition have had a significant effect upon production efficiency and meat yield of the modern broiler. Overall, growth rates have increased over 300% in modern times, body weight is increasing by approximately 3.30% per year, and feed conversion has dropped approximately 2.55% per year. Based on an average straight-run grow out for small to large bird programmes (National Chicken Council, 2018), today's US broilers are marketed at (approximately) 48.8 days of age, weigh 2.98 kg/bird, have an average daily gain of 61.1 g/d, a breast meat yield range of 24 to 26%, and liveability of 95.4%. Even though these statistics were derived from the top 25% of broiler complexes within the USA, (Bodle et al., Reference BODLE, ALVARADO, SHIRLEY, MERCIER and LEE2018), others have indicated that the genetic potential of the commercial broiler may be much greater.
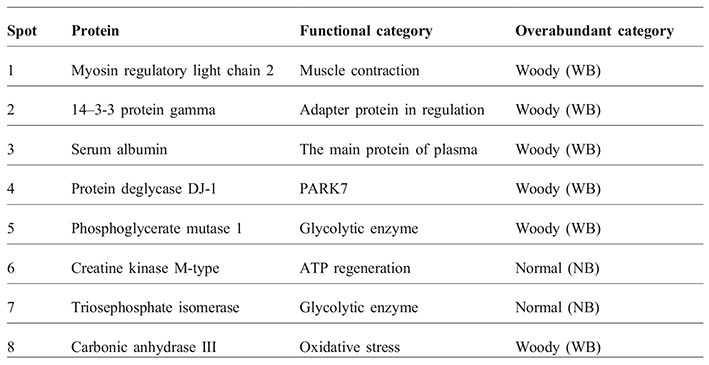
Cai et al. (Reference CAI, SHAO, CHEN, CAMPBELL, NAIR, SUMAN, BEACH, GUYTON and SCHILLING2017) reported on the proteome profiles of WB meat in relation to meat quality traits. They reported that WB meat had significantly (P<0.05) higher cooking losses compared to unaffected meat (20.6 vs. 17.0%, respectively), more fat (1.9 vs. 1.2%), moisture (74.4 vs. 73.8%), less protein (21.7 vs. 23.0%), as well as less salt soluble proteins (14.4 vs. 19.1%). Whole muscle proteome analysis indicated that eight proteins that were differently expressed (P<0.05) between WB and unaffected fillets (Table 5). The authors explained that the differences indicated an increase in oxidative stress in WB meat and recommended more research to elucidate the genetic and nutrition contribution to the proliferation of WB meat.
Functional roles of differentially abundant proteins in normal (NB) and woody (WB) chicken breast (Pectoralis major) identified by liquid chromatography-electrospray ionization-tandem mass spectrometry (LC-ESI-MS/MS). From Cai et al., 2018.

Abasht et al. (Reference ABASHT, MUTRYN, MICHALEK and LEE2016) studied oxidative stress and focused on characterising the metabolic features of WB and normal muscles. Live birds from two purebred broiler lines and one crossbred commercial line were examined by manual palpation of the breast muscle and tissue sampling at 47 d of age. Overall, the affected muscles showed increased oxidative stress, elevated protein levels, altered glucose utilisation, and 140 muscle degradation biochemicals that were significantly different between WB and unaffected chickens. Lipid peroxidation products such as 13-HODE and 9-HODE (13-HODE + 9-HODE; fold change = 5.25) as well as the eicosanoids 15-HEPE (fold-change = 2.30), 15-HETE (fold-change = 6.05), and 15-KETE (fold-change = 4.21) were elevated in affected tissues. In general, increased lipid availability may facilitate the generation of peroxidation products such as 13-HODE and 9-HODE. In terms of proteins, higher levels of cysteine-glutathione disulphide in affected tissues may reflect free radical exposure, and higher levels of the gamma-glutamyl amino acid catabolite 5-oxoproline in affected tissues. Collectively, these findings strongly suggested that affected chickens possessed biological markers of muscle degradation and oxidative stress. Overall, WB tissues showed a unique metabolic signature, which can potentially be used to identify candidate biomarkers for diagnostic purposes. Additionally, the authors reported that glycogen content was 1.7-fold lower in WB samples compared to unaffected birds, suggesting that the well-known glycolytic white muscle fibres are more susceptible to the development of WB. Figure 9 shows a summary of the altered carbohydrate metabolism in WB fillets, with the accumulation of various intermediates.
Altered carbohydrate metabolism in wooden breast disease - The affected tissues exhibited evidence of altered glycogen metabolism and glucose utilization that resulted in the accumulation of multiple intermediates of the pentose phosphate, glucosamine and glucuronic acid pathways. The numeric values under the coloured boxes represent the fold-change (FC) differences in metabolite levels or glycogen content between affected (A) and unaffected (U) tissues (A / U). The tick arrows represent the potentially most active biochemical reactions and pathways. From Abasht et al., Reference ABASHT, MUTRYN, MICHALEK and LEE2016.

More recently Lilburn et al. (Reference LILBURN, GRIFFIN and WICK2018) discussed the challenges of oxidative stress in the development of fast-growing birds, hypothesising that the extensive accretion of breast muscle in a poorly vascularised and lightly bound P. major muscle creates the conditions for developing WS and WB anomalies in heavy, high yielding birds. Another study looked at proteomic profile differences of muscle tissues with normal or severe cases of WS and WB, and illustrated that proteins associated with glycolysis were different in normal and fillets showing severe cases of WS and WB (Kuttappan et al., Reference KUTTAPPAN, BOTTJE, RAMNATHAN, HARTSON, COON, KONG, OWENS, VAZQUEZ-AÑON and HARGIS2017). These authors identified over 800 proteins in the muscle samples, among which 141 demonstrated differential (P<0.05) expression between normal and severe myopathy cases. The set of differentially expressed proteins was examined to determine the associated biological networks and pathways. Up-regulation of these pathways indicated an increase in protein synthesis, which could be due to rapid growth as well as cellular stress associated with ongoing muscle degeneration, and the attempt to repair tissue damage in severe cases. It was revealed that glycolysis and gluconeogenesis were the major down-regulated (P<0.05) canonical pathways in severe cases, with respect to normal muscle. The authors noted that down-regulation of these pathways could be the reason for higher ultimate pH seen in severely affected muscle samples, indicating reduced glycolytic potential.
Clark et al. (Reference CLARK, WALTER and VELLEMAN2017) examined the impact of incubation temperature and time of hatch on broiler muscle growth and morphology. The authors examined adult myogenic stem cells (satellite cells) that initially develop in late-term embryos, and are the only myogenic cells that repair damaged myofibers and increase post-hatch muscle growth. In their experiment, eggs were incubated at 37.8°C; however, from day 14 to 18, some eggs were subject to 39.5°C for 0, 3, or 12 h per day. Growth and feed efficiency were measured throughout the 63-day growing trial. The 12 h incubation treatment reduced the number of broilers with moderate to severe myopathic attributes compared to the control. Similarly, there were fewer late hatch birds (505 h) with fibrotic and necrotic P. major muscles compared to the early hatch group (492 h). These data demonstrated that altering incubation temperature can be a feasible management strategy to reduce muscle myopathies without negatively impacting meat quality parameters.
Detection methods
It is important to be able to detect WS, WB and SM myopathies in the processing plant. Currently various companies are developing equipment to handle large volumes (i.e. >100 fillets per min). This should assist the industry which is dealing with line speeds of up to 13-15,000 broilers per hour (Barbut, Reference BARBUT2015), and where a significant number of the broilers are deboned. Currently, a number of plants are using manual inspection (e.g. people observing and touching the fillets removed manually or by an automated deboning machine). This obviously adds cost to the operation, therefore, finding a good semi/fully automated inspection system is important to the industry. To date, the main methods suggested or employed include visual inspection (for WS, and to a lesser extent for WB), manual by palpation/touching (for WB), near infrared spectroscopy, impedance and image analysis. Manual palpitation can be used on live birds (at the farm level) to identify birds prone to developing the WB syndrome. Sihvo et al. (Reference SIHVO, LINDÉN, AIRAS, IMMONEN, VALAJA and PUOLANNE2017) reported that they could detect the problem in 18 d old broiler chickens where, in their specific experiment, 28% of the birds showed muscle hardness at this age. The numbers increased to 48, 85, and 86% on d 24, 35, and 42, respectively. They showed correlations between the numbers and histological examinations which included looking at the degree of myodegeneration and vascular lesions. In another report Kawasaki et al. (Reference KAWASAKI, IWASAKI, YAMADA, YOSHIDA and WATANABE2018) indicated that WB could be detected on the farm by palpation in 18 d old broilers. They followed these birds up to 55 d of age, and showed that plasma creatine kinase and L-aspartate aminotransferase were higher than in unaffected birds.
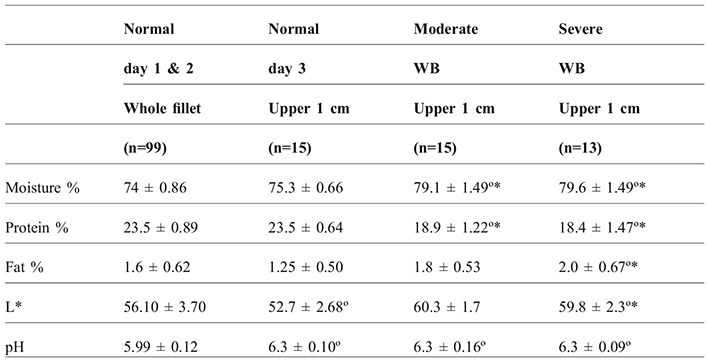
Using near infrared (NIR) to sort the meat has been described by Wold et al. (Reference WOLD, VEISETH-KENT, HØST and LØVLAND2017). Detection is based on the fact that WB meat has lower protein and higher moisture content (Table 6).
Chemical composition, colour and pH in Normal and WBS breast muscles. From Wold et al., Reference WOLD, VEISETH-KENT, HØST and LØVLAND2017.

Average value ± standard deviation.
*indicates significant different from group mean value of normal fillets day 3.
ºindicates significant different from group mean value of normal fillets day 1 & 2.
The equipment, originally developed to determine feed composition, has been adapted to determine incidences of WB in industrial settings running large batches of fillets. Examples of incidences are shown (Figure 10) for three broiler flocks where 9,063, 6,330 and 10,483 fillets were evaluated. Woody breast prevalence of 0.1%, 6.6% and 8.5% were estimated for these large flocks. The authors indicated that such an on-line system can be used to automatically sort chicken fillets, at a rate of a few hundred per min, to different product categories. The equipment is currently being used in a number of plants; however, fine tuning is still being worked on. Another European company is working on a similar concept, and it is reported that they also incorporate other parameters (e.g. calcium level which is known to be different in WB samples) to refine the sorting. The goal is to have equipment with the lowest possible false positive or negative samples, as this directly affects efficiency and cost in any high-volume operation.
NIR estimated protein in chicken fillets - a) Cross validated predicted versus measured protein in normal chicken fillets. b) Estimated protein in samples from day 3. Normal (blue), moderate WB (green) and severe WB (red). c) Estimated protein in test samples. Normal (blue), moderate WB (green), severe WB (red). The dashed red line at 21.9% indicates the decision line between normal and WB. From Wold et al., Reference WOLD, VEISETH-KENT, HØST and LØVLAND2017.

Another potential useful way of monitoring via impedance is based on measuring the electrical resistance of WB samples. A small commercial device called the Certified Quality Reader is now available (www.wattagnet.com/directories/290-agriculture-products/listing/33751-cq-foods-certified-quality-reader) after being developed with Auburn University in the USA. It is important to note that this is a contact-type device that requires insertion of the probe(s) into the meat, therefore measuring time is relatively longer.
Using image analysis of broiler breast muscles has been recently reported as a potential way to identify WB problems on the production line (US Patent 62/2018/0360054 A1. Filed in December 2018). The idea, in this case, is that fillets affected by WB have a unique ridge, resulting from the higher connective tissue and fat content, which can be detected by a non-contact method. Overall, non-contact high speed methods are preferred over contact methods (e.g., palpation, impedance) in order to work at high speed as well as to minimise cross contamination.
Potential solutions
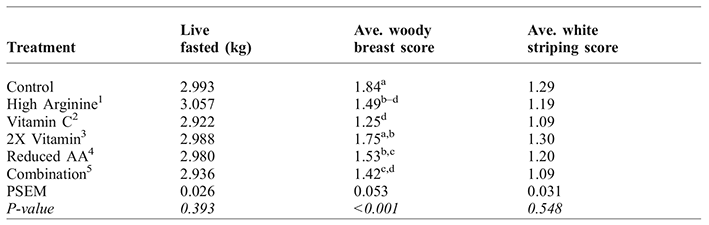
Currently the industry employs different approaches, that range from working on the nutrition (e.g. controlling growth rate) to genetics (i.e. breeding companies) and modifying environmental factors. At the meat processing plant level, the industry is looking at detection/sorting methods, as well as ways to utilise the affected meat with minimal impact on processing efficiency. Bodle et al. (Reference BODLE, ALVARADO, SHIRLEY, MERCIER and LEE2018) evaluated different dietary alterations and their ability to mitigate WS and WB syndromes in high-yielding commercial male broilers. Their test diets included a commercial reference diet (Trt 1) that was compared to increasing the ratio of digestible arginine to digestible lysine (dArg:dLys ranging from 113 to 126; Trt 2); supplementing Trt 1 with 94.4 mg vitamin C/kg feed (Trt 3); doubling the vitamin premix inclusion rate (Trt 4); reducing the digestible amino acid density (dAA) in the grower phase by 15% and feeding the same Trt 1 starter, finisher, and withdraw diets (Trt 5); and combining all four strategies (Trt 6). Overall, there was no difference in performance at the end of the starter phase; however, at the end of the grower and finisher phases, feeding lower dAA grower diets suppressed body weight and increased feed conversion (Table 7). The WB score dropped from 1.83 in Trt 1 to 1.49, 1.27, 1.74, 1.53, and 1.43 in treatments 2 to 6, respectively. These changes were the result of a shift in WB score, where the WB scores of 2 and 3 shifted from 61.3% in Trt 1 to 49.3, 35.9, 60.0, 50.8, and 38.7% in treatments 2 to 6, respectively. Given the feed conversion ratio, breast weight data and the fact that high WB scores resulted in a devaluation of breast meat, feeding a higher ratio of dArg: dLys, higher vitamin C, or lower dAA in the grower phase resulted in better breast meat quality and value.
Processing weights and meat quality measurements of male broilers fed diets with a higher ratio of dArg:dLys, vitamin premix, vitamin C, and/or a lower digestible amino acid ratio. From Bodle et al., Reference BODLE, ALVARADO, SHIRLEY, MERCIER and LEE2018.

a–cMeans in columns with different groupings differ significantly at P ≤ 0.05.
1Increasing the dig Arg:dig Lys ratio from 112 to 1.20 in the starter, 114 to 126 in the grower, 115 to 126 in the finisher, and 114 to 126 in the withdraw phase.
2The level of dietary vitamin C was 94.38 ppm.
3An increase in the vitamin premix concentration (2X).
4Digestible amino acid content of the grower diet (day 13 to 24) reduced by 15% compared to control.
5A Combination - birds fed the starter, finisher, and withdraw from treatment 1, and grower from treatment 5; however, all were supplemented with dietary arginine, vitamin C, and 2x vitamin premix.
Other researchers, such as Abasht et al. (Reference ABASHT, MUTRYN, MICHALEK and LEE2016), have recommended using nutrition to help decrease the rate of WB and suggested vitamin C supplementation to enhance antioxidative metabolism. The beneficial effect of reducing amino acid density in the grower phase (Bodle et al., Reference BODLE, ALVARADO, SHIRLEY, MERCIER and LEE2018) was believed to be due to maximising satellite cell development to allow breast muscle to recover during rapid growth in the starter phase, as previously described by Powell et al. (Reference POWELL, MCFARLAND, COWIESON, MUIR and VELLEMAN2014).
One of the challenges with the concept of reducing growth rate (i.e. restricting feed or selecting slow growing breeds) is the need to find alternative ways to supply the growing meat demand. A study released by the National Chicken Council (2017) mentioned that, if only one-third of USA broiler chicken producers switched to a slower growing breed, nearly 1.5 billion more birds would be needed annually to supply the amount of meat currently required. This will increase the amount of feed needed, enough to fill 670,000 additional tractor trailers on the road every year, using millions more gallons of fuel. The additional land needed to grow the feed (corn and soybeans) would be 7.6 million acres/year, or roughly the size of the state of Maryland. Slower growing chickens stay on the farm longer, producing 28.5 billion additional pounds of manure annually, and would require 5.1 billion additional gallons of water per year for the chickens to drink (excluding additional irrigation water to grow the extra feed).
When it comes to meat processing, plants that receive the meat can sort it and, if needed, divert it to a different stream for e.g. further processing. A number of companies are currently employing visual inspection during packaging of skinless chicken breast fillets and separating mild or severe WS fillets. This is done because customers are highly sensitive when they see one extreme WS fillet placed beside a fillet with no striping at all (Kuttappan et al., Reference KUTTAPPAN, LEE, ERF, MEULLENET, MCKEE and OWENS2012). This has been previously reported for so-called pale, soft and exudative meat (Fletcher, Reference FLETCHER1999). When it comes to the WB syndrome it is better not to package severe cases in fresh meat trays but rather use the meat in products with are further processed.
WS and WB fillets can result in higher cooking loss because of the replacement of functional myofibrillar proteins with connective tissue and fat (Table 2), and this is the reason some processors sort the meat. Alternative meat uses include cut, minced and formed products, such as chicken nuggets, patties, and emulsion type sausages. In such products the meat is ground and so hardness is not an issue as the extra collagen and fat are diluted within the larger meat batter. It has been reported that some processing plants discard severe cases of WB. However, an interesting observation is that hardness of the WB fillets decreases over time (Figure 11a) and cumulative drip loss has a different pattern from normal meat (Figure 11b). This has important implications to the meat industry where proteolytic enzyme activity is breaking or softening the meat texture over time, and may reduce the visible ridge seen in fresh WB meat.
Compression force of normal (open circles; n = 42), mild (open triangles; n = 39), and moderate/severe (open squares; n = 40) WB fillet stored for 8 days at 4°C. Storage time and category were significant (P<0.05). Redrawn from Sun et al., Reference SUN, KOLTES, COON, CHEN and OWENS2018.

Cumulative drip loss of normal (open circles; n = 42), mild (open triangles; n = 39), and moderate/severe (open squares; n = 40) WB fillet stored for 8 days at 4°C. Differences in superscript indicate differences between groups (P<0.05). Redrawn from Sun et al., Reference SUN, KOLTES, COON, CHEN and OWENS2018.

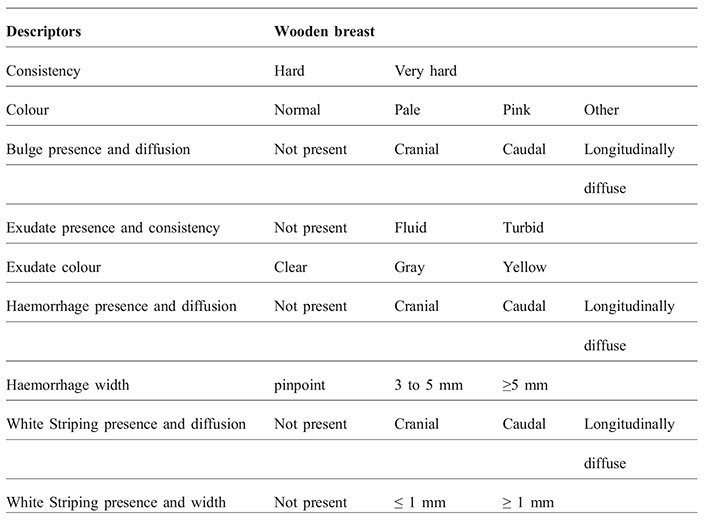
Evaluation and grading of the severity of WS and WB myopathies is important to the industry. Figure 12 shows the scale that has been used for WS in numerous research studies (e.g. Kuttappan et al., Reference KUTTAPPAN, HARGIS and OWENS2016) and which is currently used by the industry. When it comes to the evaluation of WB, a 0-3 scale based on hardness, when palpating the meat, has been developed (Tijare et al., Reference TIJARE, YANG, KUTTAPPAN, ALVARADO, COON and OWENS2016; Bodle et al., Reference BODLE, ALVARADO, SHIRLEY, MERCIER and LEE2018). A score of 0 represents a normal, non-affected breast fillet; 1 represents a mild hardness located within the cranial region; 2 represents hardness that extends from the cranial region into the caudal region with limited or no flexibility and 3 represents the highest degree of severity, with hardness extending from the cranial region into the caudal region, with no flexibility and an outer bulge or ridge. Tasoniero et al. (Reference TASONIERO, CULLERE, CECCHINATO, PUOLANNE and DALLE ZOTTE2016; Reference TASONIERO, BERTRAM, YOUNG, DALLE ZOTTE and PUOLANNE2017) have suggested the criteria described in Table 8.
More recently, Dalgaard et al. (Reference DALGAARD, RASMUSSEN, BERTRAM, JENSEN, MØLLER, AASLYNG, HEJBØL, PEDERSEN, ELSSER-GRAVESEN and YOUNG2018) introduced foam dummies that resembled the three categories of WB. These can be easily used by people sorting meat on the processing line. Overall, it is useful to employ a simple measuring scale to grade the meat and document the proportion and severity of these myopathies in different flocks, so incidence can be monitored.
Recently the Food Safety and Inspection Service (USDA-FSIS) reissued its disposition instructions for the poultry meat quality issues including WB and WS (USDA-FSIS, 2018). The notice included a detailed list of background information, responsibilities for how public health veterinarians, inspectors-in-charge, front line supervisors, and supervisory consumer safety inspectors ought to work with inspection programme personnel to identify and verify that poultry processors are removing trimmable inflammatory tissues that may be associated with these conditions. It included images and descriptions of these conditions to aid in their identification. One of the paragraphs states that “Signs of inflammation associated with woody breast and white striping include: swollen breast tissues; scattered, small blood spots or patches on the surface of muscles, particularly near the top or shoulder end of the breast fillet; and thick, often blood-stained fluid and signs of muscle deterioration”. The FSIS notice mentioned that “inflammatory tissues must be trimmed owing to their being unfit for human consumption, whereas tissues not exhibiting active inflammatory signs, i.e. white striping only, are considered safe and do not necessarily need to be removed”.
As indicated, the presence of WS, WB or SM by itself has not been associated with a single disease condition (e.g. bacterial infection) that poses health concerns (Bodle et al., Reference BODLE, ALVARADO, SHIRLEY, MERCIER and LEE2018). Overall, the new FSIS instructions seem to address some public concerns over these myopathy issues, focusing on “removing inflammatory tissues” and “blood-stained fluid and signs of muscle deterioration”. It will be interesting to see how this issue will be dealt with in the future.
Scheme used to evaluate Pectoralis major muscles. From Tasoniero et al., Reference TASONIERO, CULLERE, CECCHINATO, PUOLANNE and DALLE ZOTTE2016.

Visual scoring scale for WS in broiler breast fillets where score 0 = normal – No distinct white lines. Score 1 = moderate – Small white lines, generally <1 mm thick, but apparently visible on the fillet surface. Score 2 = severe – Large white lines (1 - 2 mm thick) very visible on the fillet surface. Score 3 = extreme – Thick white bands (>2 mm thickness) covering almost entire surface of fillet. From Bailey et al., Reference BAILEY, WATSON, BILGILI and AVENDANO2015.
Looking to the future
As discussed, there are various factors affecting the rate of WB, WS and SM in commercial broiler flocks. In the short term, growers are already engaged in activities such as diet modification (e.g. adjusting protein content), management (e.g. lighting, ventilation, stocking density), and, to some extent, genetics (e.g. selecting breeds known for slower growth rate; lines less susceptible to these myopathies). Long term solutions are focussed more on selecting bird lines which show less of these problems, and learning more about the interactions between environmental factors and myopathies. In terms of genetic selection, Bailey et al. (Reference BAILEY, WATSON, BILGILI and AVENDANO2015), mentioned that a certain proportion of birds show high genetic potential for BW and below average for WB syndrome (see Figure 8). In 2018 the same group indicated (private communication) that they assumed that genetic factors explained about 20% of the incidences of WB, while management factors comprised the rest. They indicated that selection work started in 2012 and included capturing data on sibs of pedigree birds in processing plants. This was done together with developing WB predictors in live birds (e.g. firmness by palpation) and, later excluding birds showing signs of WB from breeding programmes. Overall, they predicted a 10% per year reduction in WB; i.e. by lowering genetic propensity. This can be translated as 2% in a flock currently showing 20% WB. They did reiterate that incidences in the field will depend on interactions with management practices.
Conclusions
Incidences of WS, WB and SM in young broilers have been observed worldwide and more so during the past decade. These three myopathies can appear together or individually, but it seems that they are all related. Several research groups have attempted to define the etiology of these myopathies (e.g. genetics, nutrition, metabolism, environmental) but no one study has unequivocally determined the cause (Bodle et al., Reference BODLE, ALVARADO, SHIRLEY, MERCIER and LEE2018; Lilburn et al., Reference LILBURN, GRIFFIN and WICK2018; Petracci et al., Reference PETRACCI, SOGLIA, MADRUGA, CARVALHO, IDA and ESTÉVEZ2019). When meat is processed, these myopathies represent quality issues, but not necessarily a food safety issue. The level and degree of problem appears to be flock dependent and related to factors such as nutrition (e.g. lysine level during the fast-growing phase; Table 7), genetics, growth rate (some studies indicate >120 g/day), bird activity, number of stem cells and management factors. Overall, the industry has seen some reduction in the level of these myopathies when it has applied current knowledge regarding environmental and nutritional factors. New genetics and breeding programmes are already showing some promise and are expected to deliver less susceptible birds that, together with management and environmental adjustments, will hopefully help to overcome these problems.