Introduction
Zebrafish is the most used species in embryo cryopreservation research in the world (GODOY et al., Reference Godoy, Zampolla, Streit, Bos-Mikich and Zhang2012). This small fish, with sexual dimorphism and split spawning, is easy to breed, reaching sexual maturity at approximately 23 mm (Dammski et al., Reference Dammski, Muller, Gaya and Regonato2011).
The fish embryos exhibit some characteristics that hamper their freezing and/or vitrification. They have characteristically large egg yolk, low surface/volume ratio, large cells. Each embryo compartment has possibly different osmotic properties, semi-permeable membranes surrounding the embryo and high sensitivity at low temperatures (Rall, Reference Rall, Cloud and Thorgaard1993; Rawson & Zhang, Reference Rawson and Zhang2005; Ninhaus-Silveira et al., Reference Ninhaus-Silveira, Foresti and Azevedo2008). Currently, the cooling technique has given the best results for these embryos as there is no formation of ice crystals in the cells because temperature is not critical (Ahammad et al., Reference Ahammad, Bhattacharyya and Jana2003).
There are several applications for cooling fish embryos, among these, optimizing incubator use, transporting embryos to distant places, rescuing spawnings from pollutant threats, minimizing asynchronous maturation of gametes, improving knowledge on embryo resistance to cold, and providing a basis for freezing studies (Miliorini et al., Reference Miliorini, Murgas, Viveiros, Franciscatto, Silva and Maria2002, Fornari et al., Reference Fornari, Ribeiro, Streit, Vargas, Godoy, Oliveira, Digmayer, Galo and Neves2012).
Hatching and survival rates normally are the only indicators used to evaluate the success of the cooling technique of fish embryos (Desai et al., Reference Desai, Spikings and Zhang2011). Furthermore, it is known that low temperatures affect larvae somehow, but there are few studies showing data on possible anomalies or proving that cryopreserved larvae can develop up to the sexual maturation phase (Paes et al., Reference Paes, Silva, Nascimento, Valentin, Senhorini and Nakaghi2014).
Therefore, this study aims at monitoring the development of Danio rerio embryos, submitted to cooling, and reaching full length for sexually mature fish, by analysing hatching, growth and possible structural and ultrastructural damage caused by this process, to improve existing cryopreservation protocols, alleviate problems and provide basic knowledge for future studies.
Materials and methods
Danio rerio embryos from the spawnings of approximately 60 adult couples were kept in three 100 litre aquariums (20 couples in each aquarium) at controlled ± 28°C temperature with 12 h photoperiod (light/dark). Breeders were fed three times daily with commercial TetraMin® flakes and freshly hatched Artemia. Bottles containing stones for fishkeeping were added to the aquariums as spawning substrate. Every morning, the substrates with the embryos were removed to examine and collect the embryos.
Ten spawnings, each pooling approximately 400 embryos in the 50% epiboly phase, were used for each cooling treatment and control (no cooling). These embryos were packed in vacutainer tubes containing a cryoprotectant solution consisting of 1 M methanol + 0.1 M sucrose, cooled gradually to reach 0 ± 2°C and stored in a refrigerator for 6-h or 18-h periods.
After the proposed times, the tubes were placed in a water bath at room temperature for 15 min. The embryos were rehydrated as follows: 10 min in 90% cryoprotectant solution + 10% incubation water (IW); 10 min in 70% cryoprotectant solution + 30% IW, 10 min in 40% cryoprotectant solution + 60% IW, and 10 min in 15% cryoprotectant solution + 85% IW. Finally, the embryos were washed three times with IW only and transferred to experimental incubators with continuous aeration at ± 28°C to follow development.
Hatching and deformities
Hatching and deformity rates were determined for all spawnings after at least 80% of the larvae had already ruptured the chorion over the 5-month period of the experiment. Larvae that presented any type of anomaly were considered deformed.
The rates were calculated with in vivo larvae using a stereomicroscope, as follows:
hatching rate (%): (hatched larvae ÷ total number of embryos that were cryopreserved) × 100
deformity rate (%): (deformed larvae ÷ number of hatched larvae) × 100.
Sampling, growth, and stereomicroscopy
The larvae from the two treatments and control were kept under the ideal breeding condtions for the species. After opening of the mouth (approximately 3 to 5 post-hatching days), they were fed newly hatched Artemia nauplii, and from 8 post-hatching days, besides the A. nauplii, commercial TetraMin® flakes were offered two to three times daily. The ontogenetic development was followed until the individuals reached approximately 23 mm at the following times hatching, 2°, 3°, 4°, 5°, 6°, 7°, 10°, 13°, 16°, 20°, 24°, 28°, 35°, 45°, 65° post-hatching days (PHD).
Total length was determined on 10 larvae from each sampling time. The larvae were anesthetized with benzocaine and photomicrographed using a LEICA MZ8 stereomicroscope, coupled to the LEICA DFC 295 digital camera and measured using the LAS image analyser V 5.8 software. From the 20° PHD, the measurements were taken by a digital pachymeter.
Light microscopy
The samples were processed following two histological inclusion techniques with different stains. For all techniques, three larvae from each sampling time were preserved in Karnovsky solution (2.5% glutaraldehyde + 2.5% paraformaldehyde) for 24 h and washed in 0.1 M phosphate buffer, pH 7.4. The next sections describe the steps that followed:
Historesin
The samples were dehydrated in 80% alcohol solution for 24 h, followed by two washings in 90% and 100% alcohol for 30 min. The Leica® historesin kit was used according to the instructions: pre-infiltration in glycolmethacrylate (GMA) + ethanol (1: 1) for 4 h; the infiltration stage (GMA) for 16 h, followed by inclusion in GMA + hardener, with larvae positioned in a lateral decubitus position. The samples were incubated for resin polymerization at 60°C for 24 h. The 2-μm histological sections were prepared using glass blades.
The assembled slides were stained with hematoxylin–floxin (Tolosa et al., Reference Tolosa, Rodrigues, Behmer and Freitas-Neto2003), microphotographed using the Leica DM 2500 photomicroscope coupled to the LEICA DFC 295 digital camera and analysed using the LAS image analyser V 5.8 software.
Paraplast
The samples were kept in each of the dehydration solutions (80, 90, 95 and 100% alcohol) for 5 min, followed by diaphanization (three baths in xylol) and the paraplast (Merck) infiltration steps for 20 min and inclusion. The head and tail of the larger animals were previously removed while keeping the celoma cavity intact as ossification hampers microtome processing and cutting. The fish were included in the lateral decubitus position. The 5-μm thick histological sections were assembled in slides, stained with haematoxylin–eosin (TOLOSA et al., Reference Tolosa, Rodrigues, Behmer and Freitas-Neto2003), photomicrographed in the Leica DM 2500 photomicroscope coupled to the LEICA DFC 295 digital camera and analysed by the LAS image analyser V 5.8 software.
Transmission electron microscopy (TEM)
The samples were submerged in 2% osmium tetroxide buffer for 2 h, followed by dehydration in increasing ethanol concentrations (30, 50, 70, 80, 90, 95 and 100%). Infiltration was performed with resin and acetone and the inclusion, in resin. Semi-thin 0.5-μm sections were prepared using a glass blade microtome, and the slides were stained with 1% toluidine blue in saturated boric acid. The best cuts were used for histological analysis while also choosing the areas of interest for the ultrathin 60-nm sections that were prepared using a diamond blade, stained, observed and electromicrographed in a JEO-JEM 100CX II transmission electron microscope (TEM).
Water quality
The experimental broodstock aquariums and larval incubators were cleaned daily to maintain the ideal environmental conditions for the normal development of broods and embryos/larvae. The following physical–chemical characteristics of the water were recorded: temperature and dissolved oxygen (mg/l), by YSI 550 A equipment, pH, by YSI 63 equipment and ammonia (μg/l) by Goltermann et al. (Reference Goltermann, Clymo and Ohnstad1978) method.
Results
Hatching, deformity and growth rates
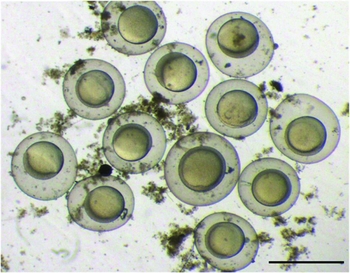
Zebrafish reproduction is induced by the brightness of the morning sun and occurs in steps while a Danio rerio adult female can spawn several times within a month. Spawning was estimated to have occurred between 5 and 6 o'clock in the morning. In the control group, hatching started between 50 and 55 h after the estimated fertilization time for all spawnings, at 28 ± 1°C average temperature. However, the cryopreserved groups took about 5 to 20 h longer than the control to initiate hatching. It is noteworthy that development between spawnings from different couples, even for embryos selected at exactly the same stage, was not simultaneous. Egg diameter varied considerably (Fig. 1), ranging from 0.522 to 0.805 mm. Sampling for microscopic processing started with the first larvae that hatched, but the hatching rate was calculated after at least 80% of the larvae were already chorion free and had a clear heartbeat (day 2 post-hatching). It is important to define when the hatch rate was calculated in cryopreservation studies, as this is a slow process, and we observed considerable mortality from the beginning until the end of hatching, when all larvae were already free.
Photomicrograph of different D. rerio egg sizes. (Bar represents 0.5 mm.)

During hatching, the larvae that had any anomaly were also counted. The comparison of the two treatments showed a higher hatching rate for 18 h compared with 6 h (Table 1). However, most of the larvae of the 18 h treatment had some deformity (Table 1), which compromised their survival over time.
Mean hatching and deformity values and standard deviation

a,b,c Different letters differ significantly from each other (Tukey P < 0.05).
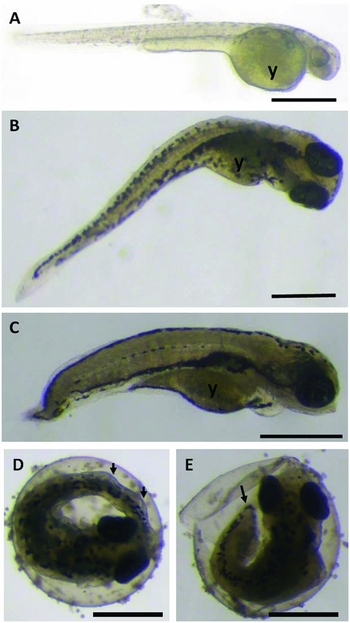
At hatching, cryopreserved larvae were longer compared with those of the control group (Table 2). This result can be explained by the tail anomalies observed in the cryopreserved larvae that rendered the rupture movements to break the chorion more difficult and, therefore, because they took a longer time to hatch (from 5 to 20 h longer, as previously mentioned), they hatched at a more developed stage (Fig. 2).
Mean total larval length (mm) and standard deviation for the control and cryopreserved groups after 18 and 6 h of storage

a,b,c Different letters differ significantly from each other (Tukey test P < 0.05).
PHD, post-hatching days.
Photomicrograph of D. rerio larvae. (A) Hatched larva from the control group. (B) Hatched larva from the cryopreserved group (6 h). (C) Hatched larva from the cryopreserved group (18 h). (D) Comparison between pre-hatched larvae from the cryopreserved and control groups, observe the curved tail (arrow) (6 h). (E) Comparison between pre-hatched larvae from the cryopreserved and control groups, observe the short tail (arrow) and broken chorion (18 h). (y: yolk sac) (Bars represent 0.5 mm).
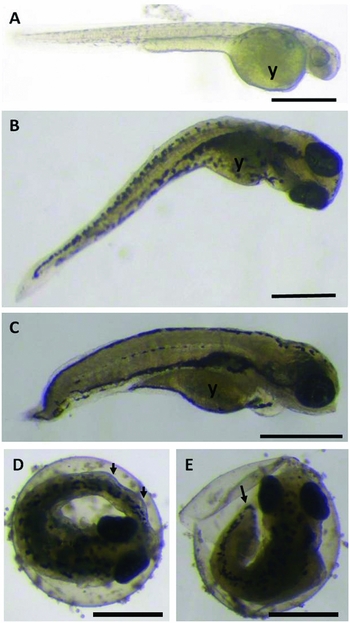
During development, 6 h larvae were generally longer than the 18 h larvae, most of which did not have a developed/formed tail (Fig. 2 C, E). However, from 16 PHD onward, the two treatments had significantly smaller animals compared with control, indicating that the cryopreservation may have affected larval length.
Stereomicroscopy
There were malformations in all groups. However, deformities were much more severe and more frequent in the group submitted to 18-h cooling. It was observed that deformed larvae had low swimming capacity, and often remaining at the bottom of the incubator.
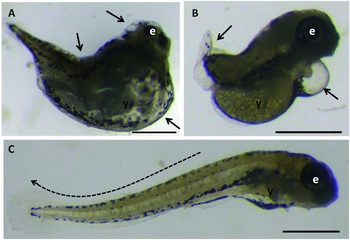
The main deformities observed in the stereomicroscope were lordosis, kyphosis, scoliosis, tail curvature, coiled tail, short or absent tail, yolk alterations, edema in the pericardial and abdominal regions, head and eye malformation (Figs 3 and 4).
Photomicrograph of D. rerio larvae. (A) Larva from the control group (3PHD). (B) Larva with curved tail (arrow) and kyphosis (6 h, 3PHD). (C) Larva with scoliosis (6 h, 3PHD). (D) Larva with coiled tail (18 h, 5PHD). (E) Larva with curved tail, edema in the abdominal region, altered yolk (arrows) and curved spine (18 h, 5PHD). (F) Larva with spinal malformation and curved tail (arrows) (18 h, 4PHD). (y: yolk sac; e: eye; *: swimming bladder) (Bars represent 0.5 mm).

Photomicrograph of D. rerio larvae. (A) Larvae with spinal malformation, altered yolk, abdominal edema, cephalic malformation and undersized eyes (arrows) (18 h, 5PHD). (B) Larvae with edema in the cardiac region and undeveloped tail (arrows) (18 h, 6PHD). (C) Larva with lordosis (dotted arrow) and small oedema in the abdominal region (6 h, 5PHD) (y: yolk; e: eye) (Bars represent 0.5 mm).

The occurrence of deformities observed in each group is shown in Table 3.
Types of deformities observed in the stereomicroscope and their respective occurrence in each treatment and control

+/−, Plus and minus signs indicate deformity presence and absence, respectively.
Light microscopy and transmission electron microscopy
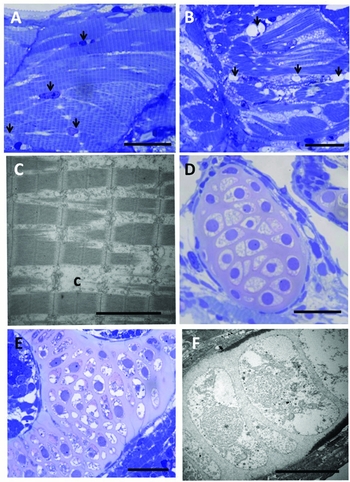
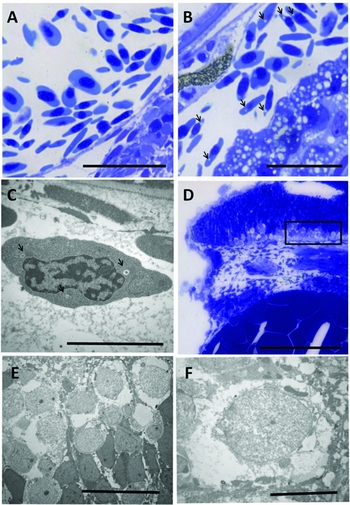
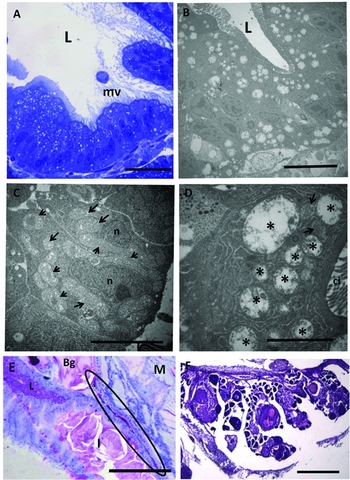
In the stereomicroscope, cell and tissue abnormalities were observed in deformed larvae of both treatments, but the deformity rate was higher for the 18-h treatment. Furthermore, the cryopreserved larvae that had no macroscopic or microscopic alterations were able to develop normally. In both treatments, notochord malformations were associated with alterations in skeletal striated muscles, such as separation of muscle fibres, atrophied musculature or shortened muscle fibres, and fibrosis (large amount of loose intramuscular connective tissue) (Fig. 5 A–C). There were also malformations in the hyaline cartilage, which had large numbers of chondrocytes presenting cell death with an irregular and fragmented nuclear membrane (Fig. 6 D–F). Regarding the gonads, the formation of a gonadal cord consisting especially of somatic cells and some primordial germ cells, the gonocytes, was observed from 2PHD, 4PHD and 6PHD onwards in the control, 6 h and 18 h treatments, respectively. This gonadal cord was located in the coelom region, above the intestine and below the dorsal musculature, in which pigmentary cells were present as dark granules, aggregated to the prolongations of the gonadal mesentery region (Fig. 7 E). The comparison of cryopreserved and control animals of the same body size showed that the latter had well formed gonads (Fig. 7 F), while in the cryopreserved the gonads were undifferentiated, with abundant connective tissue and without definite cells in the ovaries or testicles.
Photomicrograph (A, B, D, E) and transmission electron micrograph (C, F) of D. rerio larvae. (A) Skeletal striated muscle with normal appearance (arrows: peripheral nuclei of muscle fibres – control, 2PHD). (B) Skeletal striated muscle showing some vacuoles (arrows), excessive loose connective tissue between muscle fibres (*) appearing flaccid and disorganized (18 h, hatching). (C) Skeletal striated muscle with short muscle fibres and fairly loose connective tissue present (C) (6 h, 5PHD). (D) Normal-looking hyaline cartilage (control, 3PHD). (E) Hyaline cartilage with altered chondrocytes in the medium extracellular matrix (18 h, 4PHD). (F) Hyaline cartilage highlighting chondrocytes with disorganized nucleus and non-integral nuclear membrane (18 h, 4PHD) (Col: Toluidine blue) (Bars represent 20 μm).

Photomicrographs (A, B, D) and transmission electron micrographs (C, E, F) of D. rerio larvae. (A) Normal erythrocytes (control, 3PHD). (B, C) Presence of vacuoles in the erythrocyte cytoplasm (arrows) (18 h, 2PHD). (D) Head evidencing the region (square) of forming nervous tissue in which cells with degenerated cytoplasmic membrane (18 h, hatching) were found. (E, F) cytoplasmic degeneration/degenerate cytoplasmic membrane cells (18 h, hatching) (*: nucleus) (Col: Toluidine blue) (Bars: A, B: 20 μm; C, F: 10 μm; D: 50 μm; and E: 30 μm).

Photomicrographs (A, E, F) and transmission electron micrographs (B–D) of D. rerio larvae and adults. (A, B) Intestinal epithelium showing enterocytes with large amount of altered mitochondria (18 h, 4PHD). (C) Enterocytes showing mitochondria with normal appearance (arrows) (control, 3PHD). (D) Enterocyte showing mitochondria with increased cytoplasmic volume (*) and normal mitochondria (arrows) (18 h, 4PHD). (E) Formation of the gonadal cord (circle) (6 h, 6PHD). (F) Developed ovary evidencing oocytes at different maturation stages (control, 45PHD). (L: organ light, mv: microvilli, n: nucleus, L: liver, M: musculature, I: intestine, Bg: gas bladder.) (A: Toluidine blue, E: haematoxylin–floxin, F: haematoxylin–eosin.) (Bars represent: A, B – 20 µm; C – 15 µm; D 10 µm; E – 200 µm; F – 500 µm.)

Moreover, some abnormalities were observed only in the larvae of the 18 h treatment. The larvae had erythrocytes with cytoplasmic vacuolization (Fig. 6 A–C), cells of the forming nervous tissue presented degeneration of the cytoplasmic membrane (apoptosis) (Fig. 6 D–F), and a large amount of mitochondria present in intestinal epithelial cells displayed had disarranged mitochondrial ridges and abnormal increase in cytoplasmic volume (Fig. 7 A–D).
Water quality
The mean values of water quality parameters of the experimental incubators and breeding aquariums were 28 ± 1°C temperature, 7.2 pH, 48.2 μg/l ammonia, and 5.22 ± 1.9 mg/l dissolved oxygen. The parameters analysed were within the expected range for the species (Dammski et al., Reference Dammski, Muller, Gaya and Regonato2011).
Discussion
The photoperiod strongly influences zebrafish reproduction. In general, ovulation occurs shortly before dawn and spawning begins in the first hour of daylight (Dammski et al., Reference Dammski, Muller, Gaya and Regonato2011). Embryonic development of zebrafish is slow, and from fertilization, hatching can take between 48 and 72 h at approximately 28°C (Kimmel et al., Reference Kimmel, Ballard, Kimmel, Ullmann and Schilling1995; Dammski et al., Reference Dammski, Muller, Gaya and Regonato2011). In addition to genetic factors, environmental conditions and egg size may influence developmental speed (Leme dos Santos & Azoubel, Reference Leme dos Santos and Azoubel1996) and, in the present study, egg diameter varied considerably. This fact is common to several teleost species while asynchrony occurs even within the same spawning (Nakatani et al., Reference Nakatani, Agostinho and Baumgartner2001).
Currently, the cooling technique has had the best results (Ahammad et al., Reference Ahammad, Bhattacharyya and Jana2003), but damage/malformation is still common in post-cooling embryos (Neves et al., Reference Neves, Ribeiro, Streit, Natali, Fornari, Santos and Godoy2014; Digmayer, Reference Digmayer2010; Paes et al., Reference Paes, Silva, Nascimento, Valentin, Senhorini and Nakaghi2014).
Considering the time of exposure to cold, which is another important factor that should be considered in cryopreservation protocols, we chose to compare larval damage caused by 6 or 18 h of cold storage. The choice of storage times was determined based on a previous study and also the research by Desai et al. (Reference Desai, Spikings and Zhang2015). Ahammad et al. (Reference Ahammad, Bhattacharyya and Jana2003) studied the common carp (Cyprinus carpio) and reported that the survival rate tends to decrease as the storage period increases. Paes et al. (Reference Paes, Silva, Nascimento, Valentin, Senhorini and Nakaghi2014) investigated Brycon orbignyanus and demonstrated that for a storage time increase from 6 to 10 h, mean hatchability values were halved. The present study has also shown that storage period negatively influenced zebrafish size, deformity index, and long-term survival.
It is essential that fish embryos can support the temperature reduction required by the cooling process. However, as already mentioned, cold can harm cells and/or tissues due to thermal shock and rapid cooling, or even slow cooling, for which damage is commonly manifested after long periods of exposure to low temperatures (Morris & Watson, 1984 cited by Lopes et al., Reference Lopes, Strei, Ribeiro and Romagosa2014).
The 18 h treatment, despite having a higher hatching rate, also had a larger number of more severely deformed larvae, which led to a high mortality rate during development. The deformed larvae had compromised swimming ability and often remained at the bottom of the incubator. Swimming activity is one of the most important behavioural changes as it is an indicator of the internal status of the animal (Little et al., Reference Little, Fairchild and De Lonay1993). The constant muscular requirement for swimming movements may be one of the causes of deformation in the spine and tail regions (Sakamoto & Yone, 1978, cited by Nagamatsu, Reference Nagamatsu2013). Poor formation of the spine and tail, as well as of the elements that make up the skeletal structure as a whole, that is, skeletal striated musculature, cartilage, and notochord, compromise larval survival. These anomalies are directly related to body balance and orientation in the water column, affecting the ability to escape, feed predation and swimming capacity in the early stages of development (Pinder & Gozlan, Reference Pinder and Gozlan2004).
Among other deformities present in both treatments, we cite the cardiac and abdominal oedema in the larvae that were submitted to cooling. Oedema in fish larvae are commonly cited in many studies dealing with exposure to toxicants in water, environmental changes and nutrient deficiency as well (Costa, Reference Costa2015; Fernandes, Reference Fernandes2016; Stevanato, Reference Stevanato2016). Oedema formation is generally characterized by an increase in metabolism, and may be caused by increased pressure, temperature fluctuation (Stevanato, Reference Stevanato2016) and/or by subcutaneous haemorrhages, that is, blood stops circulating leading to erythrocyte accumulation (Walker & Peterson, Reference Walker and Peterson1991). In embryos, the oedemas usually occur in the abdominal, caudal regions, eyes and central nervous system (Leatherland & Woo, Reference Leatherland and Woo1998). One of the causes of cardiac oedema formation is the falling cardiac output due to myocardial failure (Coelho, Reference Coelho2014).
It was found that cryopreservation and exposure time to the cold affected the length of the animals throughout development. Elonen et al. (Reference Elonen, Spehar, Holcombe, Johnson, Fernandez, Erickson, Tietze and Cook1998) suggest that the reduction in larval length may be related to the formation of oedema, because the pressure exerted on the blood vessels impedes blood circulation, leading to decreasing nutrient absorption by the body.
Erythrocytes with a predominantly elliptical-shaped nucleus, centrally located and densely basophilic heterochromatin were observed in the larvae of all treatments and control. However, small vacuoles were observed in the cytoplasm of few larvae of the 18 h group. According to Campbell (Reference Campbell and Thrall2004), areas of the cytoplasm with vacuolated and/or pale regions may be considered common in fish erythrocytes and have been associated with the degeneration of cellular organelles.
As for the damage found only in the 18 h group, we cite the degenerating nerve tissue cells. According to Godoy et al. (Reference Godoy, Zampolla, Streit, Bos-Mikich and Zhang2012), one of the main typs of damage caused by the cooling is the homeostatic balance disorder, resulting from the different effects of the cold on the enzymatic and non-enzymatic processes inside the cells. This damage is associated with oxidative stress and lipid peroxidation, which can lead to cell degeneration/apoptosis. During the cooling period, the transitions of the lipid phase lead to a disorganization and extravasation of the cell membrane, affecting cell viability (Godoy et al., Reference Godoy, Zampolla, Streit, Bos-Mikich and Zhang2012). Other damage caused by the cold is the denaturation of proteins due to temperature variation (Lattman et al., Reference Lattman, Fiebig and Dill1994). As the structure of water molecules and hydrogen bonds become more ordered by exposure to low temperature, it is believed that the hydrophobic bonds between the side protein chains are loosened and, consequently, the conformation of the protein molecules changes resulting in denaturation (Tajima & Shimizu, 1973). Alternatively, induction by oxidative stress may lead to the production of reactive oxygen types, causing protein denaturation, lipid peroxidation and cellular apoptosis (Wood & Youle, Reference Wood and Youle1995; Prasad, Reference Prasad1996).
A large amount of mitochondria with altered volume and ridges was also observed in cells of the intestinal epithelium of larvae from the 18 h treatment. Studies in animals and plants show that the mitochondria of the cells become highly permeable and swollen after tissue samples are submitted to low temperatures (Rauen et al., Reference Rauen, Polzar, Stephan, Mannherz and De Groot1999). Cold shock can cause cells to lose intracellular K+ and become permeable to substances that otherwise would be impermeable (Godoy et al., Reference Godoy, Zampolla, Streit, Bos-Mikich and Zhang2012).
Genotype sex is established at the time of fertilization of the ovum by the spermatozoid, but the differentiation of phenotypic sex only occurs in later stages of development (De Bem, et al., Reference De Bem, Fontanetti, Senhorini and Parise-Maltempi2012). Because fish are pecilothermic, they are greatly influenced by temperature in their gonadal differentiation. There are several studies exploring temperature for sexual reversal in fish (Ferraz & Cerqueira, Reference Ferraz and Cerqueira2010; Zanardi et al., Reference Zanardi, Dias-Koberstein, Dos Santos and Malheiros2011). In addition to temperature, other environmental factors, such as dissolved oxygen and growth rates, may also influence the sex ratio in zebrafish.
The gonadal cord in D. rerio is formed at different times in the larvae from the control (2PHD), and 6 h (4PHD) and 18 h (6PHD) treatments. Zebrafish, under captivity conditions, commonly reach sexual maturity between 3–6 months post-fertilization. However, it is more appropriate to relate reproductive maturity to size than to age, as sexual maturity varies considerably with environmental conditions, including population density, temperature, and food availability. A standard size of approximately 23 mm corresponds to the reproductive maturity of this species (Dammski et al., Reference Dammski, Muller, Gaya and Regonato2011). When cryopreserved animals of the same body size were compared with control animals, the latter had well formed gonads, whereas, in cryopreserved animals, the gonads were still undifferentiated for unknown reasons.
Considering the cryopreservation of zebrafish embryos, under the conditions of this experiment, 6 h of storage was the one that presented the best performance in both growth and deformities.
Acknowledgements
The authors would like to thank the Aquaculture Centre of UNESP for providing the animals and the facilities; Mr Edmar Delega for his help in processing the histological material; Ms Maria Tereza P. Maglia, Mr José A. Maulin and University of São Paulo, USP, in Ribeirão Preto, Brazil for helping with transmission electron microscopy (TEM).
Financial support
This work was supported by the São Paulo Research Foundation – FAPESP (grant number 2012/24909-5).
Ethical standards
The authors assert that all procedures contributing to this work comply with the ethical standards of the relevant national and institutional guides on the care and use of laboratory animals.