Implications
Cattle are considered as one of the most important food-producing animals in the world. Edible tissues are used as food sources in many parts of the world. However, there is no information available about the expression pattern of different xenobiotic-metabolizing enzymes (XMEs) in these tissues. This study serves as an introductory tool to understand the tissue-specific expression of different XMEs in cattle. Thus, it may help us understand the contribution of these tissues in the xenobiotics metabolism. Subsequently, this may reflect the pre-slaughter exposure to some xenobiotics, which may be important in the evaluation of consumer risk due to the consumption of these tissues.
Introduction
The mammalian cytochrome P450 (CYP) superfamily is divided into a number of families, which in turn are divided into subfamilies, each of which consists of one or more enzymes. These enzymes metabolize a wide range of endogenous and exogenous xenobiotic compounds, resulting in either the activation or detoxification of the xenobiotics, depending on the enzyme involved (Ioannides, Reference Ioannides2006). Thus, the response of the body to physiological substrates, therapeutic drugs, carcinogens and other toxicants and pollutants can be greatly influenced by the differential expression of CYP enzymes in different tissues (Guengerich, Reference Guengerich1997).
In many species, the liver shows the highest expression of these enzymes and other phase II enzymes, but these enzymes are also expressed in extrahepatic tissues, such as the kidney, intestine, lung and tongue (Darwish et al., Reference Darwish, Morshdy, Ikenaka, Ibrahim, Fujita and Ishizuka2010). We recently reported the unique expression pattern of CYP1A1, in particular in ungulates. The high expression and the distribution of CYP1A1 mRNA in the tongue are markedly different from the CYP distribution pattern in rats or other laboratory animals (Darwish et al., Reference Darwish, Ikenaka, Eldaly, Ohno, Sakamoto, Fujita and Ishizuka2010a and Reference Darwish, Morshdy, Ikenaka, Ibrahim, Fujita and Ishizuka2010b). These results led us to investigate the distribution of CYP and xenobiotic-metabolizing enzymes (XMEs) in ungulates.
Cattle are, economically, one of the most important veterinary species worldwide. However, few studies have investigated the expression of different CYP isoforms and phase II conjugating enzymes in this species. Food-producing animals like cattle are often exposed to pesticides, pollutants and drugs, which are potentially harmful to the animal itself and also to humans if animal tissues containing high levels of harmful residues are consumed (Giantin et al., Reference Giantin, Carletti, Capolongo, Pegolo, Lopparelli, Gusson, Nebbia, Cantiello, Martin, Pineau and Dacasto2008). Consequently, drug metabolism studies performed on these animals are important for the evaluation of consumer risk. Despite these obvious toxicological implications, our understanding of CYP and phase II conjugating systems in the liver and other tissues of cattle is limited (Nebbia et al., Reference Nebbia, Dacasto, Rossetto Giaccherino, Giuliano Albo and Carletti2003). The most common approach to defining CYP composition in the hepatic and extra-hepatic tissues of animals is to use diagnostic probes and antibodies which are raised to individual CYP proteins. Most studies have used rats and humans as the reference species, simply because they have been extensively studied and antibodies are commercially available. However, extrapolation of data obtained using rat or human probes or antibodies with the tissues of food-producing animals, such as cattle, remains a difficult task because of the well-established species differences in the activity, expression and regulation of CYP proteins and phase II conjugating enzymes (Ioannides, Reference Ioannides2006). In contrast, bovine-specific primer pairs were designed for P450s and phase II enzyme isoform mRNA to be used in the relative quantification by means of quantitative real-time polymerase chain reaction (qPCR). In fact, the entire bovine genome has been recently sequenced, but a definitive nomenclature for bovine P450s as well as phase II enzymes is still lacking. For this reason, in this study, bovine drug-metabolizing enzyme sequences were identified with the name of the human sequence sharing the highest percentage of identity, based on protein sequence alignments, followed by the suffix ‘like’.
Thus, the objective of this study was to investigate the expression pattern of various forms of CYP, UDP glucuronsyl transferase (UGT) and glutathione-S-transferase (GST) in cattle tissues using the qPCR method. This may be a useful tool to help us understand the contributions of the extra-hepatic tissues in the xenobiotics metabolism. It may also reflect the pre-slaughter exposure to some xenobiotics, which subsequently has a direct impact on consumer risk evaluation.
Material and methods
Chemicals and reagents
All of the test reagents used were of reagent grade, including those described below. TRI reagent was purchased from Sigma Chemical Co. (St. Louis, MO, USA). Oligo(dT) primer, reverse transcriptase (RT)-buffer and ReverTra Ace were purchased from TOYOBO (Osaka, Japan). Primer sets were purchased from Invitrogen (Carlsbad, CA, USA). Ex Taq Polymerase was purchased from TaKaRa (Tokyo, Japan). All other reagents were of analytical grade or the highest quality available and purchased from Wako Pure Chemical Industries (Tokyo, Japan).
Animals
All experiments using animals were performed according to the guidelines of the Hokkaido University Institutional Animal Care and Use Committee. Samples from the liver, mammary gland, lungs, spleen, kidney cortex, heart, masseter muscle and tongue were collected from five adult female Holstein cattle (Bos taurus) from a Hokkaido University cattle farm. These cattle were aged 4 to 5 years (4.67 ± 0.58 years old) and were non-pregnant and non-lactating. The different samples were excised immediately after slaughter and transferred to liquid nitrogen tanks. They were then kept frozen at −80°C till use. These cattle had been reared on grass feed with no medical history for at least 1 month before slaughter.
RNA extraction
Total RNA was prepared from each tissue by the single-step method (Chomczynski and Sacchi, Reference Chomczynski and Sacchi1987), using TRI reagent from Sigma. The concentration and purity of the RNA fraction was determined spectrophotometrically at 260 and 280 nm, respectively.
cDNA synthesis
cDNA was synthesized as follows: a mixture containing 5 μg total RNA and 0.5 ng oligo dT primer was incubated in a total volume of 24 μl sterilized ultrapure water at 70°C for 10 min. This mixture was then removed from the thermal cycler and made up to 40 μl with 4 μl of (5×) RT-buffer, 8 μl of 10 mM dNTP, 2 μl of DEPC (diethylpyrocarbonate) water and 2 μl of RT-ReverTra Ace. The mixture was then reincubated in the thermal cycler at 30°C for 10 min, 42°C for 1 h and 90°C for 10 min to prepare the cDNA.
Quantitative real-time polymerase chain reaction
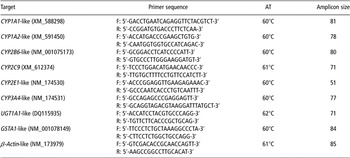
qPCR was performed to analyze the mRNA levels of cattle CYP1A1, 1A2, 2B6, 2C9, 2E1, 3A4, UGT1A1, GSTA1 and β-actin, which was used as an endogenous control as it was equally expressed in all examined tissues, using the Step One Plus Real-Time PCR system (Applied Biosystems, Foster, CA, USA) and the DyNAmo HS SYBR Green qPCR kit (Finnzymes Oy, Keilaranta, Finland), according to the manufacturer’s instructions. The primer sets used have been described previously (Giantin et al., Reference Giantin, Carletti, Capolongo, Pegolo, Lopparelli, Gusson, Nebbia, Cantiello, Martin, Pineau and Dacasto2008), and are shown in Table 1. The PCR reaction mixture was prepared with 1× Master Mix reagents (Finnzymes Oy, Keilaranta, Finland), 300 nM of each primer, 500 ng cDNA and 1× ROX reference dye in 1 μl of RNase-free water. The mixture was made up to a final volume of 20 μl with RNase-free water. The reaction cycle comprised an initial holding stage at 95°C for 15 min, followed by 40 cycles of denaturation at 95°C, annealing at an appropriate temperature (as described in Table 1) for 1 min and extension at 72°C for 30 s. Melting curve analysis and agarose gel electrophoresis confirmed the amplification of a single amplicon of the expected size as well as the absence of primer dimers and genomic DNA amplification. Each measurement was performed in duplicate and repeated three times. The expression of each gene was normalized to the expression of β-actin and was calculated relative to the corresponding gene expression in the liver for each animal individually. The tissue distribution of mRNA expression of each gene was expressed as the mean ± s.d. of five animals.
Primer pairs used for quantitative real-time RT-PCR amplification of each target gene

AT = annealing temperature.
Included in the table are the primer sequences, accession numbers of the genes, AT and the lengths (base pairs) of the PCR products.
Statistical analysis
Statistical significance was evaluated using the Tukey–Kramer Honestly Significant Difference test (JMP statistical package, SAS Institute Inc., Cary, NC, USA). A P-value <0.05 was considered to be significant.
Results
mRNA expression of CYPs in the different tissues of cattle
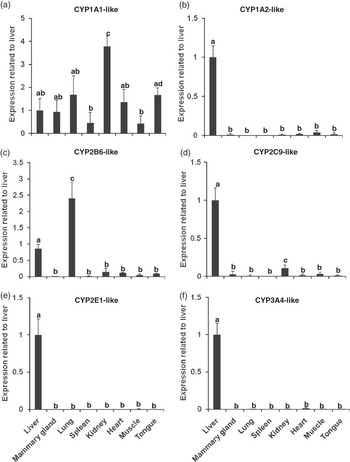
In this study, we analyzed the mRNA expression of CYPs in the different tissues of cattle. The expression of the CYP1A subfamily, which is divided into CYP1A1 and CYP1A2, was examined. CYP1A1-like mRNA was expressed in all tissues examined both hepatically and extra-hepatically. The highest expression level was recorded in the kidneys compared with the other tissues examined (Figure 1a). An intermediate higher expression of CYP1A1-like mRNA was observed in the liver, tongue, lung, heart and mammary gland (Figure 1a). The lowest CYP1A1-like mRNA was recorded in both the spleen and muscle (Figure 1a). CYP1A2-like mRNA was expressed mainly in the liver, while the other examined tissues showed very small expression pattern compared with the liver (Figure 1b).
Expression of different cytochrome P450 (CYP) isoforms in different cattle tissues. The mRNA expression levels of different CYP isoforms in the different tissues of cattle compared with the levels in the liver using quantitative real-time RT-PCR analysis of (a) CYP1A1-like, (b) CYP1A2-like, (c) CYP2B6-like, (d) CYP2C9-like, (e) CYP2E1-like and (f) CYP3A4-like genes. PCR amplification of the cDNA samples was carried out as described in the text. Each measurement was performed in duplicate and repeated three times. The expression of each gene was normalized to the expression of β-actin and calculated relative to that of the liver of each animal individually. The value relating to expression in the liver was adjusted to 1. The tissue distribution of mRNA expression of each gene was expressed as the mean ± s.d. of five animals. Identical letters indicate no significant difference; P < 0.05.

The tissue-specific expression of the CYP2 family – like mRNAs, CYP2B6, CYP2C9 and CYP2E1 – was examined in the different tissues of cattle. CYP2B6-like mRNA was expressed in all tissues examined both hepatically and extra-hepatically. The lung and liver showed significantly higher expression than the other examined tissues (Figure 1c). CYP2C9-like mRNA was expressed mainly in the liver, followed by the kidney. Other examined tissues either did not show any expression or showed very small expression (Figure 1d). CYP2E1- and CYP3A4-like mRNAs were expressed hepatically as shown in Figures 1e and f, respectively.
mRNA expression of phase II enzymes in the different tissues of cattle
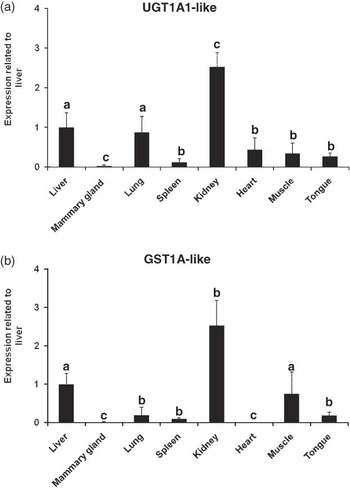
Phase II enzymes were represented by two major enzymes, UGT1A1 and GSTA1. The tissue-specific expression of UGT1A1- and GSTA1-like mRNAs was examined in all tissues compared with liver. UGT1A1-like mRNA was expressed in all tissues. The kidney showed the highest expression, followed by the liver and the lung (Figure 2a). Other examined tissues showed similar expression pattern for UGT1A1-like mRNA, but were higher than the mammary gland (Figure 2a). Similarly, GSTA1-like mRNA was expressed in all tissues of cattle. The highest expression was observed in the renal tissue, followed by the liver and muscle. Other examined tissues showed variable expression pattern as shown in Figure 2b.
Expression of different phase II enzymes in different cattle tissues. The mRNA expression levels of different phase II enzymes in the different tissues of cattle compared with the levels in the liver using quantitative real-time RT-PCR analysis of (a) UGT1A1-like and (b) GSTA1-like genes. PCR amplification of the cDNA samples was carried out as described in the text. Each measurement was performed in duplicate and repeated three times. The expression of each gene was normalized to the expression of β-actin and calculated relative to that of the liver of each animal individually. The value relating to expression in the liver was adjusted to 1. The tissue distribution of mRNA expression of each gene was expressed as the mean ± s.d. of five animals. Identical letters indicate no significant difference; P < 0.05.

Discussion
In mammals, CYP-associated expression and activity are found in all tissues, but predominantly occur in the liver in most species. In extrahepatic tissues, CYP enzymes involved in the metabolism of xenobiotics are mainly concentrated in those organs through which foreign substances pass when entering the body, such as the lung, intestine and skin (Guengerich, Reference Guengerich1997). Tissue-specific expression of CYP isoforms and phase II conjugating enzymes has been extensively studied in humans and laboratory animals, but has received little attention in food-producing animals like cattle. Moreover, the expression level of different CYP isoforms and phase II enzymes is considered as a good biomarker for pre-slaughter exposure to different xenobiotics because the concentration of these enzymes tends to increase on chemical exposure (Fujita et al., Reference Fujita, Chiba, Ishizuka, Hoshi, Iwata, Sakakibara, Tanabe, Kazusaka, Masuda, Masuda and Nakagawa2001). The use of different CYPs and phase II enzyme induction as an assessment technique has increased in recent years. This is mainly due to the optimization of protocols for the rapid and relative inexpensiveness of its expression and activity measurements (Okey, Reference Okey1990). Thus, this study was performed to investigate the mRNA expression pattern of different CYP proteins and conjugating enzymes in the different tissues of cattle.
The CYP1A subfamily comprises two isoforms, 1A1 and 1A2. It is probably the most inducible CYP subfamily, being induced by planar compounds in the liver and extrahepatic tissues of animals and humans. CYP1A1 is mainly expressed extrahepatically; its hepatic level is very low in rats and humans (Ioannides and Parke, Reference Ioannides and Parke1990). Surprisingly, CYP1A1-like mRNA is expressed in all tissues examined, including the liver. The highest expression level was recorded in the kidney of cattle; this differed from the findings reported in rats. High expression of CYP1A1 in the liver and kidneys strongly suggests that CYP1A1 is induced either by environmental pollutants, such as polycyclic aromatic hydrocarbons (PAHs), or by phytochemicals (Ioannides, Reference Ioannides1999). In line with this result, CYP1A1 protein was highly expressed in the bovine liver (Sivapathasundaram et al., Reference Sivapathasundaram, Magnisali, Coldham, Howells, Sauer and Ioannides2001). In a previous report, the cattle liver also showed higher CYP1A1-dependent ethoxyresorufin O-deethylase activity compared with the rat liver (Darwish et al., Reference Darwish, Ikenaka, Eldaly, Ohno, Sakamoto, Fujita and Ishizuka2010). Interestingly, other examined tissues, such as the lung, tongue and mammary glands, showed similar expression pattern to that observed in the liver. The high expression of CYP1A1-like mRNA in the lungs and tongue corresponds to that reported by Darwish et al. (Reference Darwish, Morshdy, Ikenaka, Ibrahim, Fujita and Ishizuka2010b), who observed higher expression for CYP1A1-like mRNA in the lungs and tongue of camel. Takiguchi et al. (Reference Takiguchi, Darwish, Ikenaka, Ohno and Ishizuka2010) also observed high CYP1A1 mRNA and protein expression in the tongue of the rat. The relatively high expression of CYP1A-like mRNA in the mammary glands may be correlated to the occurrence of a remarkable rate of aflatoxin B1 hydroxylation to aflatoxin M1 in a clonal cell line established from primary bovine mammary epithelial cells as mentioned by Caruso et al. (Reference Caruso, Mariotti, Zizzadoro, Zaghini, Ormas, Altafini and Belloli2009). Moreover, it was reported that the mRNA and protein expression of CYP1A1 and CYP1A2 were significantly induced by the cow milk-based formula in HepG2 cells (Xu et al., Reference Xu, Rajesan, Harper, Kim, Lonnerdal, Yang, Uematsu, Hutson, Watson-MacDonell and Ito2005). In addition, there was much concern about the contamination of the human breast milk with carcinogenic and mutagenic environmental pollutants, such as halogenated aromatic hydrocarbons (e.g. dioxin and polychlorinated biphenyls) and PAHs (Hooper and McDonald, Reference Hooper and McDonald2000). Although the mammary gland samples were collected from non-pregnant and non-lactating cows, the role of the residual milk or accumulated pollutants cannot be ignored in the induction of CYP1A1 in this tissue.
CYP1A2, which is involved in the metabolism of caffeine and heterocyclic amines (Ioannides, Reference Ioannides200), was expressed mainly in the liver. Unlike the results with CYP1A1, the CYP1A2 results agree with those reported in rats and humans (Ioannides, Reference Ioannides2006). The induction of CYP1A mRNAs in the different tissues of cattle is mainly mediated though the binding of xenobiotics to a cytosolic aryl hydrocarbon receptor (AhR). AhR ligands usually have esoteric configurations and may be similar in structure to 2,3,7,8-teterachlorodibenzo-ρ-dioxin (2,3,7,8-TCDD), one of the typical CYP1A inducers (Nebert et al., Reference Nebert, Puga and Vasiliou1993).
The CYP2 family is the largest mammalian CYP family, comprising a number of distinct subfamilies that markedly differ in their substrate specificity. In rats, CYP2B6 is mainly expressed hepatically (Pascussi et al., Reference Pascussi, Gerbal-Chaloin, Drocourt, Maurel and Vilarem2003). However, interestingly in cattle, CYP2B6-like mRNA is highly expressed in the lung compared with the other tissues examined. This result can be explained by the fact that this isoform participates in the bioactivation of nitrosamines and the carcinogenic mycotoxin aflatoxin B1 (Chang et al., Reference Chang, Weber, Crespi and Waxman1993). The CYP2C subfamily is composed of at least four enzymes in humans and is responsible for the metabolism of many major drugs, such as rifampicin (Ioannides, Reference Ioannides2006). CYP2C9-like mRNA was found to be expressed mainly in the liver and kidney of cattle, confirming a previous report of CYP2C9 expression in the liver of cattle (Grasso et al., Reference Grasso, Longo, Coceani and Giovanni Gervasi2005), and corresponds with that of Pegolo et al. (Reference Pegolo, Merlanti, Giantin, Dacasto, Montesissa and Capolongo2010), who demonstrated CYP2C9-like activities in the bovine liver microsomes. The CYP2E subfamily consists of a single enzyme CYP2E1, which is induced after exposure to small molecular weight xenobiotics, such as acetone and alcohol. CYP2E1-like mRNA is expressed only in the liver in cattle, similar to the expression in rats and humans (Grasso et al., Reference Grasso, Longo, Coceani and Giovanni Gervasi2005). This result corresponds with that of Szotáková et al. (Reference Szotáková, Baliharová, Lamka, Nozinová, Wsól, Velík, Machala, Neca, Soucek, Susová and Skálová2004), who observed a protein cross reacting with anti-human CYP2E1 IgG in the bovine liver. The CYP3 family is the most active contributor in drug metabolism. CYP3A4-like mRNA was expressed only in the cattle liver. Cattle liver microsomes catalyze the dealkylation of CYP3A substrates, such as erythromycin (Grasso et al., Reference Grasso, Longo, Coceani and Giovanni Gervasi2005). This result corresponds with that of Szotáková et al. (Reference Szotáková, Baliharová, Lamka, Nozinová, Wsól, Velík, Machala, Neca, Soucek, Susová and Skálová2004), who observed a protein cross reacting with anti-human CYP3A4 antibody in the bovine liver.
With regard to phase II conjugating enzymes, UGTs catalyze the conjugation of exogenous and endogenous lipophilic compounds (mainly) with glucuronic acid. UGTs comprise two families, UGT1 and UGT2. UGT1 enzymes mainly catalyze glucuronidation of exogenous agents, such as drugs, pesticides and benzo[a]pyrene (Van der Logt et al., Reference Van der Logt, Roelofs, Nagengast and Peters2003). UGT1A1-like mRNA was expressed in all tissues examined, except for the mammary glands. Many UGT1 isoenzymes have also been expressed in extrahepatic tissues, including the kidney, stomach, small intestine, colon, tongue and many other tissues in rats and mice (Buckley and Klaassen, Reference Buckley and Klaassen200; Takiguchi et al., Reference Takiguchi, Darwish, Ikenaka, Ohno and Ishizuka2010). However, surprisingly in cattle, the kidney showed the highest expression pattern for UGT1A1 compared with the expression in the liver. Unlike rats and mice, cattle were unique in the high level of expression of UGT1A1 in the lung, suggesting that glucuronidation of some inhaled pollutants or xenobiotics in transferred gas from the rumen to the lung during ructus may initiate in the lungs.
GST, similar to UGT, is a major phase II biotransformation enzyme, which conjugates hydrophilic moieties to hydrophobic substrates, thereby affecting their inactivation and clearance. To date, seven GST classes have been described in mammals. Of these, GST alpha contributes significantly to the biotransformation of promutagens and procarcinogens (Giantin et al., Reference Giantin, Carletti, Capolongo, Pegolo, Lopparelli, Gusson, Nebbia, Cantiello, Martin, Pineau and Dacasto2008). We report here that GSTA1-like mRNA was expressed in all cattle tissues examined, except for the heart and mammary glands. In line with UGT1A1-like mRNA expression, the highest GSTA1-like mRNA expression was reported in the kidney. Accordingly, the rat kidney showed higher GSTA1-dependent CDNB conjugative activity compared with the lung, brain and respiratory epithelium in previous studies (Ben-Arie et al., Reference Ben-Arie, Khen and Lancet1993). In mice liver, GSTA1 mRNA showed very low expression (Knight et al., Reference Knight, Choudhuri and Klaassen2007). In contrast to the findings in mice, the cattle liver expressed lower levels of GSTA1 mRNA than the kidney, but higher expression levels than other tissues.
The high expression pattern of phase II enzymes, UGT1A1 and GSTA1 mRNAs in the liver, lung and kidney, which also showed high expression for different CYP isoform mRNAs, suggests that phase II enzymes play a great role in producing a state of balance between the bioactivation and detoxification of xenobiotics in meat-producing animals, particularly cattle.
In conclusion, to the best of our knowledge, this is the first report to study the tissue-specific expression of various CYP isoforms, UGT1A1 and GSTA1 mRNAs in cattle. Our findings suggest that the liver, lung and kidney in cattle are the major organs contributing to xenobiotic metabolism, and thus, this may have toxicological implications for public health. Further studies are needed to correlate the pre-transcriptional and post-translational expressions of various xenobiotic-metabolizing enzymes in the different tissues of cattle. Moreover, to screen the contribution of the gastrointestinal tissues in the xenobiotics metabolism in ungulates, cattle will be of particular interest.
Acknowledgment
This study was supported in part by Grants-in-Aid for Scientific Research from the Ministry of Education, Culture, Sports, Science and Technology of Japan awarded to M. Ishizuka (no. 19671001).