


1. INTRODUCTION
Product complexity is increasing because of not only the number of components present in modern systems but also the interconnections among these components that make a system difficult to decompose in a comprehensive manner. An example of complex systems can be found in the car industry, where the market requires increasing functionalities of electrical/electronic systems in order to improve fuel efficiency, safety, and vehicle features (Price, Reference Price2000). Further complexity is due to changes in vehicle configuration, where configuration chosen by the customer can create possible unexpected interactions between vehicle systems. Price (Reference Price2000) states that “it is a major challenge to assess the safety and reliability of such systems as early as possible in the design process.” Even though conceptual design is an essential and complex task, there are few tools that can support this phase.
Qualitative reasoning (De Kleer & Bobrow, Reference De Kleer and Bobrow1984; De Kleer & Brown, Reference De Kleer and Brown1984; Forbus, Reference Forbus1984a; Kuipers, Reference Kuipers1986) is considered potentially useful in building a computational support for conceptual design. Other applications of qualitative reasoning are fault diagnosis, system simulation, process understanding and monitoring, explanation of numerical simulations, cognitive applications, compositional model-based diagnosis and state tracking, and decision making under uncertainty (Price, Travé-Massuyès, et al., Reference Price, Travé-Massuyès, Milne, Ironi, Forbus, Bredeweg, Lee, Struss, Snooke, Lucas, Cavazza and Coghill2006). Some of the reasons why qualitative reasoning has become more popular over the past 20 years include the following: first, precise and complete information is not always required; second, concept solutions do not have to be evaluated with many details before proceeding to further developments (Sandberg, Reference Sandberg2007); and third, building a model of a fairly complex system in a short time is possible. Furthermore, by using qualitative equations, it is straightforward to build a parameter network that provides information about parameter connections and dependencies among these parameters. Designers can then inspect the parameter network for taking design decisions. In industry, the majority of design projects are not really completely new designs but routine designs (or redesigns) in which the parameter network of the previous model can be reused in architecture. In such a case, a typical design change is an increase or decrease of one parameter (e.g., the speed must be 10% faster) that has a natural fit with qualitative reasoning with a parameter network. Therefore, the parameter network helps designers in change management and customization of existing products. According to Eckert et al. (Reference Eckert, Clarkson and Zanker2004), “Change is one of the most powerful driving factors of design and products are changed to improve them.”
However, this parameter network is affected by the ambiguity problem, which is inherent in qualitative physics. For instance, ambiguous inferences are generated when many possible behaviors are predicted without the means to select a correct or the most likely ones (Cohn, Reference Cohn1989). Practically speaking, qualitative reasoning often results in a large number of ambiguous and spurious solutions that designers in industry do not have time to check. Furthermore, qualitative reasoning is unable to adapt to later stages of the design when extra information becomes available to resolve some of these ambiguities that were present in the design before detailed decisions had been made (Price, Snooke, & Lewis, Reference Price, Snooke and Lewis2006). As a consequence, designers consider qualitative reasoning useless. In addition, industry is reluctant to introduce new tools to conceptual design if a tool requires too much extra effort.
This paper tackles the problem of ambiguous behaviors by reducing the number of ambiguous solutions in qualitative reasoning when applied to conceptual design. In literature, there are several methods to reduce ambiguities by adding information to the description of the physical system. These are reviewed in Section 2 and include heuristics, higher order derivatives, orders of magnitude, quantitative methods, and user intervention methods. Among these methods, we employ the user intervention method that asks the user to draw decisions about the system.
The user intervention method has the advantage of straightforwardness. When the user is asked about a value of a qualitative parameter, he/she can answer by giving the absolute qualitative value such as plus, zero, and minus. He/she can also give relative relations between parameters such as X > Y and X ⇐ zero. The user can also say unknown. When the value of one of the parameters to describe a behavior remains unknown, then the behavior is ambiguous. When a value is determined, the ambiguity of behavior is reduced. By doing so, a model of the physical system is further constrained and will eventually have a unique behavior as a solution. However, the user may be asked too many questions in order to cancel all the ambiguities. This paper illustrates a methodology based on user intervention, which is able to reduce ambiguities following the least commitment strategy. This is carried out in a way that the system asks only the most essential and distinctive questions.
The sections of this paper are organized as follows: Section 2 describes a literature study about qualitative reasoning, the use of qualitative reasoning in conceptual design, and methods in qualitative reasoning to reduce ambiguous behaviors. Section 3 classifies origins of ambiguities in qualitative physics. Section 4 introduces a qualitative mathematical rule able to understand when a system of equations is ambiguous or unequivocally solved. Section 5 presents a new methodology to find and to reduce ambiguities. Section 6 depicts two case studies to show the searching method in practice. Some applications of the method are outlined in Section 6.3. Advantages and limitations of the methodology are discussed in Section 7, and the main results are concluded in Section 8.
2. LITERATURE STUDY
This section gives an overview of the use of qualitative reasoning in conceptual design and creates some background information for the rest of the paper. Moreover, it describes methods that are used to reduce ambiguous behaviors during qualitative reasoning.
2.1. The use of qualitative reasoning in conceptual design
The use of qualitative models in physical systems provides evidence of the sufficiency of such models in capturing aspects of expert reasoning and learning (Forbus, Reference Forbus2011). In particular, qualitative reasoning is used when the quantitative precision of behavioral descriptions is unnecessary but at the same time the crucial information must be preserved. For instance, this happens at the conceptual design phase when the information is only partially available (Barr et al., Reference Barr, Cohen and Edward1989). Qualitative reasoning can be crucial in conceptual design because it helps capturing the commonsense understanding of the world that is the foundation of engineering knowledge (Forbus, Reference Forbus1998).
There are three main theories of qualitative reasoning: qualitative process theory (QPT), qualitative simulation (QSIM), and envisioning.
2.1.1. QPT
QPT, which was developed by Ken Forbus, organizes domain models around processes (physical phenomena; Forbus, Reference Forbus1981, Reference Forbus1984a, Reference Forbus1984b). Given a physical situation, there are four operations in QPT:
1. to decide which instances of processes can exist in that situation,
2. to determine which process instances are active by examining whether conditions are satisfied,
3. to determine which change can be caused by the active processes, and
4. to predict behavior over time.
The qualitative mathematical relations among parameters are represented in QPT by Q+ and Q− (called qualitative proportionalities) and I+ and I− relations (called direct influences). The notations Q+ (a,b) and Q− (a,b) denote a positive qualitative dependency and a negative qualitative dependency among the parameters a and b, respectively (Forbus, Reference Forbus1984a). The same notations can be written in other forms such as a = b, which corresponds to Q+ (a,b), and a = −b, which corresponds to Q− (a,b). In addition, QPT has I+ and I− relations, which denote direct positive and direct negative influences, respectively (Forbus, Reference Forbus1984a). The notations I+ (a,b) and I− (a,b) means that a is increased or decreased by b. The same notations can be written in a differential form such as
 $$I \!+ \lpar a\comma b\rpar \Leftrightarrow {da \over dt} = + b\comma \; $$
and
 $$I \!- \lpar a\comma b\rpar \Leftrightarrow {da \over dt} = -b. $$
Direct influence can help to figure out how a parameter will change in time.
2.1.2. QSIM
QSIM was developed by Kuipers to simulate the behavior of physical systems that are described as a system of qualitative differential equations (Kuipers, Reference Kuipers1986, Reference Kuipers1994; Kuipers & Berleant, Reference Kuipers and Berleant1988). It works by taking a set of qualitative functions and an initial state of a device, and it produces a sequence of future states, where each parameter constituting a state has a quantity space. The quantity space consists of a set of landmarks, which represent values that a parameter can have. Parameters also have qualitative directions that indicate whether they increase, decrease, or are steady. A qualitative state collects all the qualitative values of the parameters defining a system.
In particular, the algorithm of QSIM starts by defining names, quantity spaces and relations among parameters, invariant parameters, and the state of the system at a starting time. This starting state is the state where the simulation begins. Therefore, from this initial state, QSIM builds a tree of qualitative states whose root is the initial state. Every path from the root to a leaf determines the system's behavior.
The algorithm determines the successors of each state that has no successors. These states are stored in a list, and when the list is empty, the tree ends.
2.1.3. Envision and qualitative physics based on confluences
Envision is the program based on qualitative reasoning developed by De Kleer and Brown (De Kleer & Brown, Reference De Kleer and Brown1984; Barr et al., Reference Barr, Cohen and Edward1989). The goal of their study was to simulate commonsense reasoning about the physical world.
Envision employs qualitative physics based on confluences (De Kleer & Brown, Reference De Kleer and Brown1984). Qualitative physics based on confluences models the generic behavior of individual components of a device based on the notions of qualitative differential equations (called confluences) and qualitative state. The derivative of a parameter is represented qualitatively by ∂, where ∂x = [dx/dt]. Envision constructs the state diagram, indicating the behavior of a physical system by solving a set of simultaneous differential equations (Bobrow, Reference Bobrow1985). The inference mechanism consists in performing an integration of the set of differential equations describing the device based on a certain number of rules: the causality rule, the limit rule, the equality change rule, the epsilon ordering rule, the contradiction avoidance rule, the continuity rule, the mean value rule, and the feedback rule. Therefore, the device states are determined by considering every possible component state. Then constrains are applied to the states. If there are no solutions for a certain state, this is ruled out from the list of possible states and indicated as opposing. If there are multiple solutions, each interpretation corresponds to an episode. A subsequent episode can follow an episode, and there can be many possible transitions for an episode. Therefore, states and state transitions determine the episode diagram (Bobrow, Reference Bobrow1985).
2.2. Methods to reduce ambiguous behaviors
This section revisits various methods that can reduce the number of ambiguities, which are intrinsic to qualitative reasoning. These methods are heuristics, higher order derivatives, orders of magnitude, quantitative methods, and user intervention methods.
De Kleer and Bobrow (Reference De Kleer and Bobrow1984) and D'Ambrosio (Reference D'Ambrosio, Widman, Loparo and Nielsen1989) use heuristics to reduce the amount of ambiguities. De Kleer (Reference De Kleer1979) states that there are situations where some parameters can remain unassigned and that these situations can be solved only by using heuristics. Therefore, new rules are assigned to the systems in order to solve them. D'Ambrosio (Reference D'Ambrosio1987) uses “belief functions certainty representations” to capture partial or uncertain observational data and to estimate the state of likelihood, “linguistic descriptions of influence sensitivities” that use annotations to reduce undesirability during influence resolution (D'Ambrosio, Reference D'Ambrosio, Widman, Loparo and Nielsen1989), and “linguistic characterization of parameter values and ordering relationship” to permit capturing of partial and uncertain observational data, and enabling estimates of the effects of adjustments to continuous control parameters (D'Ambrosio, Reference D'Ambrosio, Widman, Loparo and Nielsen1989).
Raiman (Reference Raiman1986) and Mavrovouniotis and Stephanopoulos (Reference Mavrovouniotis and Stephanopoulos1989) used orders of magnitude formalism and orders of magnitude reasoning to reduce the amount of ambiguities. This approach employs additional primitive relations besides the ones normally used in qualitative physics (minus, zero, and plus) in order to improve the resolution of the qualitative results. First, the method increases the order of magnitude of the qualitative knowledge even when it is unnecessary. This can lead to reasoning out too many behaviors of the system. Second, it does not guarantee all the ambiguities to be solved, and in this case more knowledge to solve the system of equations is anyway needed. Third, the magnitude of different parameters cannot be comparable to each other and, therefore, can give erroneous results.
The use of higher order derivatives in qualitative reasoning is investigated in De Kleer and Bobrow (Reference De Kleer and Bobrow1984). Along the same line, Morgan (Reference Morgan, Mellish and Hallam1987) uses a vector of qualitative values and their derivatives in order to differentiate and to integrate within qualitative algebra. However, higher order derivatives may just increase the opportunity for ambiguity and hence the complexity of simulation because more variables are present. Thus, higher order derivatives are considered only when needed (when the first-order derivative is zero; Kuipers & Chiu, Reference Kuipers and Chiu1987; Cohn, Reference Cohn1989).
Kuipers and Berleant (1998) allowed two kinds of quantitative knowledge to be included in QSIM reasoning through user intervention, that is, numerical borders of the landmarks ranges and limits on the monotonically increasing or decreasing relationship among parameters. This information is propagated through the equations and can improve qualitative knowledge in the system and reduce the ambiguous behaviors. Contrary to the approach used in this paper, Kuipers and Berleant aim first to introduce new knowledge and then to check whether ambiguous behaviors are cancelled. However, the quantitative knowledge introduced does not always resolve ambiguous solutions, unfortunately.
Another relevant work is the one by Adler (Reference Adler2009). The multimodal interactive dialogue system program dynamically generates a dialogue that asks questions to resolve uncertainties or ambiguities. The physics simulator of this program takes the current state of the world and tries to predict the next state. When the next state cannot be determined unambiguously, the system creates a set of information requests that are eventually turned into questions. Our system is also based on similar interventions, however. Besides finding the questions, it also keeps memory of the answers using relations among parameters. This avoids not only the repeating of the same questions but also the asking of similar questions.
Several other quantitative methods, including probabilistic (Pearl, Reference Pearl1988) and fuzzy approaches (Shen & Leitch, Reference Shen, Leitch, Faltings and Struss1992), have been suggested to alleviate the problems of qualitative reasoning methods.
In this paper, a user intervention method is used to introduce more knowledge in the system in order to eliminate totally or partially ambiguous behaviors. Only the knowledge that can resolve ambiguities is considered by the system. This allows it to go straight to the problem and to avoid time-consuming knowledge insertion that does not solve the ambiguous system. However, intervention methods have various limitations. First, there is a risk of too many questions to ask. Second, the most straightforward intervention methods do not ask the most distinctive questions to efficiently eliminate ambiguities but rather present all possible questions to the user without any prioritization. Third, user assumptions can contradict each other, because user intervention methods do not consider any dependencies among pieces of knowledge. For instance, when two pieces of knowledge depend on each other (e.g., if [X] = plus, then [–X] = minus), it is possible to determine one using another. However, a straightforward user intervention method may end up with two independent assumptions from two independent questions that are essentially identical. A problematic situation may appear when these two assumptions contradict each other, because the user is not consistent in the answer. This may create further troubles such as the same question being asked many times or even an infinite number of times in the worst-case scenario.
This paper deals with all of these problems of user intervention methods. The problem of asking too many questions is solved by using dependencies among pieces of knowledge that reduce the number of asked questions. Consequently, the problem of possible contradictions among assumptions is partially solved. Furthermore, the problem of prioritization of distinctive questions is solved by using a tree parameter structure as explained in Section 5. This tree structure prioritizes ambiguities by the time of their appearance, so that ambiguities can be resolved as efficiently as possible with fewer questions.
3. ORIGIN OF AMBIGUITIES IN QUALITATIVE PHYSICS
To reason qualitatively about the physical world means to infer about incomplete or less precise information. Consequently, results are also incomplete or less precise, and this leads to ambiguous behaviors as explained in Section 1. Origins of ambiguities are explained in this section.
3.1. Ambiguities in qualitative calculus
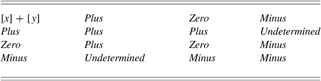
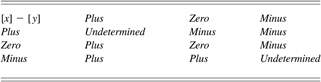
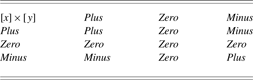
Qualitative calculus is used in many implementations of qualitative reasoning and qualitative physics. A parameter in qualitative calculus can assume four possible values: plus, zero, minus (as described in Section 2.1), and unknown. The result of qualitative calculus gives an interval of values or a landmark instead of real numbers (Barr et al., Reference Barr, Cohen and Edward1989). Table 1, Table 2, and Table 3 indicate results of using qualitative operators. Addition (Table 1) and subtraction (Table 2) of qualitative values can lead to unknown values of parameters. For instance, when a positive value adds to a negative value, it is not possible qualitatively to establish the predominant effect. Multiplication (Table 3) of qualitative parameters does not generate unknown values from known values. Unknown values are given by imprecise information about the magnitude of parameters and they generate ambiguous behaviors.
Addition of qualitative values [x] and [y]
Subtraction of qualitative values [x] and [y]
Multiplication of qualitative values [x] and [y]
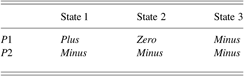
When a qualitative parameter assumes the value unknown, the behavior of the physical system is ambiguous and the number of possible states of the physical system increases. Moreover, increasing the number of unknown parameters increases exponentially the number of possible system states. For instance, if the system consists of two parameters (P 1 and P 2), where the value of P 1 is unknown and P 2 has value minus, the number of system states is three, as indicated in Table 4. When there are two unknown parameters, the number of system states is nine (see Table 5). Behavior is a set of qualitative states that the system goes through over time (Kuipers, Reference Kuipers1994).
States of a system with two parameters, where one of the parameters (P1) is ambiguous
States of a system with two ambiguous parameters (P1 and P2)

3.2. Ambiguities due to nonmonotonic equations
According to De Kleer and Brown (Reference De Kleer and Brown1984), “The lawful behavior of a component can be expressed as a set of qualitative equations.” In the case of monotonic equations, the qualitative behavior of a component is represented by one qualitative equation that represents the linear approximation of the function as described in Figure 1a.
(a) A monotonically increasing function in its quantitative and qualitative representation and (b) a nonmonotonically decreasing function in its quantitative and qualitative representation. [A color version of this figure can be viewed online at http://www.journals.cambridge.org/aie]

The qualitative description of a nonmonotonic equation consists of a set of qualitative equations as described in Figure 1b. Each of these qualitative equations corresponds to one context of a physical system and describes a monotonic part of the quantitative equation. The nonmonotonic function in Figure 1b is described by two qualitative equations: ∂X = ∂Y and ∂X = −∂Y. One qualitative equation or the other applies to specific contexts of a physical system. A context can change depending on the space where a component is located or on the time when a component is considered. When the context is unknown, the behavior of the component can be ambiguous.
For instance, the vertical speed of a pendulum is described by the nonmonotonic quantitative equation
 $${dy \over dt} = r{d \theta \over dt} \cos {\rm \theta}$$
(derivative of its position y = r sin θ). The length of the pendulum is supposed to be constant (r = const), and cos θ, which depends on the semicircle where the pendulum is located, can take the qualitative values plus, zero, or minus. This means that the equation is not monotonically increasing or decreasing. In order to be transformed into a monotonically increasing or decreasing equation, the equation needs to be linearized first. The result of the linearization consists of two qualitative equations where the derivative of a parameter is symbolized with ∂ (Section 2.1.3). Each of the equations is valid for one semicircle: ∂y = +∂θ (right semicircle) and ∂y = −∂θ (left semicircle). Figure 2 illustrates this example. In other words, the vertical behavior of the pendulum depends on its position in one of the semicircles (right or left), and, therefore, it is ambiguous. By deciding the context (left or right semicircle) of the pendulum, the ambiguity is removed.
Behaviors of a pendulum. Each semicircle corresponds to a different behavior and therefore to a different qualitative equation (∂y = +∂θ and ∂y = −∂θ). [A color version of this figure can be viewed online at http://www.journals.cambridge.org/aie]

3.3. Opposing phenomena
Opposing phenomena are phenomena that act on the same component in opposite directions. For instance, a body is warmed up by a heater while cooled down by a radiator. Because the phenomena warming up and cooling down are applied at the same time on the same body (see Figure 3), it is not possible to qualitatively understand if the body temperature (T) actually increases, decreases, or remains steady. The same happens when acceleration and deceleration are applied at the same time to a body (Figure 3). In this case, the value and the derivative of the velocity (V) will be qualitatively unknown. Making a decision about opposing phenomena is deciding the magnitude of the phenomena. This results in one parameter's value.
Example of opposing phenomena acting on a body. T, temperature; V, velocity. [A color version of this figure can be viewed online at http://www.journals.cambridge.org/aie]

The case of opposing phenomena leads again to the case described mathematically in Section 3.2, where it has to be decided which of the two or more equations holds. The opposing phenomena cases and nonmonotonic cases are different conceptually. In the opposing phenomena, a phenomenon does not exclude the occurrence of the other phenomena, whereas nonmonotonic cases exclude other contexts.
3.4. Ambiguities due to the increment or decrement of a parameter
Perhaps 80% to 90% of actual cases are not new designs but routine designs or redesigns that begin with an old design and try to modify limited parts of the design. For example, the next machine should be 5% smaller (lighter), 10% faster, and 15% cheaper, but in architecture, so-called working principles could remain the same, meaning governing physical equations are the same as the old ones. In such a design, the designer needs to understand the effect of the new design performance specifications on design parameters. For instance, in order for the output speed to be 10% faster, some components should weigh 10% less or the motor power should be 10% stronger. Such increments and decrements can easily be derived from the analysis of the governing physical equations using qualitative reasoning.
An increment or decrement of the value of a parameter is symbolized in this paper by Δ, which is conceptually different from a derivative of a parameter in time symbolized by ∂ (see Section 2.1.3). An increment does not include information on how a value has changed over time but is about design change.
The following example illustrates how increment (or decrement) Δ can be useful during design. Newton's second law of motion is
 $$\lsqb f\rsqb = \lsqb m\rsqb \lsqb a\rsqb . $$
In conventional physics, Eq. (3) should be interpreted that when force f decreases, mass m does not decrease, and instead acceleration a of this mass decreases. However, in design, for example, it is perfectly acceptable to reason out that mass has to be lighter, if acceleration should not change but force given from outside has to be smaller. This means one can discuss design changes using Δ.
However, introducing Δ can also lead to ambiguous values that need to be resolved, just like other types of ambiguities.
4. RULES TO DETECT AMBIGUITIES IN QUALITATIVE EQUATION
This section discusses solving qualitative equations by finding qualitative values of parameters that satisfy the equations. Value propagation is used to determine the parameter values in the system of equations that represent the constraints to be satisfied. In quantitative equations, given the values of all the parameters in the equation but one, it is possible to uniquely determine the value of the unknown parameter by substituting the known values in the equation. In qualitative equations, this might not be the case.
Consider a qualitative set of equations in the form described in Eq. (4), where [x] denotes qualitative value of parameter x as described in Section 2.1.
 $$\lsqb a\rsqb = \lsqb b\rsqb + \lsqb c\rsqb \comma \; $$
 $$\hskip-17pt\lsqb b\rsqb = plus\comma \; $$
 $$\hskip-12pt\lsqb c\rsqb = minus. $$
The unknown value of Eq. (4) lies on the left-hand side of the equation. From Eqs. (4), (5), and (6), we obtain
 $$\lsqb a\rsqb = plus + minus. $$
According to Table 1, the value of [a] is unknown and therefore ambiguous.
In order to detect if a value is ambiguous or unequivocally determined, Forbus (Reference Forbus1984a) states that if opposite influences act on a single parameter, then the net influence on the parameter is unknown. Therefore, when the influences acting on a parameter are not sufficient to unequivocally determine its value, the parameter is ambiguous. When the influences acting on a parameter are sufficient to unequivocally determine its value, the parameter is not ambiguous. D'Ambrosio (Reference D'Ambrosio, Widman, Loparo and Nielsen1989) visualized this statement by making use of the “conflicting triangle” and the “feedback loop” as shown in Figure 4.
D'Ambrosio representation of a conflicting triangle and a feedback loop for detecting ambiguous parameters. [A color version of this figure can be viewed online at http://www.journals.cambridge.org/aie]

The conflicting triangle works as follows. An arrow indicates a relation between two parameters. The direction of the arrow indicates that a parameter affects the other (arrow coming out from the vertex) or that a parameter is affected by another parameter (arrow coming in to the vertex). Then there is an indication about the type of influence (direct or indirect). When a vertex is influenced (arrows coming in) by two opposite influences (direct and indirect), the triangle is conflicting and an ambiguity is generated. For instance, the left part of Figure 4 indicates a conflicting triangle because vertex B has two arrows coming in with opposite signs. This ambiguity makes the other parameters of the triangle ambiguous, too.
A feedback loop indicates the relation between two parameters. In this case, it is enough to have different signs affecting the two parameters to generate an ambiguity without the information about arrows coming in or out. The feedback loop of Figure 4 shows different influences acting on parameter A (and C); this means that A and C are both unknown.
5. METHODOLOGY TO SEARCH AND TO RESOLVE AMBIGUOUS BEHAVIORS
This section proposes a methodology to search and to resolve ambiguous behaviors of qualitative reasoning represented by a parameter network. By detecting and then resolving a finite number of ambiguities, it is possible to know unequivocally the direction of change of parameters, such as increasing, decreasing, or steady. In this paper, the symbols ↑, ↓, =, and ? denote a parameter that increases, decreases, is steady, or is unknown, respectively.
5.1. Steps for the user
The starting point of the system is a parameter network (see Figure 5) that the QPT-based reasoning engine of the Knowledge Intensive Engineering Framework (KIEF; see Section 5.4) automatically creates. This network indicates how design parameters are related to each other. The designer would like to increase the speed to meet the new specifications. In this way, he/she selects a parameter and increases (or decreases) the value of a parameter (initial parameter) by pushing the increasing (or decreasing) button (not shown in Figure 5). This creates a domino effect on related parameters that in turn increase, decrease, or become unknown. At this point, there can be many unknown parameters. The system analyzes the chain of parameters and picks up the nearest unknown parameter to the initially changed one. By repeating this process for all the unknown parameters, a sequence of questions to the user is generated.
A Knowledge Intensive Engineering Framework screenshot of a parameter network. White rectangles indicate parameters that increase the value, black rectangles are parameters that decrease the value, dark gray rectangles are ambiguous parameters, and light gray rectangles are constant parameters. [A color version of this figure can be viewed online at http://www.journals.cambridge.org/aie]

The system asks the designer to determine the value of an unknown parameter, the designer gives an answer, and the answer is propagated through the parameter tree. Through this propagation, other ambiguities can be automatically solved. The algorithm gradually reduces ambiguities through interactions between the system and the user by relying on qualitative relations among parameters. The process of searching ambiguities and performing interventions is automatically repeated in the parameter tree until all unknown parameters are determined.
5.2. Building the parameter tree
A parameter tree is an ordered tree that consists of four elements: a set of vertices, a root, a set of directed edges, and an order of the edges out of each vertex. One of the differences between a parameter tree and a parameter network is that a parameter tree has a starting point and an ending point that are not present in the network. Therefore, a parameter tree helps better than the parameter network in detecting the root of ambiguities and in searching and taking decisions. The parameter network is used in a second phase to synthesize and better visualize the results of searching and the decisions taken in the tree. The parameter tree described in this paper is built in the same way as the parameter tree used in QSIM (see Section 2.1.2)
In order to explain how a parameter tree is built, we refer to the tree in Figure 6. The tree, which is made of roots and branches, presents relations among parameters for the pulley mechanism shown in Figure 7. The set of qualitative equations describing the mechanism in Figure 6 is the following: second law of Newton for rotation:
 $$\lsqb T_{p1}\rsqb = \lsqb I_{p1}\rsqb \lsqb \dot{{\rm \omega}}_{p1}\rsqb \comma \; $$
transmission of motion from rotational to linear:
 $$\lsqb \dot{{\rm \omega}}_{p1}\rsqb = \lsqb a_{\rm b}\rsqb \comma \; $$
transmission of motion from linear to rotational:
 $$\lsqb a_{\rm b}\rsqb = \lsqb \dot{{\rm \omega}}_{p2}\rsqb \comma \; $$
relation between torque and voltage of the motor:
 $$\lsqb T_{p1}\rsqb = \lsqb V_{m}\rsqb \comma \; $$
in which T p1, I p1,  $\dot{{\rm \omega}}_{p1}$, and r p1 are the respective torque, moment of inertia, radius, and angular acceleration of pulley 1; a b and νb are acceleration and linear velocity of a belt;
 $\dot{{\rm \omega}}_{p2}$ is the angular acceleration of pulley 2; and V m is voltage of a motor. The angular acceleration of pulley1 (
 $\dot{{\rm \omega}}_{p1}$) is chosen as the root of the tree and increased or decreased (
 $\Delta \dot{{\rm \omega}} _{p1} = plus$ or
 $\Delta \dot{{\rm \omega}}_{p1} = minus$). This increase (or decrease) is a “design change” in which the designer decides to use faster (or slower) rotational acceleration of the pulley. The first and second qualitative equations [(8) and (9)] establish the dependencies of
 $\dot{{\rm \omega}}_{p1}$ and generate the second root level (T p1, a b, and I p1).
A graphical representation of a parameter tree with its roots and branches. [A color version of this figure can be viewed online at http://www.journals.cambridge.org/aie]

A schematic representation of a driven pulley mechanism. [A color version of this figure can be viewed online at http://www.journals.cambridge.org/aie]

A branch of the tree will not be any more expanded when there appears again a parameter that appeared somewhere in the path from the branch to the root. Note that there are duplications of parameters in this process of converting a parameter network to a parameter tree. The qualitative equations above derive qualitative influences (positive or negative) among parameters. For instance, Eq. (8) derives that T p1 is qualitatively influenced (Q+) by I p1 and  $\dot{{\rm \omega}}_{p1}$, and that I p1 is inverse-qualitatively influenced (Q−) by
 $\dot{{\rm \omega}}_{p1}$. These qualitative rules are represented by the conflict triangle in Figure 8. Because opposite influences act on both I and
 $\dot{{\rm \omega}}$, the influence on these parameters is unknown and it is possible to forecast that ambiguities will be generated.
Conflict triangle for the equation  $T = I\, \dot{{\rm \omega}} $. Q+ and Q− respectively denote positive qualitative dependency and negative qualitative dependency among the parameters T, I, and
 $\dot{{\rm \omega}}_{p1}$. [A color version of this figure can be viewed online at http://www.journals.cambridge.org/aie]

5.3. Method for search in the parameter tree
There are three well-known methods to search: the breadth-first search, the depth-first search, and the hybrid of the breadth-first and depth-first methods, which is called interactive deepening (D'Ambrosio, Reference D'Ambrosio, Widman, Loparo and Nielsen1989; Forbus & De Kleer, Reference Forbus and De Kleer1993). In order to find ambiguities, we use the interactive-deepening method shown in Figure 9. Beginning with the root node, an unknown parameter is searched with the breadth-first algorithm. Once such an unknown parameter is found, the search switches to the depth-first algorithm to look for unknown parameters beneath the unknown parameter found in the breadth-first search.
Algorithm for searching and reducing the amount of ambiguities in a parameter tree. [A color version of this figure can be viewed online at http://www.journals.cambridge.org/aie]

The method first generates parameter nodes that are directly connected to the root parameter through qualitative proportionalities or direct influences (Q+ and Q − , I+ and I−). These directly connected parameters are checked first. If any of those parameters is ambiguous, this ambiguity will be resolved. Then the system moves along the causal paths provided by the qualitative proportionalities and checks new possible ambiguities. This is done because pinning down an earlier ambiguity might lead to all the downstream ambiguities being resolved.
The algorithm is explained in detail as follows. First, an assumptionFootnote 1 is made by assigning a starting value to a parameter (e.g., Δ increasing as a design choice made by the designer), and this assumption generates a parameter tree. The variable K is a counter that is used to distinguish different branches in the parameter tree (see Figure 9). Then the directly influenced parameters (parameters that have a qualitative relation with the initial parameter) are distributed into the lists of increasing and decreasing nodes (these lists are not yet “believed,”Footnote 2 and they are updated any time new information is added to the system). When influenced parameters are absent, it means that the tree has been checked totally, and increasing and decreasing nodes become believed. The lists of believed parameters increasing and decreasing are the output of the algorithm. When the influenced parameters do not include ambiguities (no parameter belongs to both increasing and decreasing lists), the breadth-first search continues until an ambiguity is found.
When one or more ambiguities are detected (one or more parameters belong to both increasing and decreasing lists), the methods shown in Section 4 (conflict triangle and feedback loop) are used to detect if the ambiguity can be resolved with the available knowledge (automatically) or if more assumptions need to be made (manually). When ambiguities cannot be automatically solved with the available knowledge, additional information on one ambiguity value has to be made and, therefore, user intervention is needed. Providing additional information one per time can reduce the number of decisions to take by avoiding resolving ambiguities that are already implicitly resolved.
When the decision is taken, the search algorithm leaves the root of the tree and enters in the branch of the tree (k = k + 1) related to the selected parameter. The branch is explored with a breadth-first search until the dead end is reached. Whenever another ambiguity is generated inside the branch, it has to be resolved before leaving the branch. Ambiguities can be found not only inside the branch itself but also by comparison of the branch with the part of the root that has already been explored. At the dead end of the branch, the method starts again with the breadth-first search at the root of the tree (k = k −1).
Output of the ambiguities method is a list of believed parameters. Ambiguities are no longer present and the designer can check consequences of his/her choice in terms of direction of change of parameters.
5.4. Using KIEF as user interface
One of the driving forces of qualitative reasoning has been to develop software that works as an “artificial engineer” (Forbus, Reference Forbus2011). KIEF is a design framework aiming at accomplishing this goal. KIEF is equipped with an inference engine based on QPT (Yoshioka, Reference Yoshioka2000; Yoshioka et al., Reference Yoshioka, Umeda, Takeda, Shimomura, Nomaguchi and Tomiyama2004), ontological knowledge bases of concepts, and a metamodel mechanism to integrate knowledge and models in different domains (modelers; Yoshioka et al., Reference Yoshioka, Umeda, Takeda, Shimomura, Nomaguchi and Tomiyama2004). A metamodel stored in the metamodel mechanism is a conceptual network composed of concepts needed to describe a device model. Using these concepts, the metamodel mechanism is able to pass on the knowledge of a device model in one domain to another. Consequently, the metamodel in KIEF integrates knowledge in different disciplines and infers about the whole product. These functionalities are useful to create a common language among different disciplines and to have a total view of the product that can be an ontological mental model.
Among KIEF functionalities, there is a qualitative parameter analyzer (Figure 5), which presents a parameter network to provide a total view of the product. The method to resolve ambiguities has been implemented in the qualitative parameter analyzer of KIEF that is able to automatically generate a parameter network from qualitative equations. The top of the screen in Figure 5 shows causal relationships among physical phenomena and links between parameters and physical phenomena. The lower window of the screen shows the parameter network extracted from the causal relationships.
Now the new product will be a modified version of the old product, so the first step for the designer is to increase or to decrease the value of a parameter by clicking one of the action buttons at the bottom of the screen (INCREASE and DECREASE). In Figure 5, parameters in dark gray rectangles are found ambiguous; those in white rectangles are increasing parameters; and light gray rectangles are steady parameters (parameters that decrease are not represented in the figure). Through the menu in the screen, the “ambiguity solver” can get started to automatically search for ambiguities. The “choose value” selection allows manual changes of more than one parameter value at a time.
6. CASE STUDIES
This section illustrates two case studies to explain how the method works. The first case study discusses ambiguities owing to qualitative equations (Section 4), while the second case study explains the case of ambiguities owing to opposing phenomena (Section 3.3).
6.1. Case of ambiguities owing to qualitative equations
This section discusses the pulley mechanism case in Figure 6. The parameter tree with its value (increase or decrease) is shown in Figure 10. The tree is divided in levels, and the first root node is  $\dot{{\rm \omega}}_{p1}$, which increases (
 $\Delta \dot{{\rm \omega}} = +$). Showing levels helps to illustrate how the breadth-first search proceeds. The dark “leaves” in the tree indicate assumptions, which represent design changes the designer specified manually.
Parameter tree (k = 1) generated from the equation  $T = I\dot{{\rm \omega}}$ by making the assumption
 $\dot{{\rm \omega}}_{p1}$ increasing. The symbols ↑, ↓, =, and ? denote a parameter that increases, decreases, is steady, or is ambiguous, respectively. [A color version of this figure can be viewed online at http://www.journals.cambridge.org/aie]

Table 6 shows parameter values at different node levels, distributing between increasing, decreasing, and ambiguous. At the third level, two ambiguities are generated: T p1 is decreasing at level 3, while the same T p1 is increasing at level 2; I p1 is increasing at level 3, while the same I p1 is decreasing at level 2. Here, T p1 and I p1 belong to the same qualitative equation ( $\Delta T_{p1} - \Delta I_{p1} = \Delta \dot{{\rm \omega}}_{p1}$) and they are both unknown; therefore, at least one more assumption is needed to determine their value. For instance, suppose the designer makes the assumption that I p1 decreases. Thus, the algorithm temporary leaves out the tree in Figure 10 and instead looks at the tree in Figure 11, which considers the directly influencing parameters starting from I p1 only. This new tree is a branch of the tree in Figure 10, and from this point a depth-first search begins. The new assumption I p1 decreases (Δ I p1 = minus) is automatically included in the list of decreasing believed nodes.
A parameter tree (k = 2) generated from the assumption I p1 decreasing. The symbols ↑, ↓, =, and ? denote a parameter that increases, decreases, is steady, or is ambiguous, respectively. [A color version of this figure can be viewed online at http://www.journals.cambridge.org/aie]

Lists of increasing, decreasing, and ambiguous parameters

Now T p1 still belongs to the list of ambiguities and its parametric relationships need to be checked to understand if this ambiguity can be resolved without user intervention (Section 4). The equation concerned here is
 $$\Delta T_{p1} = \Delta \dot{{\rm \omega}}_{p1} + \,\Delta I_{p1}. $$
In Eq. (12), ΔI p1 = minus and  $\Delta \dot{{\rm \omega}}_{p1} = plus$, so ΔT p1 is ambiguous.Footnote 3 Therefore, another assumption needs to be made on T p1. The algorithm temporary switches from the tree in Figure 11 to the one in Figure 12, where T p1 is the starting node. Now assume T p1 decreases (ΔT p1 = minus). Because no ambiguities are found before reaching the dead end of the tree in Figure 12, all the nodes that belong to this tree are added to the lists of believed nodes. We can also assume T p1 increases (ΔT p1 = plus), because we arrive at the same conclusion. The value of V m is automatically included in the list of decreasing believed nodes, without adding any assumption. Next the algorithm switches back from the tree in Figure 12 to the one in Figure 11. Because this tree does not add any new node in the lists of believed nodes, the algorithm steps further back to the tree in Figure 10. This process is repeated until the dead end of the tree. That means that all the nodes that are not already in the believed nodes will be added to these lists.
A parameter tree (k = 3) generated from the assumption T 60 decreasing. The symbols ↑, ↓, =, and ? denote a parameter that increases, decreases, is steady, or is ambiguous, respectively. [A color version of this figure can be viewed online at http://www.journals.cambridge.org/aie]

Table 7 shows the list of believed nodes generated by the system based on assumptions found also in Table 7. The system has reasoned out that when the angular acceleration of the pulley increases and the torque applied to the pulley decreases, acceleration of the belt and the acceleration of the other pulley need to increase, and the voltage of the motor and the moment of inertia of the pulley need to decrease.
Believed nodes and assumption nodes
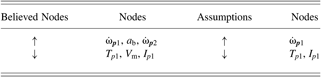
Even though this example represents the worst-case scenario, the method was still able to automatically resolve one of the ambiguous values (V m) of Figure 10 out of four ambiguities. In this case, three questions solved four ambiguities. When I p1 increases, T p1 and V m unequivocally increase without adding any further assumption. In this case, one question solves three ambiguities.
Assigning a constant value to an ambiguity means neglecting relations that the ambiguous parameter has with other parameters. For instance, if I p1 is constant, Eq. (12) can be simplified to the equation  $\Delta T_{p1} = \Delta \dot{{\rm \omega}}_{p1}$. The parameter tree resulting from this simplification is the one in Figure 13, in which no ambiguities appear.
Parameter tree resulting from the assumption that  $\dot{{\rm \omega}}_{p1}$ increasing and I p1 is constant. The symbols ↑, ↓, =, and ? denote a parameter that increases, decreases, is steady, or is ambiguous, respectively. [A color version of this figure can be viewed online at http://www.journals.cambridge.org/aie]

6.2. Case of opposing phenomena
This section shows the case of opposing phenomena acting on a body (Figure 3). The phenomena “warming up” and “cooling down” act on the temperature of the body in opposite directions, and the qualitative rules that applies to this case are
 $$\lsqb T_{body}\rsqb = - \lsqb Airflow_{cooler}\rsqb \comma \; $$
 $$\lsqb T_{body}\rsqb = - \lsqb T_{heater}\rsqb . $$
Because increasing airflow (Airflow cooler) decreases the temperature of the body (T body) but increasing T body does not decrease Airflow cooler, the first equation is valid only in one direction. Therefore, the arrow between temperature of the body and airflow is unidirectional, as shown in Figure 14.Footnote 4 Based on the feedback loop (see Section 4), because opposite influences act on T body, ambiguities are generated in the system.
Conflict triangle for the opposing phenomena “warming up” and “cooling down.” [A color version of this figure can be viewed online at http://www.journals.cambridge.org/aie]

There are two possible assumptions for this case: Airflow cooler is increasing (T body decreases due to the first equation) or T heater is increasing (T body increases due to the second equation). Therefore, T body is ambiguous and a new assumption has to be added in order to resolve it. For instance, when T body is assumed to decrease, the effect of the cooling airflow is bigger than the effect of the heater. The new assumption is then propagated through the system. For instance, when another qualitative equation states that T body = T pulley, T pulley is unequivocally determined because it is linked to the new assumption.
6.3. More applications of the user intervention method
Section 6.1 has shown how a starting value of one parameter (increasing  $\dot{{\rm \omega}}_{p1}$) can generate a set of ambiguities that propagate through the system. In Section 6.2, the ambiguity is generated by making two assumptions at the same time (Airflow cooler increases and T heater increases). Therefore, it is important to be able to make multiple assumptions at the same time because this can lead to discovering hidden ambiguities.
By making multiple assumptions at a time, parameter trees of the different assumptions can interact with one another as shown in Figure 15. In the figure, A1, A2, and A3 represent three different assumptions, while colors signify the parameter tree these parameters belong to. Each parameter network, created by one or more assumptions, is stored in an ordered collection in the chronological order of the timing when the assumption was made (see Table 8). Each row of the table represents a different parameter network and contains information about assumptions, increasing nodes, decreasing nodes, and ambiguous nodes of the respective parameter network. The numbers in the names of the entities and parameters in Table 8 are automatically generated by KIEF, and the same number indicates the same concept.
A parameter tree intersection resulting from making three assumptions (A1, A2, A3) at the same time. [A color version of this figure can be viewed online at http://www.journals.cambridge.org/aie]

Collection of assumptions and increasing, decreasing, and ambiguous parameters (nodes)

A parameter can belong to multiple parameter networks at the same time (e.g., the “temperature56” of a “Pulley 10” belongs to both the third and the fourth rows of Table 8), although the value of a parameter can be different from tree to tree (e.g., the “temperature56” of a “Pulley 10” belongs to the increasing nodes in the second row and to the decreasing nodes in the third row of Table 8). In order to unequivocally determine the value of a parameter, comparison rules among trees are necessary, which are represented as follows:
1. Only one assumption can be made for a node.
2. A node that is an assumption cannot change its value unless the assumption is retracted.
3. A node is ambiguous if and only if it belongs to both increasing and decreasing node lists and it is not an assumption.
4. A node increases if it belongs only to the list of increasing nodes or if it is an assumption with value increasing.
5. A node decreases if it belongs only to the list of decreasing nodes or if it is an assumption with value decreasing.
Figure 16 shows the final parameter network displayed in the user interface of KIEF (see Section 5.4) obtained from the parameter networks listed in Table 8. White, black, dark gray, and light gray rectangles indicate parameters that increase the value, decrease the value, are ambiguous, and are constant parameters, respectively. The interface shows also the list of assumptions made by the designer.
The Knowledge Intensive Engineering Framework shortcut of a parameter network and a related list of assumptions. White rectangles indicate parameters that increase the value, black rectangles are parameters that decrease the value, dark gray rectangles are ambiguous parameters, and light gray rectangles are constant parameters. [A color version of this figure can be viewed online at http://www.journals.cambridge.org/aie]

At this point, all the nodes are in one of the increasing, decreasing, or ambiguous lists. Ambiguities can be resolved anytime by the methods explained in Sections 6.1 and 6.2. As soon as one or more ambiguities are resolved by making new assumptions, new comparisons are made in the ordered collection following the rules above and the parameters are relocated in an appropriate list (increasing, decreasing, and ambiguous parameters). The final result as a total parameter network is shown in Figure 16.
7. DISCUSSION
This work is part of a bigger project that aims at detecting unpredicted phenomena during product development of complex multidisciplinary systems (Tomiyama et al., Reference Tomiyama, D'Amelio, Urbanic and ElMaraghy2007). While designers should be able to predict physical phenomena that might happen and they do during the development process, sometimes they are surprised by “unpredicted” (or unexpected) phenomena that happen especially because of multidisciplinarity (Tomiyama et al., Reference Tomiyama, D'Amelio, Urbanic and ElMaraghy2007). For example, if a spring is used in a machine that generates heat, its natural length changes owing to heat expansion. Because of this, the spring force can deviate from its expected value. If the designer does not know of this phenomenon of “virtual softening of a spring” in the interacting domain between mechanics and heat transfer, this phenomenon can be an unpredicted phenomenon for him. Such phenomena are difficult to detect and discovered only at the end of the product development process in which a physical prototype is tested. This may lead to modifications of the conceptual design and cause delays and extra cost of the product development. Our previous paper (D'Amelio et al., Reference D'Amelio, Chmarra and Tomiyama2011) reported that qualitative reasoning is useful in conceptual design and particularly in detecting these unpredicted problems.
As demonstrated through examples in Section 6, KIEF's qualitative parameter network analyzer offers an easy way to analyze consequences of design change(s) on the system. It also helps to identify which combination of changes can lead to potential problems in the system and to changes of specifications.
In addition, unpredicted phenomena affect the parameter network by introducing parameter relations that were not recognized before. As a consequence, new relations owing to unpredicted phenomena can change the expected value of parameters and can generate ambiguities (i.e., when a new relation acts in opposite directions on the expected value of a parameter). Similarly, unpredicted phenomena can be identified by looking at ambiguities and unexpected values of parameters. Therefore, recognizing and comprehending influences and propagation of parameter value changes are extremely crucial to avoid design failures at an early stage of product development.
However, our attempts to introduce qualitative reasoning techniques to conceptual design of complex products in industry were not successful. On the one hand, designers recognized advantages and possible potentials of qualitative reasoning techniques. For instance, designers found the automatic generation of parameter networks useful for the design of complex products, because it makes easy it to keep track of all the consequences of multiple design changes. On the other hand, however, with the early versions of KIEF's qualitative parameter network analyzer, designers became skeptical about the usability of qualitative reasoning results, because of the following two reasons.
First, too many behaviors are reasoned out by the qualitative engine, and most of those solutions are spurious behaviors. The previous paper (D'Amelio et al., Reference D'Amelio, Chmarra and Tomiyama2011) investigated this problem and proposed two filtering methods to reduce negligible behaviors, which are based on comparison between old design and new design. Second, there are ambiguities in parameter values that this paper tackled. Consequently, we believe qualitative reasoning has become more usable at the conceptual design phase with less spurious behaviors and devoid of ambiguities.
This paper depicted a small example consisting of six parameters. For examples with many more parameters, the user intervention method can be effective, because it can rapidly shrink the number of ambiguities with a few user inputs. For the design of a highly compact, integrated product (e.g., a mechatronics product), the method is more efficient than simpler, less integrated products. Because parameters in highly compact, integrated products have more relations to each other, the intelligent user intervention method can use these relations to propagate assumptions through the parameter network and reduce ambiguities quickly. In the case of less integrated products, an assumption resolves ambiguities only locally for a module (or a component) and does not propagate through the entire system. Therefore, the intelligent user intervention method is more efficient for complex integrated systems and less efficient for highly modular products.
Section 3.1 explained that when a parameter is ambiguous (undetermined), the behavior of the physical system is ambiguous and the number of possible states of the physical system increases exponentially. The order of possible states of the system is ϑ(3n), where 3 is the number of possible values that a parameter can take and n is the number of undetermined parameters. On the contrary, by resolving ambiguities, the number of possible system states decreases by ϑ(3m), where m is the number of resolved undetermined parameters (assumptions). This indicates the efficiency of the method in terms of computational complexity.
There are some limitations of the intelligent user interventions method this paper reported. First, a limitation is that the user can be asked questions that cannot be decided during the conceptual phase, because they need details obtainable only at a later stage. In this case, the ambiguity remains. However, least commitment or postponing decision strategies can be useful to leave freedom to the design. However, it is not recommended to constraint a design too much during the conceptual design, because it can limit the creativity of the design. Therefore, we need a trade-off between the least commitment principle for design freedom and the resolution of ambiguities to reduce complexity.
Second, resolving one ambiguity does not always guarantee that new ambiguities are not generated. For instance, by making multiple assumptions at the same time, new ambiguities can be found. In this sense, our system is just semiautomatic. However, the objective of this work was not a totally automatic system. Our system leaves the designer with freedom of changing parameter values flexibly depending on problem constraints.
8. CONCLUSIONS
Qualitative reasoning can generate ambiguous behaviors owing to the lack of quantitative information. Three sources of ambiguities in conceptual design are qualitative calculus, nonmonotonic equations, and opposing phenomena. To detect ambiguities in a system, it is proposed to use the conflict triangle and the feedback loop representation. To resolve ambiguities of qualitative reasoning, it is necessary to add knowledge to the design. However, in literature there is no qualitative method that can solve ambiguities and completely guarantee the consistency of the results at the same time. Therefore, this paper has proposed a new method to search and to reduce the number of ambiguities by obtaining user inputs and using knowledge about parameter networks.
This method consists of the following steps:
1. the system automatically detects an ambiguity using knowledge about parameter networks,
2. the designer enters a solution to this ambiguity,
3. the system propagates the solution through the parameter network,
4. the system automatically finds dependent ambiguities, and
5. the system resolves ambiguities based on the solution given by the designer in step 2.
The advantage of the presented method is in the search for ambiguities and in the propagation of the solution, but not in determining the solution itself. The method is based on an intelligent user intervention that obtains knowledge from the user to the system in order to eliminate totally or partially ambiguous behaviors with minimum user inputs and that propagate this knowledge through the system. Moreover, this intervention method is able to ask the most essential and distinctive questions by using prioritization and avoids redundancies in the interventions.
Priority of intervention is given to ambiguous parameters in the parameter tree that are closer to the assumption made. This means that the user can act on the immediate origin of ambiguities and resolve ambiguities effectively before they propagate through the parameter network and increase ambiguities.
One distinctive property of the intelligent user intervention method is that contradicting assumptions are not allowed. This is because the method considers assumptions that are always true and, therefore, they cannot change their values unless they are retracted. Propagation of assumptions, which is based on dependencies among pieces of knowledge, is used to determine the values of parameters in the parameter network that are ambiguous and to categorize them as increasing, decreasing, and steady. This categorization helps designers in understanding consequences of design changes and in detecting undesired values of parameters.
The paper has also illustrated the case of ambiguities owing to opposing phenomena that corresponds to the case when more independent interventions are needed at the same time for one parameter network. This case is important, because different interventions can interact with each other and influence each other's paths. The risk of this case is very high. Therefore, in contrast to the case when one assumption at a time is made, the case of multiple assumptions requires additional rules to maintain consistencies of the results.
In conclusion, the described intelligent user interventions method has an advantage that it allows decisions based on any type of knowledge (e.g., heuristics, higher order derivatives, orders of magnitude, and quantitative methods) to reduce ambiguous information. The intelligent user interventions method was implemented as an extended feature of KIEF and resolves the ambiguity problem of qualitative reasoning. The implemented problem solver makes use of the truth maintenance system (Yoshioka et al., Reference Yoshioka, Umeda, Takeda, Shimomura, Nomaguchi and Tomiyama2004) to manipulate assumptions. In particular, we demonstrated how a few assumptions can significantly reduce the number of ambiguities by expanding information through the network. Therefore, the intelligent user interventions method is a contribution to improve practical usability of qualitative reasoning in conceptual design of complex multidisciplinary systems.
ACKNOWLEDGMENTS
The authors gratefully acknowledge the Smart Synthesis Tools and Octopus projects. Smart Synthesis Tools was supported by the Dutch Innovation Oriented Research Program Integrated Product Creation and Realization funded by the Dutch Ministry of Economic Affairs, Agriculture and Innovation. The Octopus project was administrated by the Embedded Systems Institute (Eindhoven) and funded by the Dutch Ministry of Economic Affairs, Agriculture and Innovation. The authors are thankful for the support of Océ-Technologies B.V. for the Smart Synthesis Tools and Octopus projects. Finally, many thanks to Layla Al Abdulkarim for her help in improving the manuscript.
Valentina D'Amelio is an Aerospace Engineer working as Product Manager at Hukseflux Thermal Sensors in The Netherlands. She graduated from the Università degli studi di Roma La Sapienza with a final thesis concerning a haptic system for an unmanned aerial vehicle in 2005. She received her PhD in December 2010 from the Department of Biomechanical Engineering at the Delft University of Technology. The topic of her research was design methodology for mechatronics systems.
Magdalena K. Chmarra is a Researcher in the Department of Circulation and Medical Imaging at the Norwegian University of Science and Technology, where she has worked since November 2011. From 2003 to 2011 she worked at Delft University of Technology in the Department of Biomechanical Engineering. In 2007 she was a Researcher at the Intelligent Mechanical Systems Group. Dr. Chmarra obtained her MS degree in mechatronics (specialization in biocybernetics and biomedical engineering) from Warsaw University of Technology in 2002 and her PhD in 2009.
Tetsuo Tomiyama has been a Professor of intelligent mechanical systems in the Faculty of Mechanical Engineering and Marine Technology at Delft University of Technology since July 2002. Between 1998 and 2002 he was Professor for research into artifacts in the Center for Engineering at the University of Tokyo, and between 1987 and 1998 he was an Associate Professor in the Department of Precision Machinery Engineering at the same university. Dr. Tomiyama's current research projects include multidisciplinary product development, bioinspired intelligent mechanical systems (such as cellular machines, self-maintenance machines, evolvable machines, and adaptable machines), control software generation, life cycle simulation, and service computer-assisted design.



