I. INTRODUCTION
Perovskite oxides (general formula ABO3) have attracted the attention of researchers for their applications in electronic industry due to their unique ferroelectric (FE), pyroelectric, piezoelectric, and dielectric properties.Reference Bhalla, Guo and Roy1–Reference Sundell, Björketun and Wahnström8 Alkaline earth metal zirconates (BaZrO3, SrZrO3) are assumed to be potentially important materials because of their applicationsReference Erb, Walker and Flukiger9–Reference Chen, Duncan, Chawala, Koopman and Janowski11 in multilayer ceramic capacitors, piezoelectric and pyroelectric sensors, dynamic random access memories, wireless communication devices, refractories, and heterogeneous catalysis. PbZrO3 is also an important material for energy storage devices due to the antiferroelectric (AFE) to FE phase transition.Reference Singh12 PbZrO3 has been extensively focused for its microwave dielectric properties but it shows dielectric relaxation near microwave frequencies.Reference Lanagan, Kim, Jang and Newnham13 Barium zirconium oxide shows photoluminescence at room temperature,Reference Macario, Moreira, Andres and Longo14 radio luminescence,Reference Moreira, Volanti, Andres, Montes, Valerio, Varela and Longo15 and is a good refractory material with a high melting point (2600 °C), weak thermal conductivity, and low thermal expansion coefficient.
A large number of methods have been used to prepare metal zirconates such as coprecipitation,Reference Brzezinska- Miecznik, Haberko and Bucko16 alkoxide sol–gel,Reference Veith, Mathur, Lecerf, Huch, Decker, Beck, Eiser and Hacerkorn17 hydrothermal, solid state,Reference Erb, Walker and Flukiger9 chemical decomposition of an oxalate precursor, or combustion technique using oxalic hydrazide.Reference Sengupta, Ma and Payne18 Ba1−xPbxZrO3 is also prepared at high Pb concentration (x ≥ 0.25) using reverse micellar routeReference Ahmad and Ganguli19; however, low concentration was not attempted by this method. These methods have several disadvantages. The alkoxide sol–gel process utilizes expensive precursors and requires careful control of the atmosphere; however, the coprecipitation method requires cations with similar solubility. Among the nonconventional wet chemical processes of obtaining oxide materials, the alkoxide sol–gel method is mostly used and studied as well. The process represents the formation of an inorganic polymeric network by reactions in the solution at low temperatures. Some disadvantages of alkoxide sol–gel methods are high cost of raw materials as alkoxide is hardly available or only at very high costs, large shrinkage during processing, residual fine pores, residual hydroxyl, residual carbon, health hazard of organic solution, long processing time.Reference Radev, Samuneva, Mihailova, Pavlova and Kashchieva20 The polymeric citrate precursor, commonly referred as Pechini method, is usually considered as a particular type of sol–gel procedure. An alkoxide sol–gel procedure does indeed utilize more expensive reagents than those used in the Pechini method. The polymeric citrate precursor method (Pechini method) has many advantages over the above said methods like synthesis of homogeneous and monophasic multicomponent oxides with uniform shape and size. Furthermore, small particle size and high surface area may be achieved due to slow grain growth at low processing temperature. The polymeric citrate precursor method is very cost-effective as it requires only inexpensive chemicals, glassware, and a furnace. This method involves a polyesterification reaction among citric acid and ethylene glycol, which leads to the formation of the three-dimensional polymer gel network, and metal ions are immobilized in the cavity of the network.
There is no report on the entire solid solution of Ba1−xPbxZrO3 using the polymeric precursor route. In this paper, we report the synthesis of Ba1−xPbxZrO3 (0 ≤ x ≤ 0.75) using polymeric citrate precursor method. The characterization of dielectric oxides has been carried out in detail using x-ray diffraction (XRD), transmission electron microscopy (TEM), and surface area studies. The density and dielectric properties were also investigated.
II. EXPERIMENTAL
A. Chemicals required
Barium acetate (Qualigens, Mumbai, India; 99.5%), zirconium oxychloride (CDH, New Delhi, India; 99%), lead acetate trihydrate (Merck; 99%), ethylene glycol (SD Fine-Chem Ltd., Mumbai, India), and citric acid (Spectrochem, Hyderabad, India; 99%). All the chemicals were used without any further purification, and the aqueous solution of metal salts were prepared in double distilled water.
B. Synthetic procedure
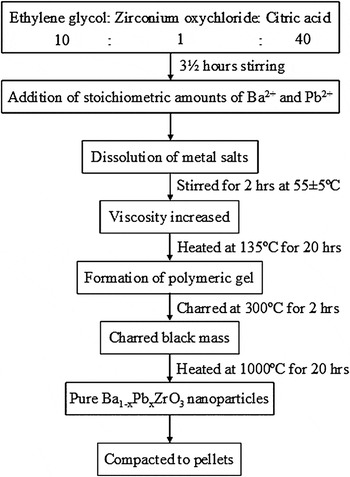
1.4 mL of ethylene glycol was taken in a clean beaker to which 25 mL of 0.1 M ZrOCl2 solution was added under constant stirring. The mixture was stirred for about 10 min to obtain a clear transparent solution. Then, 21.0135 g of dried citric acid was slowly added into this solution in such a way that the molar ratio of ethylene glycol:citric acid:zirconium oxychloride were fixed at 10:40:1. A whitish precipitate was observed immediately after adding citric acid to the solution. The reaction mixture was kept on stirring at room temperature for about 3.5 h until all the citric acid dissolved and a clear solution was obtained. Stoichiometric amounts of 0.1 M Ba2+ and Pb2+ solutions were added to ethylene glycol:citric acid:zirconium oxychloride solution. On complete addition of these metal acetate solutions, the mixture became turbid. The mixture was then stirred for 4–5 h. At this stage, the solution was further stirred with controlled heating at a temperature of 55 ± 5 °C for 2 h, so that a viscous appearance is observed. It was then kept in an oven at 135 ± 5 °C for 20 h to evaporate the solvent and promote polymerization. The solution became a black viscous resin. This resin was charred in a muffle furnace for 2 h at 300 °C and then cooled to room temperature. The resin turned into a black mass, which was ground to a fine powder. This ground black mass is referred to as the precursor. The precursor was further heated at 500 °C for 20 h in the muffle furnace. The powder became gray in color. It was again ground in an agate mortar–pestle and then annealed at 900 °C for 12 h followed by 1000 °C for 20 h in a microprocessor-controlled high-temperature furnace. Light yellow powder of Ba1−xPbxZrO3 was obtained, which was compacted into pellets at a pressure of 3 tons and then sintered at 1000 °C for 8 h. The flowchart depicting the various steps involved in the synthesis procedure is shown in Fig. 1.
Schematic representation for the polymeric precursor synthesis of Ba1−xPbxZrO3 (x = 0, 0.05, 0.10, 0.15, 0.20, 0.25, 0.50, and 0.75).

To investigate the phases in the solid solutions, XRD studies have been carried out on Bruker D8 Advance x-ray diffractometer (Bruker AXS, Karlsruhe, Germany) with Ni-filtered Cu Kα radiations of wave length (λ) = 1.54056 Å. The XRD data were recorded in a 2θ range of 20° to 70° with the step size of 0.05° and step time of 1 s. The raw data were subjected to background correction and Kα2 lines were stripped off.
The particle size and morphology of the samples were examined by JSM 6390 LV scanning electron microscope (SEM; JEOL, Tokyo, Japan) and Morgini 268-D FEI TEM (FEI, Hillsboro, OR). TEM specimens were prepared by taking a small amount of the finely ground powder sample, which was then dispersed in absolute ethanol with the help of an ultrasonic bath and sonicated for about 45 min. A drop from the micropipette (about 100 μL volume) of this dispersion sample was then placed on a copper grid coated with carbon film. The TEM grid samples were then placed in an oven to dry at ambient temperature before examining.
The surface area of the samples was recorded at liquid nitrogen temperature (77 K) using BET surface area analyzer (Model: Nova 2000e; Quantachrome Instruments Limited, Boynton Beach, FL) by using “Multipoint BET Method.” The samples were degassed at 250 °C for 3 h to remove contaminants such as water vapor and adsorbed gases from the sample. From the BET plot, the specific surface area was calculated using the BET equation. The pore parameter analysis is carried out with the help of Dubinin–Astakhov (DA) model, which is based upon the microporous adsorption phenomenon. Dielectric properties of the samples were measured by high frequency LCR [Inductance (L), Capacitance (C), and Resistance (R)] meter (Model: 6500 P; Wayne Kerr, West Sussex, UK). The powder sample was mixed with two to three drops of 5% polyvinyl alcohol (PVA) and dried in an oven at 90 °C for 1 h. The powder was then compacted to pellets at a pressure of 3 tons. The pellets were then sintered at 1000 °C for 8 h followed by the coating with silver paste on both the surfaces of the pellets and annealed at 100 °C for 1 h. Before the dielectric measurements, the thickness and diameters of all the pellets were recorded to calculate the value of dielectric constant from the measured value of capacitance. Density measurement of the powder samples were carried out by Micromeritics AccuPyc ІІ 1340 gas pycnometer (Micromeritics Instrument Corporation, Norcross, GA).
III. RESULTS AND DISCUSSION
A. Powder XRD studies
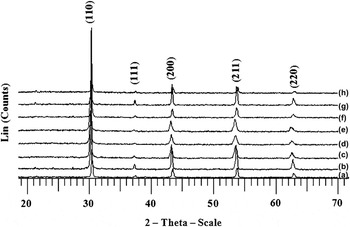
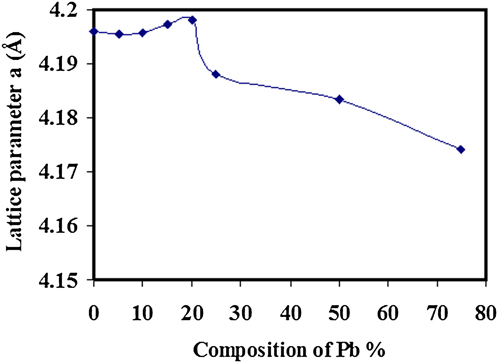
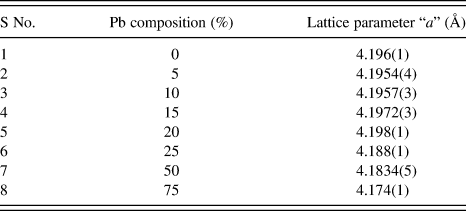
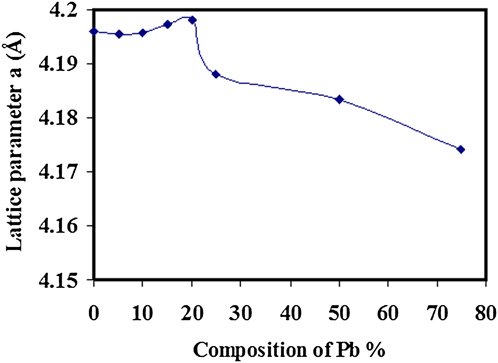
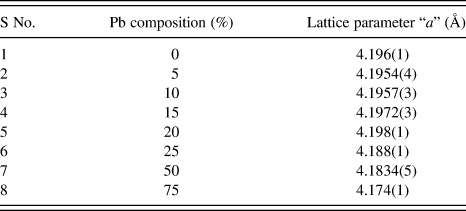
Figure 2 shows the XRD of Ba1−xPbxZrO3 (x = 0, 0.05, 0.10, 0.15, 0.20, 0.25, 0.50, and 0.75) obtained by heating the precursors at 1000 °C for 20 h in air. All the diffraction peaks are very sharp showing the crystalline nature of the nanoparticles and indexed with the cubic BaZrO3 (JCPDS No. 74-1299). However, the reflections are slightly shifted toward lower angle of diffraction up to x = 0.20. The peak broadening is also observed, which increases up to x = 0.20, indicating the nanocrystalline nature of the particles. The shifting of peaks toward higher angle of diffraction is observed as the composition of Pb increases beyond x = 0.20. The lattice parameters were calculated using the CELL software. It can be clearly seen from Fig. 3 that the refined lattice parameter remains nearly the same at lower lead concentration up to x = 0.20; however, after x = 0.20, the lattice parameter decreases. This may be due to the lattice contraction because of the smaller ionic radius of Pb2+ (1.19 Å) compared to Ba2+ (1.35 Å) and suggests the lead incorporation at the barium site. The variation of lattice parameters of Ba1−xPbxZrO3 with composition “x” is shown in Table I.
XRD pattern of Ba1−xPbxZrO3 for x = (a) 0, (b) 0.05, (c) 0.10, (d) 0.15, (e) 0.20, (f) 0.25, (g) 0.50, and (h) 0.75.

Plot for the variation of lattice parameter of Ba1−xPbxZrO3 with composition “x.”
Variation in lattice parameter “a” of Ba1−xPbxZrO3 with composition “x.”
B. Electron microscopic studies
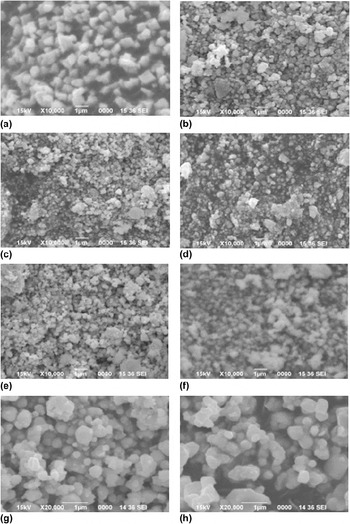
The morphological studies of the solid solutions have been carried out using SEM. The SEM images of Ba1−xPbxZrO3 are shown in Fig. 4. Analysis of these results shows that these solid solutions consist of monodispersed uniform grains of different morphologies. SEM image of pure BaZrO3 shows that the particles are highly monodisperse, uniform, and cubic in shape [Fig. 4(a)]. However, on incorporating Pb in BaZrO3, hexagonal particles were also appeared along with cubic particles [Figs. 4(b)–4(h)]. The grains show marginal agglomeration; however, the extent of agglomeration increases on increasing lead concentration.
SEM images of Ba1−xPbxZrO3 for x = (a) 0, (b) 0.05, (c) 0.10, (d) 0.15, (e) 0.20, (f) 0.25, (g) 0.50, and (h) 0.75.

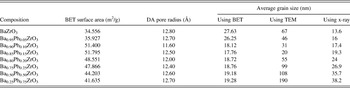
TEM micrographs of Ba1−xPbxZrO3 (x = 0, 0.05, 0.10, 0.15, 0.20, 0.25, 0.50, and 0.75) showed cuboidal shape of the particles (except for x = 0.20, which is spherical) with average grain size ranging from 20 to 190 nm (Fig. 5). The grain size decreases on increasing the Pb concentration up to x = 0.15; thereafter, the size increases on increasing the Pb concentration. It has also been observed that the grain size increases from 20 nm for Ba0.85Pb0.15ZrO3 to 190 nm for Ba0.25Pb0.75ZrO3 (Table II). The particles show highly agglomeration for x = 0.25 and 0.50 lead concentration. The TEM images seem to be agglomerated; therefore, to predict the actual grain size using the TEM micrographs is quite difficult. Thus, the grain size of the nanoparticles has been calculated by the x-ray line broadening studies using Scherrer’s formula. This investigation shows that the crystallite size of the nanoparticles increases systematically from 13 to 38 nm with the increase of the lead content (Table II). The increase in grain size with lead content may be associated to the low melting point of lead oxide, which leads to the grain growth.
TEM micrographs of Ba1−xPbxZrO3 for x = (a) 0, (b) 0.05, (c) 0.10, (d) 0.15, (e) 0.20, (f) 0.25, (g) 0.50, and (h) 0.75.

BET surface area, DA pore radius, and particle size of Ba1−xPbxZrO3 obtained from TEM, BET, and XRD.

C. BET surface area studies
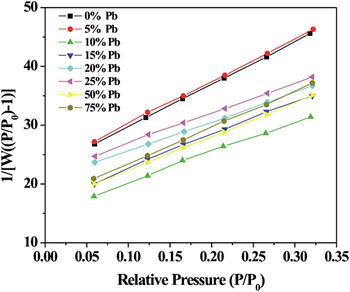
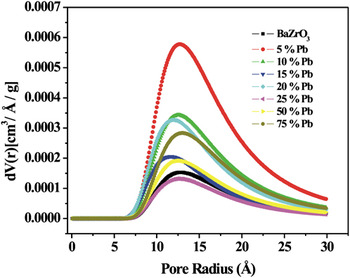
The specific surface area was determined using multipoint BET method. Figure 6 shows the BET plot of Ba1−xPbxZrO3 nanoparticles. The specific surface area of these samples was in the range of 34.6–51.8 m2/g. This is comparatively much higher relative to undoped BaZrO3Reference Boschini, Rulmont, Cloost and Moreno21–Reference Kirby, Riessen, Buckley and Wittorff23 and PbZrO3.Reference Boopathy, Nesaraj and Rajendran24 Surface area first increases up to x = 0.15 and then decreases. Simultaneously, pore radius decreases up to x = 0.15 and then starts increasing. Pore size distribution plot of these solid solutions is shown in Fig. 7. The observed variation in surface area and pore size can be correlated to the decrease in the particle size on increasing the dopant concentration up to x = 0.15. The average particle size of these nanoparticles can be calculated using the equation: D BET = 6000/(ρS w),Reference Li, Ikegami, Wang and Mori25 where D BET is the average diameter of the particle in nm, ρ is the density in g/cm3, and S w is the measured surface area of nanoparticle in m2/g. The particle size calculated using the above equation comes out to be 27.6, 26.3, 18.1, 17.8, 18.7, 18.8, 19.2, and 19.3 nm respectively. These results show that particle size decreases on increasing the surface area. Table II summarizes the variation of particle size with BET surface area and DA pore radius of Ba1−xPbxZrO3 nanoparticles.
BET plot of Ba1−xPbxZrO3 for x = (a) 0, (b) 0.05, (c) 0.10, (d) 0.15, (e) 0.20, (f) 0.25, (g) 0.50, and (h) 0.75.

DA plot of Ba1−xPbxZrO3 for x = (a) 0, (b) 0.05, (c) 0.10, (d) 0.15, (e) 0.20, (f) 0.25, (g) 0.50, and (h) 0.75.

D. Dielectric properties
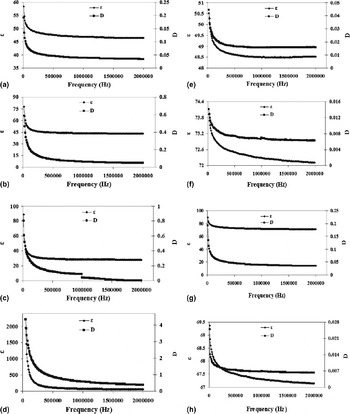
The dielectric constant and dielectric loss were measured on the sintered disks (1000 °C) of nanostructured barium lead zirconates as a function of frequency and temperature as shown in Figs. 8 and 9. Figures 8(a)–8(h) show the variation of dielectric constant and dielectric loss as a function of frequency for the solid solutions of barium lead zirconate at 1000 °C, measured at room temperature. The measurement has been carried out in the frequency range 20 Hz to 2 MHz. The dielectric constant and dielectric loss of BaZrO3 were 46.9 and 0.039, respectively, at 1 MHz [Fig. 8(a)]. The value of dielectric constant is higher than the earlier reported value.Reference Yamaguchi, Komatsu, Otobe and Murakami26–Reference Levin, Amos, Bell, Farber, Vandrah, Roth and Toby28 The dielectric constant and dielectric loss were highly stable with frequency. However, dielectric constant first decreases up to 150 °C, remains stable till 300 °C, and thereafter increases, while dielectric loss increases continuously on increasing the temperature [Fig. 9(a)]. The dielectric constant and dielectric loss for Ba0.95Pb0.05ZrO3 were measured at room temperature at 1 MHz and found to be 43.6 and 0.063, respectively [Fig. 8(b)]. Both the dielectric constant and dielectric loss were stable with frequency. However, the temperature variation studies show that both dielectric constant and dielectric loss decrease with temperature up to 100 °C, remain stable till 300 °C, and thereafter increases [Fig. 9(b)]. The dielectric constant and dielectric loss for Ba0.90Pb0.10ZrO3 at 1 MHz come out to be 43.6 and 0.041, respectively. The variation of dielectric constant and loss with frequency is nearly constant [Fig. 8(c)]. However, the dielectric constant remains stable till 300 °C, thereafter increases, and dielectric loss was found to increase on increasing the temperature [Fig. 9(c)]. The dielectric constant for Ba0.85Pb0.15ZrO3 showed a maximum value of 75.5, which is stable with frequency, while the dielectric loss comes out to be 0.57, which showed a slight decrease on increasing the frequency [Fig. 8(d)]. The dielectric constant was constant till 300 °C and thereafter increases at higher temperatures [Fig. 9(d)]. However, dielectric constant remains stable till 200 °C. The dielectric constant for Ba0.80Pb0.20ZrO3 at 1 MHz was 48.5 with the loss of 0.016. The dielectric constant and dielectric loss were stable with frequency [Fig. 8(e)]. The dielectric constant first decreases with temperature up to 100 °C and thereafter remained constant till 400 °C. However, dielectric loss remains stable till 100 °C and thereafter increases at higher temperatures [Fig. 9(e)]. For Ba1−xPbxZrO3 (x = 0.25), the dielectric constant was 72.3 at 1 MHz, which slightly decreases with frequency; however, the dielectric loss comes out to be 0.0069, which is nearly constant with frequency [Fig. 8(f)]. On further increasing the Pb concentration to 0.75, dielectric constant decreases. Note that the dielectric constant increases with the increase of temperature, which may be related to extrinsic contributions to permittivity, as inferred from the high losses increasing with temperature.
Plot for the variation of dielectric constant and dielectric loss of Ba1−xPbxZrO3 for x = (a) 0, (b) 0.05, (c) 0.10, (d) 0.15, (e) 0.20, (f) 0.25, (g) 0.50, and (h) 0.75 with frequency.

Plot for the variation of dielectric constant and dielectric loss of Ba1−xPbxZrO3 for x = (a) 0, (b) 0.05, (c) 0.10, (d) 0.15, (e) 0.20, (f) 0.25, (g) 0.50, and (h) 0.75 with temperature at 1 MHz.

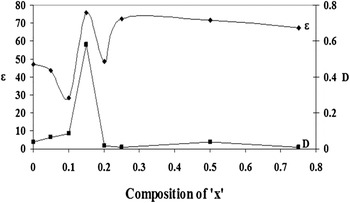
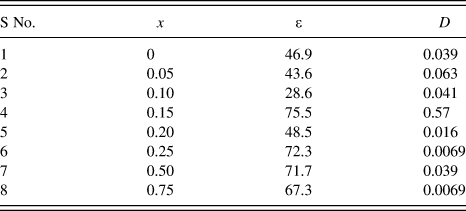
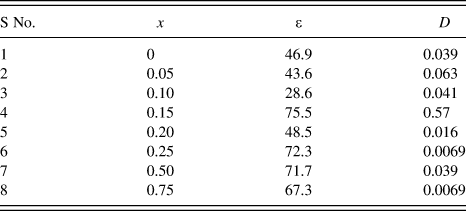
The variation of dielectric constant and dielectric loss of Ba1−xPbxZrO3 with composition “x” is listed in Table III and shown in Fig. 10. This shows that the dielectric properties could be strongly affected by the lead substitution on the barium lattice. It can be clearly seen from the table that the dielectric constant first decreased up to x = 0.10 and then obtained maximum value (ε = 75.5) at x = 0.15. The maxima in the dielectric constant as well as in the dielectric loss are observed due to the paraelectric (PE) behavior in the Ba-rich compositions. The dielectric properties of (Bal−xPbx)ZrO3 have been studied earlierReference El-Harrad, Becker, Nedelec, Handerek, Ujma and Dmytrow29, Reference Pokharel and Pandey30 with x > 0.65, which revealed strong influence of the introduction of Pb ions onto the Ba sublattice on the AFE–FE and FE–PE phase transition temperatures and compositional width of the FE phase. Note that in our studies on nanocrystalline Ba1−xPbxZrO3, we do not see any sign of the AFE → PE transition.
Variation of dielectric constant and dielectric loss of Ba1−xPbxZrO3 with composition at room temperature and at a frequency of 1 MHz.

Dielectric parameters of Ba1−xPbxZrO3 with composition at room temperature and at a frequency of 1 MHz.
E. Density measurement
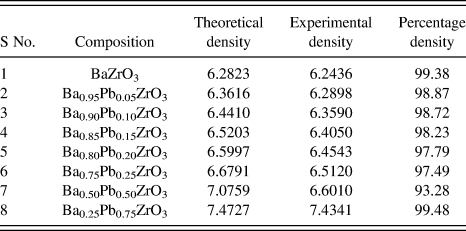
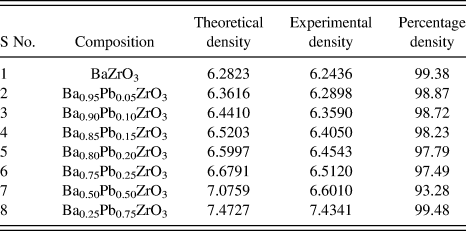
Density measurements of these solid solutions have been carried out and found to be in the range of 93.3–99.5% of the theoretical density. Table IV summarizes the theoretical and experimental density of Ba1−xPbxZrO3 (0 ≤ x ≤ 0.75).
Theoretical, experimental, and percentage density of Ba1−xPbxZrO3 (0 ≤ x ≤ 0.75).
IV. CONCLUSIONS
Solid solutions of Ba1−xPbxZrO3 (0 ≤ x ≤ 0.75) have been successfully synthesized using polymeric citrate precursor method. This is the first report on the synthesis and properties of entire range of solid solutions of Ba1−xPbxZrO3 (0, 0.05, 0.10, 0.15, 0.20, 0.25, 0.50, and 0.75). XRD studies indicate the highly crystalline and monophasic nature of these solid solutions after heating at 1000 °C. These oxides were monodisperse, nearly uniform, and cubic in shape. The average particle size increases on increasing the lead content. Highest surface area of 51.8 m2/g with smallest grain size (20 nm) for x = 0.15 has been achieved for the first time. The dielectric constant of the solid solution of Ba0.85Pb0.15ZrO3 showed a maximum value of 75.5.
ACKNOWLEDGMENTS
The present research is a result of an international collaboration program between the University of Tabuk, Tabuk 71491, Saudi Arabia, and Jamia Millia Islamia (Central University), New Delhi 110025, India. The authors gratefully acknowledge the financial support from the University of Tabuk. M.U. thanks Tabuk University for fellowship.