Introduction
The Amery Ice Shelf (AIS) is the largest ice shelf in East Antarctica and buttresses the Lambert Glacier catchment basin, which accounts for 16% of the total mass of the East Antarctic Ice Sheet (Fricker et al. Reference Fricker, Hyland, Coleman and Young2000). The AIS ice front is near 69°S, which is much further north than the ice fronts of the larger Ross and Filchner–Ronne ice shelves at ∼78°S and ∼74–78°S, respectively. The AIS may, therefore, have a much greater likelihood of rapid warming-induced retreat than these other ice shelves (Scambos et al. Reference Scambos, Hulbe, Fahnestock and Bohlander2000, Lemke et al. Reference Lemke, Ren, Alley, Allison, Carrasco, Flato, Fujii, Kaser, Mote, Thomas and Zhang2007). Indeed, the AIS shares some characteristics with smaller ice shelves on the Antarctic Peninsula that have recently collapsed - annual surface meltstreams and extensive crevassing. Surface meltstreams of the AIS normally originate in the blue ice region in the southern part of the ice shelf (Phillips Reference Phillips1998) but the areal extent has increased in recent years; in 2002–03, meltstreams were observed as far north as Gillock Island near 70.5°S (Fig. 1). There is extensive crevassing in the east, which persists all the way from Gillock Island to the ice front, and in another region on the western side downstream from Jetty Peninsula (see Fig. 1 for location) as described by Lacroix et al. (Reference Lacroix, Legresy, Coleman, Dechambre and Remy2007). Increased surface temperatures would lead to increased surface meltwater which, if it penetrated the crevasses, could contribute to an ice shelf breakup similar to that experienced by the Larsen B Ice Shelf in 2002 (e.g. Scambos et al. Reference Scambos, Hulbe and Fahnestock2003). Another mechanism that might predispose the AIS to collapse is infiltration of warmer seawater into the lower marine-ice layer of the ice shelf in some sections (Craven et al. in press). The AIS has two bands of accreted marine ice up to 200 m thick north-west of Jetty Peninsula (Fricker et al. Reference Fricker, Popov, Allison and Young2001), the lower ∼100 m of which is highly porous (Craven et al. Reference Craven, Carsey, Behar, Matthews, Brand, Elcheikh, Hall and Treverrow2005) and therefore more susceptible to rapid melting.
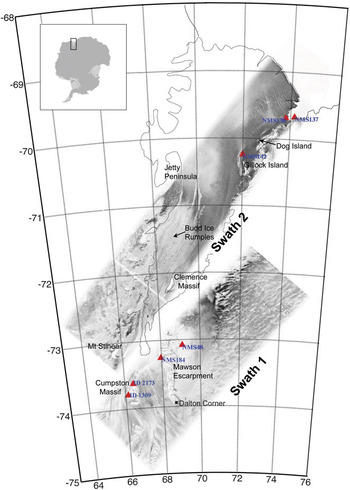
Location map of Amery Ice Shelf in East Antarctica, showing some of the geographical features discussed in the text. Overlain are ERS SAR amplitude swath images along orbits used for constructing differential SAR interferograms. Locations of ground control points used for image geolocation are shown as red triangles (NMS138 = Landing Bluff, NMS 137 = Ham Peak, NSM142 = Corry Rocks, NMS48 = Cruise Nunataks, NMS184 = Harbour Head, ID 2173 [Australian Gazetteer] = Patrick Point on Cumpston Massif, ID 1309 = Cumpston Massif). GZ and ice front outlines are from Fricker et al. (Reference Fricker, Young, Allison and Coleman2002a, Reference Fricker, Allison, Craven, Hyland, Ruddell, Young, Coleman, King, Krebs and Popov2002b).

Continuous observations of ice shelves over long periods are required to determine stability and to monitor change. Typical parameters that are monitored are: surface elevation (e.g. Shepherd et al. Reference Shepherd, Wingham, Payne and Skvarca2003), ice flow velocity (e.g. Rignot & MacAyeal Reference Rignot and MacAyeal1998, Joughin Reference Joughin2002, Young & Hyland Reference Young and Hyland2002), and the location of the grounding line (GL), the location at which the ice sheet first begins to float (Rignot Reference Rignot1998a, Reference Rignot1998b; Fig. 2). Migration of the GL can be quite large in regions with rapid secular trends in ice thickness and low bedrock slopes, such as Pine Island Glacier (Rignot Reference Rignot1998a). For the AIS, King et al. (Reference King, Coleman, Morgan and Hurd2007) reported on trends in the velocity from 1968–1999 and found no net change during this time. King et al. (Reference King, Coleman, Freemantle, Fricker, Hurd, Legrésy, Padman and Warner2009) show that, while there have been fluctuations in elevation change rate of order 0.1 m a-1 over the period 1968–2007, the long-term trend for that period was near zero. These studies suggest that the AIS has been in overall steady state for at least several decades.
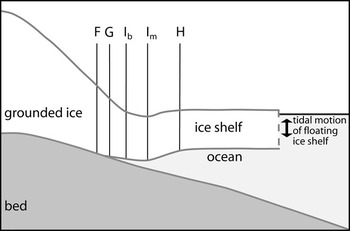
Schematic representation of features of the GZ: F is the landward limit of ice flexure from tidal movement, G is the limit of ice flotation, i.e. the grounding line, Ib is the break-in-slope, Im is the local elevation minimum; and H is the landward limit of the hydrostatic zone of free-floating ice shelf, or the seaward limit of ice flexure. Vertical scale is greatly exaggerated. We define the region between F and H as the GZ, which is typically several kilometres wide. The exact distances between F, G, H, Ib and Im depend on local ice thickness and properties, and local bedrock topography and properties. Adapted from Vaughan (Reference Vaughan1994) and Fricker & Padman (Reference Fricker and Padman2006).

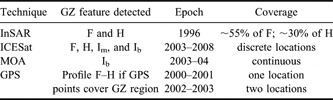
In this paper, we present a new map of the grounding zone (GZ) of the AIS. The GZ is the region of the ice sheet straddling the GL, encompassing the transition from fully grounded ice to ice in hydrostatic equilibrium with the underlying ocean. We use datasets acquired by a variety of remote sensing techniques in the epoch 1995–2007 (Table I). The different datasets are not contemporaneous, and each data type identifies distinct features of the GZ as shown in Table I and explained further below. Since there is no evidence of change in either velocity or elevation over this 13–year period, we assume that the ice shelf dynamics (and hence the GZ) have remained in steady state during this epoch, and use the datasets to develop a benchmark map of the GZ against which future change can be monitored. The new GZ map updates previous work of Fricker et al. (Reference Fricker, Allison, Craven, Hyland, Ruddell, Young, Coleman, King, Krebs and Popov2002a) and includes several regions of grounding that have not previously been documented, including several ice rises. These ice rises are pinning points that tend to stabilize the ice shelf upstream of the ice rise but may weaken the shelf downstream. We also identify specific features of the GZ that provide insight into how the grounded and floating ice is coupled across the GZ. Accurate knowledge of the GZ and sub-ice shelf cavity geometry, including ice rises, pinning points, ephemeral grounding points and basal channels, is required for models of the ice shelf and ice-ocean interactions. Here, we concentrate primarily on mapping the GZ: recent improvements in our understanding of the shape of the sub-ice shelf cavity have been reported by Hemer et al. (Reference Hemer, Hunter and Coleman2006) and Galton-Fenzi et al. (Reference Galton-Fenzi, Maraldi, Coleman and Hunter2008).
Techniques used to detect AIS GZ features in this study, with epochs and coverage.

Detecting the ice shelf GZ
The GZ, shown schematically in Fig. 2, is the transition region between the fully grounded ice sheet and the free floating ice shelf. The latter oscillates vertically in response to tides, atmospheric loading and other oceanic processes. Grounding occurs whenever the ice shelf comes into contact with bedrock around its perimeter and its islands and ice rises.
The surface expression of the GZ includes several distinct features that can be identified from in situ and remotely-sensed surface measurements. The landward limit of tidal flexure (Point F in Fig. 2) occurs some distance inland from the grounding point, G. The hydrostatic point (H) is the location seaward of which the ice shelf is in hydrostatic balance with the underlying ocean. The width of the GZ across which the ice flexes (between points F and H) is typically a few kilometres and is related to the flexural wavelength of the ice, which depends on the ice thickness, Young’s modulus for the ice (a function of the ice temperature profile) and density difference between ice and the sub-shelf seawater (Holdsworth Reference Holdsworth1969, Vaughan Reference Vaughan1995, Turcotte & Schubert Reference Turcotte and Schubert2001, Rabus & Lang Reference Rabus and Lang2002).
There is often a local elevation minimum between G and H (Point Im in Fig. 2). Many elevation profiles across the GZ also show a break-in-slope (Point Ib in Fig. 2); i.e. a narrow region where the surface slope rapidly changes from large values typical of the edge of the grounded ice sheet to small values more typical of floating ice. For the idealized ice sheet shown in Fig. 2, the break-in-slope (Point Ib) is between Point G and the elevation minimum just offshore. However, there is not always an elevation minimum, and in some areas Point Ib can be landward of the GL (e.g. Fricker & Padman Reference Fricker and Padman2006).
Historically, the GZ has been detected in field data by identifying the limit of tide-induced vertical displacement or tilt (point F). Instruments used for these studies include tiltmeters (Stephenson et al. Reference Stephenson, Doake and Horsfall1979, Riedel et al. Reference Riedel, Nixdorf, Heinert, Eckstaller and Mayer1999), static Global Positioning System (GPS) (Riedel et al. Reference Riedel, Nixdorf, Heinert, Eckstaller and Mayer1999) and kinematic GPS (Vaughan Reference Vaughan1994, Reference Vaughan1995). The ocean-induced vertical displacement in the GZ can also be detected in interferometric synthetic aperture radar (InSAR) images (e.g. Goldstein et al. Reference Goldstein, Engelhardt, Kamb and Frolich1993, Rignot Reference Rignot1998a, Reference Rignot1998b, Gray et al. Reference Gray, Short, Bindschadler, Joughin, Padman, Vornberger and Khananian2002). Higher accuracy can be achieved with differential synthetic aperture radar interferometry (DSI), a technique that uses the assumption of constant ice shelf velocity between different InSAR image pairs to identify the flexure limits F and H (Rignot Reference Rignot1998b, Rabus & Lang Reference Rabus and Lang2002). F is the landward limit of the dense fringe band, which has also been referred to as the “hinge-line” (Rignot Reference Rignot1998a, Reference Rignot1998b), and H is the seaward limit of the fringe band. Synthetic aperture radar (SAR) techniques (InSAR and DSI) have dramatically increased knowledge of the Antarctic ice sheet’s GZ, including a short section of the southern portion of AIS (Rignot Reference Rignot2002).
The ocean-induced vertical displacement can also be detected with repeat-track analysis of data from NASA’s Ice, Cloud and land Elevation Satellite (ICESat) laser altimeter. ICESat data have high along-track resolution (50 to 70 m diameter footprints every ∼172 m) and a per-shot accuracy of ∼14 cm (Shuman et al. Reference Shuman, Zwally, Schutz, Brenner, DiMarzio, Suchdeo and Fricker2006); this accuracy and resolution enables ICESat to detect the tide-induced difference in elevation from one repeat pass over ice shelves. This technique has been used to accurately locate the landward and seaward limits of flexure (points F and H) in the southern part of the FRIS (Fricker & Padman Reference Fricker and Padman2006) and we are in the process of mapping other regions.
Less direct approaches to locating the GZ take advantage of the change in ice sheet surface slope near the GL (point G in Fig. 2) associated with the abrupt change in basal stress as the basal ice interface changes from bed (rock or till) to water, leading to rapid dynamic thinning of the ice in the along-flow (seaward) direction. This slope change (point Ib in Fig. 2), can often be seen in profiles of elevation in along-track ICESat altimeter data (Fricker & Padman Reference Fricker and Padman2006) and in satellite optical imagery as a change in surface shading (Scambos et al. Reference Scambos, Haran, Fahnestock, Painter and Bohlander2007). The break-in-slope can also be retrieved from analyses of high-resolution digital elevation models (Horgan & Anandakrishnan Reference Horgan and Anandakrishnan2006). The association between the break-in-slope and the GL is not, however, robust: Fricker & Padman (Reference Fricker and Padman2006) showed from ICESat profiles that the break-in-slope can be several kilometres landward of G and sometimes seaward of H. Decoupling of the break-in-slope from the GL is common at the edges of ice plains such as on Pine Island Glacier (Corr et al. Reference Corr, Doake, Jenkins and Vaughan2001) and in the southern FRIS (Fricker & Padman Reference Fricker and Padman2006). In other circumstances, there may be multiple nearby breaks-in-slope that could potentially be associated with the GL.
The hydrostatic point H can also be estimated through buoyancy calculations. Fricker et al. (Reference Fricker, Allison, Craven, Hyland, Ruddell, Young, Coleman, King, Krebs and Popov2002a) used this approach to estimate the AIS GZ location along much of the ice shelf perimeter by comparing surface elevations from the radar altimeter (RA) on the European Remote Sensing satellite, ERS-1, with those inferred from ice thickness measured by radio-echo sounding (RES) assuming buoyancy. This technique demonstrated that the southern extent of the GZ was ∼240 km further south than previously thought, and extended ∼120 km into a narrow (∼30 km wide) channel bounded by Mawson Escarpment and Mount Stinear (see Fig. 1 for locations). The accuracy of this method is, however, limited due to several factors: i) RA performance is compromised over rough, steep terrain and the elevation estimates are only accurate in regions with low roughness and low slopes, ii) RA track spacing during the ERS-1 geodetic phase (168 day repeat) in 1996 over the AIS was only ∼2–3 km, iii) there are significant uncertainties in the geoid model used to convert RA ellipsoidal heights to geoid-based heights, and in the column-averaged ice density used to convert ice elevations to thicknesses (this problem is not restricted to RA), and iv) it is sometimes difficult to identify basal returns in the RES data. In many regions, these limitations led to a total uncertainty in the location of point H on the order of 10 km.
Digitisation of satellite imagery has helped to guide GZ definition, but this technique only identifies the break in slope (e.g. Scambos et al. Reference Scambos, Haran, Fahnestock, Painter and Bohlander2007). Based on the new Landsat Image Mosaic of Antarctica, an International Polar Year project ASAID promises to deliver a better GL for all of Antarctica by using a combination of the interpretation-based point Ib mapping and photoclinometry (essentially quantifying the point Ib interpretation; Robert Bindschadler, personal communication 2008). However, as noted previously, there are regions where point Ib is not a good indicator of the GL.
From the available techniques, the best mapping of the edges of the GZ (points F and H in Fig. 2) comes from direct observation of the displacements caused by ocean surface height variations, i.e. from InSAR (especially DSI) and ICESat repeat-track analyses. Recall, however, that the GL (point G) is slightly seaward of point F. Other techniques relying on identification of surface shape features (points Ib and Im) or hydrostatic calculations without time-dependent information can provide general guidance on GZ location, but with potentially large errors that sometimes exceed 10 km.
Detecting the AIS GZ
In this section, we describe the satellite techniques used in this study to identify the AIS GZ. The GZ can also be located and characterized using data from GPS receivers deployed at multiple locations on the ice sheet and shelf; see, for example, Riedel et al. (Reference Riedel, Nixdorf, Heinert, Eckstaller and Mayer1999). For larger ice shelves, however, mapping is impractical with GPS techniques. In this present study we only use GPS data to validate our satellite-derived GZ location and structure around specific features of interest; see the GPS validation section.
Methods: satellite techniques for mapping the AIS GZ
Differential SAR interferometry
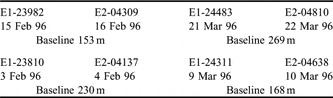
We used data from the tandem mission of ERS-1 and ERS-2 (Fig. 1; Table II). During the tandem mission, the ERS-1 and ERS-2 satellite were exactly one day apart with an orbital repeat period of 35 days; i.e. the SSIs are derived from tandem pairs separated by one day, while the SSI pairs used in the DSIs are each separated by 35 days. While more data are available from single-satellite missions, their longer time separations give insufficient coherence on the AIS surface. All SAR images were processed using the software SIOSAR (Sandwell & Price Reference Sandwell and Price1998). Single SAR interferograms (SSIs) were first constructed from each tandem pair (two along each track). DSIs were then constructed from the pairs of SSIs.
Details of SAR tandem pairs used to construct the two DSIs presented in this paper (see Fig. 1 for their location), including acquisition dates and baselines (i.e. the distance perpendicular to the satellite flight direction between the first and second image of each pair). E1 = ERS-1, E2 = ERS-2. Five digit numbers are the ERS orbit numbers.

We geolocated the individual SAR Single Look Complex (SLC) images in the DSIs by identifying and locating specific ground control points, using feature recognition based on Geoscience Australia/Australian Antarctic Division maps and aerial photographs (Fig. 1). Once offsets in range and azimuth of the SAR SLC images due to factors such as squint angle and clock errors were found, we geolocated swaths by calculating the position of the spacecraft at the time of every radar echo using precise orbits provided by Delft University. We “flattened” the interferogram to remove the fringe and phase effects due to the shape of the Earth’s ellipsoid (Sandwell & Price Reference Sandwell and Price1998). We reduced the effect of topography on the phase (due to slightly different viewing geometry; i.e. the differential baseline) over the floating ice using a 1 km Digital Elevation Model (DEM) for the AIS, made from ERS RA data (Fricker et al. Reference Fricker, Hyland, Coleman and Young2000). We note that near-GZ surface topography can have significant variability below the resolution of this DEM, and that RA-based elevation mapping is difficult in the high relief GZ area. However, at the time of processing this was the best available DEM for the region.
We identified two swaths that each had two sets of tandem pairs over the AIS (Fig. 1): the edge of Swath 1 crosses the far southern portion of the AIS, and the longer Swath 2 extends almost the entire length of the AIS from the south-west to the north-east.
Visible satellite imagery
We used the Moderate-resolution Imaging Spectroradiometer (MODIS) Mosaic of Antarctica (MOA) 125 m image product, available from the National Snow and Ice Data Center (NSIDC). Full details of the MOA can be found in Scambos et al. (Reference Scambos, Haran, Fahnestock, Painter and Bohlander2007), but a short summary is given here. The MOA is a digital image mosaic compiled from 260 MODIS images acquired during the 2003–04 summer (November 2003 and February 2004). The products (a visible-band image mosaic and a surface snow grain size map) were derived from MODIS bands 1 and 2 using orbit swath data. Multiple images of all areas were combined in a data cumulation scheme (Scambos et al. Reference Scambos, Kvaran and Fahnestock1999) to improve spatial resolution and increase radiometric content of the mosaics. The component images were de-striped, geo-registered, and re-sampled to a projection grid using the MODIS Swath-to-Grid Toolbox (MS2GT) software (Haran et al. Reference Haran, Fahnestock and Scambos2002). A 125 m ground-equivalent polar stereographic projection was used, identical to previous radar image mosaics and similar to several other continent-wide datasets. Geolocation accuracy of the final mosaics is ∼50 m. For this study, we applied several contrast stretches to the MOA in the AIS area to enhance features for tracking the break-in-slope.
ICESat repeat-track analysis
ICESat was launched in January 2003, and since October 2003 has operated in ‘campaign style’ in which data have been acquired during the same 33 day sub-repeat of a 91 day orbit, two or three times per year (see Table III for dates of all ICESat campaigns). For each campaign, we obtained parameters from Release 428 of the GLA12 product; this was the highest release available at the time of analysis.
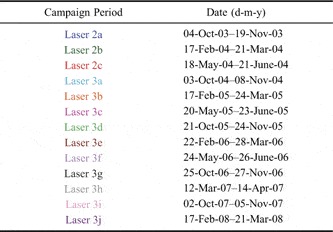
Acquisition dates for the thirteen 91-day ICESat campaigns acquired through March 2008. For each campaign, text colour corresponds to coloured lines on Fig. 6.

We used a repeat-track analysis technique (Fricker & Padman Reference Fricker and Padman2006) to locate flexure limits on the AIS where the ICESat tracks cross the GZ. Release 428 ICESat elevation data are routinely corrected for ocean and load tide using the GOT99.2 model. Since we need to detect vertical tidal displacements, we retided the GLA12 elevations, i.e. added back the applied tide corrections that are provided on the GLA12 product. We also applied the saturation correction provided on the GLA12 product. We used the gain and energy parameters to filter for clouds, generally discarding repeats for which gain > 30. We resampled to 55 m along-track (interpolating between adjacent spots from the campaign tracks to a fixed reference track sampled every 55 m) so that tracks can be differenced. For each track, we used all cloud-free repeats to calculate the mean and then calculated the elevation anomaly (i.e. the difference of each repeat from the mean). The actual locations for ICESat repeats can deviate from the reference ground track by up to 150 m, which can lead to a topographic artefact from the cross-track slope. We have developed a method to remove this cross-track slope but the technique is not suited to the present study of the GZ, since the tidal variation at each repeat-track acquisition time induces an additional artificial slope into the fitted plane.
To aid our analysis we used tidal predictions calculated for the nearest floating point using a new high-resolution (2 km) barotropic tide model for the AIS and Prydz Bay region (hereafter called the “AIS-2 km model”). This model is similar to the Circum-Antarctic Tidal Simulation (CATS) model described by Padman et al. (Reference Padman, Fricker, Coleman, Howard and Erofeeva2002), but has much higher resolution, an improved GL, and a new water column thickness map based on work by Galton-Fenzi et al. (Reference Galton-Fenzi, Maraldi, Coleman and Hunter2008). These updates significantly improve the model accuracy (as determined from comparisons with GPS records from the AIS). The tidal predictions for the times corresponding to the set of tracks used in the elevation anomaly plots are shifted to have zero mean, consistent with the elevation anomaly data. Comparing these adjusted tide values with the corresponding elevation anomalies improves our confidence that we are looking at true time variability of the floating ice. We also used the MOA-derived point Ib to guide our selection of the ICESat-derived point Ib.
Several factors combine to make the ICESat repeat-track analysis technique less effective on the AIS than for some other regions of Antarctica: i) the spacing between adjacent tracks at these relatively low latitudes is large (average track spacing is 27.7 km at 70°S), ii) the trough-to-peak tidal amplitude (∼1.5 m) is relatively low (e.g. the spring tidal range along the Siple Coast and on the Weddell Sea ice shelves is > 3 m), iii) the ice surface is rough and crevassed, especially in the east, and iv) annual summer melting in the southern and central AIS (Phillips Reference Phillips1998) changes the properties of the surface and degrades ICESat measurement performance. In the southern GZ, other challenges in interpreting ICESat elevations include large topographic gradients and high ice flow velocities (up to 1600 m a-1). In some areas minor ice elevation features are advected downstream across the GL, contributing to elevation anomalies. An awareness of these issues guided our selection and interpretation of the ICESat data in the Amery GZ.
Results
InSAR
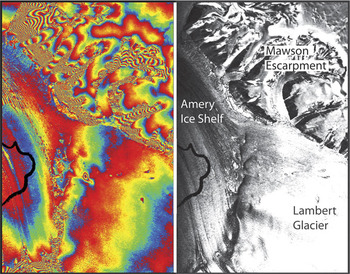
The DSIs made from the SAR swaths shown in Fig. 1 are presented in Figs 3 & 4. Over the floating ice, the major contributor to the observed phase difference in DSIs is usually the vertical displacement of the ice shelf due to tides and the inverse barometer effect (IBE), the latter being the ocean’s response to changes in atmospheric pressure. Other, usually minor, contributors are orbit and atmospheric correction errors, local mass changes due to precipitation, firn compaction, basal ice melt or accretion, and variations in the sub-shelf seawater density. The GZ appears in the DSIs as a zone of closely-spaced fringes representing the rapid change in the magnitude of ice surface elevation response to oceanic processes, from zero on the fully grounded ice landward of point F to approximate hydrostatic balance seaward of point H. The spatial gradient of this vertical motion through the GZ is much larger than the typical gradients of ocean tidal elevation and the IBE over the hydrostatic portion of the ice shelf, and thus the fringes can usually be interpreted as the flexural response of the ice. We digitized the two fringes that define the fringe band, one corresponding to the landward edge of the GZ and the other corresponding to the seaward edge. The landward edge represents the limit of ice flexure, or point F, not the GL (point G in Fig. 2). The seaward fringe is often impossible to identify because of the small variability of ocean height at the times of the four SAR images used in each DSI (discussed later): we only map the seaward fringe when it is clearly defined.
Left plot: portion of Swath 1 DSI (see Fig. 1 for location) covering just the south-eastern portion of the AIS and adjacent ice sheet. Right plot: SAR amplitude image over same region. This area just captures a small portion of the south-eastern part of the AIS GZ. The hydrostatic H-line of Fricker et al. (Reference Fricker, Allison, Craven, Hyland, Ruddell, Young, Coleman, King, Krebs and Popov2002a) is shown as a black line.

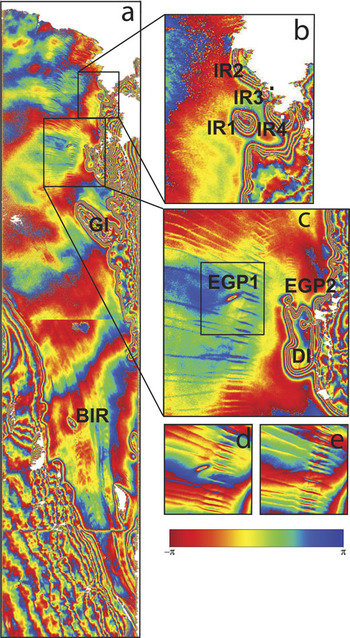
a. DSI for Swath 2; see Fig. 1 for location. Note the slight discontinuity in phase where we joined two portions of the swath, and a phase anomaly due to a missing line in the data files. Gillock Island (GI) and Budd Ice Rumples (BIR) are indicated, b. zoom of the north-eastern AIS and the four small ice rises (IR1-4) near Landing Bluff and Sansom Island (Landing Bluff is indicated by a white square and Sansom Island as a black square), c. zoom of a grounded region north of Gillock Island (Dog Island; DI), and features EGP1 and EGP2, d. & e. single SAR interferograms over EGP1 (d shows t1-t2 and e shows t3-t4).

The DSI for Swath 1 in the southernmost region of the AIS defines the location of the landward limit of flexure (point F) along a limited portion of the GZ (Fig. 3). It also confirms the results of earlier buoyancy calculations that the GZ extends this far south (Fricker et al. Reference Fricker, Allison, Craven, Hyland, Ruddell, Young, Coleman, King, Krebs and Popov2002a). A DSI for this same region using the same SAR scenes has been previously published elsewhere (Rignot Reference Rignot2002; his Fig. 7b) but we show it here for completeness and include the data in our final GZ product.
The fringe pattern in the DSI for Swath 2 (Fig. 4) reveals some interesting features of the AIS.
i) There is a region of grounding towards the southern part of the AIS that has been known for decades but not documented in the scientific literature (BIR on Fig. 4). The feature is an ice rise whose official name “Budd Ice Rumples” was approved in 2003 by the Antarctic Names Committee (SCAR ID 17380). We suspect that this is the feature that the 1966 field party mistook to be the ice shelf GL (Budd et al. Reference Budd, Corry and Jacka1982).
ii) On the south-eastern side of Gillock Island (GI in Fig. 4), the inner SAR fringe does not close. This suggests that either a) the channel between the island and the ice shelf is so narrow that the ice is flexurally supported across it such that it is not at hydrostatic equilibrium, or b) the island is joined to the mainland at low tide (i.e. the channel landward of Gillock Island is not permanent).
iii) North-east of Gillock Island there is a new region of grounding that was not previously known; we refer to this feature as “Dog Island” (DI in Fig. 4; Galton-Fenzi et al. Reference Galton-Fenzi, Maraldi, Coleman and Hunter2008). While there is a surface expression of this feature evident in satellite imagery (MOA), the region was not previously classified as grounded.
iv) There are four small ice rises (bedrock pinning points) in the north-east of the ice shelf (IR1–4 near Landing Bluff and Sansom Island in Fig. 4).
v) There are two small regions where there are closed fringes, but fewer fringes than on nearby fully grounded ice. These features resemble the DSI expressions of ephemeral grounding points (EGPs), which are ice rises or rumples at which grounding occurs only during low tidal states (Schmeltz et al. Reference Schmeltz, Rignot and MacAyeal2001; their Fig. 2). We therefore identify them as EGP1 and EGP2, with one and three fringes respectively, compared to four fringes at nearby DI. However, as described below, there are other potential causes of the anomalies in fringe count, and one or both of these features may not be a true EGP.
Causes of vertical displacements observed in DSI Swath 2
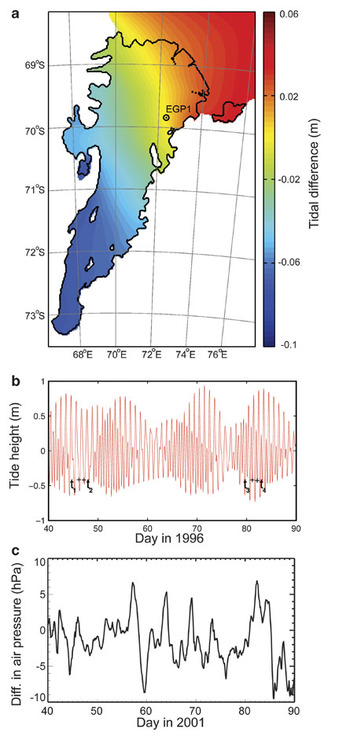
In most circumstances, the dominant contributor to the ice shelf vertical displacement observed by InSAR is the ocean tide. To examine this for DSI Swath 2 (Fig. 4), we computed the tide heights for the times of the four SAR acquisitions using our high-resolution (2 km) barotropic tide model for the AIS and Prydz Bay region (“AIS-2 km”). Denoting the tides at the four pass times as ζi (i = 1, 2, 3, 4), we calculate the tidal contribution to the DSI as Δζ = (ζ4-ζ3)-(ζ2-ζ1). A typical value of tide-induced Δζ in other DSI studies is of the order of several tens of cm (Marjorie Schmeltz, personal communication 2002). In our case, however, modelled Δζ values range from -7 cm in the southern part of the ice shelf to +4 cm in the north-east near the ice front (Fig. 5a); i.e. there is a gradient along the ice shelf but |Δζ| < 7 cm everywhere on the AIS for this DSI. This reflects the poor sampling of tidal variability in the AIS by the ERS tandem mission, for which the time separation for image pairs in each SSI is 1.0 days. The tide heights were not only comparable for all four passes contributing to the DSI but were also all close to local low tide (Fig. 5b).
a. Difference in tidal amplitudes, computed from the AIS-2 km tide model, between the four SAR passes of Swath 2 DSI: Δζ = (ζ4-ζ3)-ζ2-ζ1). The difference is largest in the southern portion of the ice shelf and changes sign between the north-eastern (> 0) and south-western (< 0) parts of the ice shelf, b. Predicted tidal heights at EGP1 for the time period of the DSI, indicating the tidal state for each of the four SAR passes (ti is the time of the ith pass) and showing that all four images were acquired near low tide. c. Differences in atmospheric pressure for AWS on the AIS (AM02) for the same time of year as in Fig. 5b but in 2001, as a guide to likely magnitude of the inverse barometer effect.

In the north-eastern section of the ice shelf there are four fringes defining the GZ (see Fig. 4), corresponding to approximately -11.2 cm of displacement in the radar line of sight (each DSI fringe represents -2.8 cm of displacement in the look direction, which corresponds to vertical motion of the ice shelf if flattening has been performed and the contributions from topography are completely removed). Even allowing for errors due to uncorrected topography, this value is inconsistent with the predicted tidal contribution of 0–4 cm in that location (Fig. 5a), suggesting that some other effect is dominating the vertical displacement in this region.
The largest contributor to Δζ, in the absence of a significant tidal signal, is generally the IBE, which is the tendency of the ocean to adjust to variable atmospheric pressure (P air) to maintain the local total pressure (ocean plus atmosphere) at the seabed (Chelton & Enfield Reference Chelton and Enfield1986). The IBE is typically at a rate of ∼1.0 cm of ocean elevation decrease per 1 hPa increase in P air at frequencies below ∼0.5 cycles per day. This motion is easily detected with GPS measurements on ice shelves (Padman et al. Reference Padman, King, Goring, Corr and Coleman2003) and provides a contribution to the DSI that can be of order 10 cm; see, e.g. table II in Rignot et al. (Reference Rignot, Padman, MacAyeal and Schmeltz2000). Unfortunately, there were no pressure records available on the AIS at the time that the tandem-mission SAR images were obtained in 1996. Later records from an Automatic Weather Station (AWS) installed on the AIS in 1999 indicate that variations of P air are sufficient to provide a signal of order 10 cm to the measured Δζ (Fig. 5c).
Ephemeral Grounding Points (EGPs)
The points that we tentatively interpret here as EGPs appear in DSI Swath 2 (from 1996) as small, isolated areas of large spatial phase gradients. That is, they look like small ice rises, but they have fewer fringes than we count at the nearby GL. Features with this property were identified on FRIS by Schmeltz et al. (Reference Schmeltz, Rignot and MacAyeal2001). To improve our understanding of the possible cause of the signal around one of these features (EGP1), we examined the two SSIs that made up the DSI. We found that EGP1 was visible in the first SSI (t1–t2; Fig. 4d), but not in the second (t3–t4; Fig. 4e). The modelled tide heights at EGP1 at the times t1–t4 were all in the range -42.7 to -41.5 cm; thus, tidal motion alone cannot account for the observed signal.
We suggest two hypotheses to explain this observation: i) some process other than tides leads to partial grounding on a bedrock high in this region, or ii) localized and rapid change of surface elevation occurs at this site between t1 and t2.
If we interpret the fringe pattern around EGP1 in terms of partial grounding at either t1 or t2, we require a source of ocean height variability (other than tides) with sufficient magnitude to depress the ocean surface to the point where local grounding can occur on a bedrock high. The most likely source, on these short time scales, is the IBE. The observations from the two SSIs (Fig. 4d & e) are consistent with Pair(t2)-Pair(t1) ≠ 0 and Pair(t4)-Pair(t3) ≈ 0. Since we do not have local measurements of Pair on the AIS when the SAR images were collected, we cannot confirm this hypothesis. If it is true, however, the mean (tide free) water column thickness between the ice-shelf-base and the bedrock high must be ∼0.5 m. Recent grids of bathymetry for AIS (e.g. Galton-Fenzi et al. Reference Galton-Fenzi, Maraldi, Coleman and Hunter2008) have a minimum of at least 100 m for water column thickness near EGP1, with no sign of an ice rise of the required magnitude. However, there are no bathymetry data available at the location of EGP1, so that the gridded water column thickness is interpolated from data some distance away from this site.
Prompted by an anonymous reviewer of the paper, we also considered the possibility that the feature may represent the rapid and localised subsidence of the ice shelf surface between t1 and t2. Plausible mechanisms include an “icequake” (suggested by the reviewer), collapse (compaction) of a firn layer (a “firn quake”), and collapse of snow/ice bridges across crevasses. The icequake interpretation is supported by the observation that the observed fringe pattern was aligned ∼45° to the flow direction, roughly parallel with a ∼10 km long crevasse (visible in MOA, but ∼4 km downstream because of ice flow between the 1996 DSI acquisition and the 2003/04 MOA epoch). The signal may, therefore, be due to differential vertical displacement of adjacent blocks within this active shear zone, or along crevasses. We expect that firn quakes and collapse of snow/ice bridges would also be localised and associated with the crevasse fields typical of this region. We note that the dual frequency RA study of Lacroix et al. (Reference Lacroix, Legresy, Coleman, Dechambre and Remy2007) showed a significant difference in RA elevations derived at Ku and S band frequencies in this region, highly correlated with crevassed regions covered by snow/ice bridges (their Fig. 1).
We also considered whether advection of an ice surface elevation anomaly could explain the fringe pattern. However, the pattern is visible in the SSI for days t1 and t2 (just one day apart), implying advection of only ∼1 m between scenes. Thus, the interpretations above, either ephemeral grounding or differential fracture/crevasse movement, are our best hypotheses at this time.
MOA
The break-in-slope (point Ib of Fig. 2) has been traced in MOA for the entire Antarctic continent and the nearby ice blanketed islands. The ice shelf front and bedrock coastline have also been digitized from the mosaic. Both datasets are associated with the epoch of the image set used to create the mosaic (summer 2003/04); see earlier section. The data are available upon request from the National Snow and Ice Data Center.
Several islands within the AIS were missed in the MOA digitizing effort, and we revisited those features for this study. They included the Clemence Massif, Robertson Nunatak and Budd Ice Rumples (all previously known), and Dog Island and the five ice rises near the AIS front (IR1 to IR5 all newly mapped in this study). The MOA coastline and GL datasets will be updated and corrected continent-wide later.
ICESat
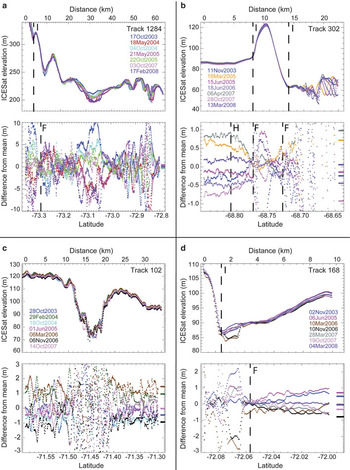
Depending on the challenge for each particular track, we selected the repeats used for the analyses based on season, proximity of repeats to the reference track, or tidal state. Examples of repeat-track data are shown in Fig. 6: the locations of all ICESat tracks across the AIS are shown in Fig. 7, with their associated picks for F, H and I annotated. Track 1284 shows the combined effect of changing surface properties, high ice velocities and repeat-track offsets on the repeat-track data for a short section of the track across the southern GZ near 73.07°S (Fig. 6a). In this region, surface elevation on this track varies by ∼100 m over 15 km. For this track and the adjacent track to the east (Track 302), points F and H were difficult to identify because the non-tidal contributions to elevation in this area were larger than elsewhere on the ice shelf.
Selection of ICESat repeat-track results across AIS GZ. All panels a–d show WGS-84 elevations along ICESat repeat-tracks in the top plot, and differences of the repeat-track elevations from the mean (elevation anomalies) in the bottom plot. The short coloured lines at the right borders of the elevation-anomaly plots are the corresponding predicted relative tidal displacements (differences from mean) from the AIS-2 km tide model. a. Track 1284 across the southern GZ shows the limit of flexure and a large signal at 73.07°S due to the changing nature of the surface (summer melting), b. Track 302 crosses a pinning point at the north-west ice front (IR5 on Fig. 7), which raises the ice surface by ∼35 m for ∼5 km along-track, c. Track 102 shows a significant depression in the ice surface downstream of Budd Ice Rumples, d. Track 168 shows a high elevation anomaly on the grounded ice within the GZ, which we interpret as a surface melt pond or lake.

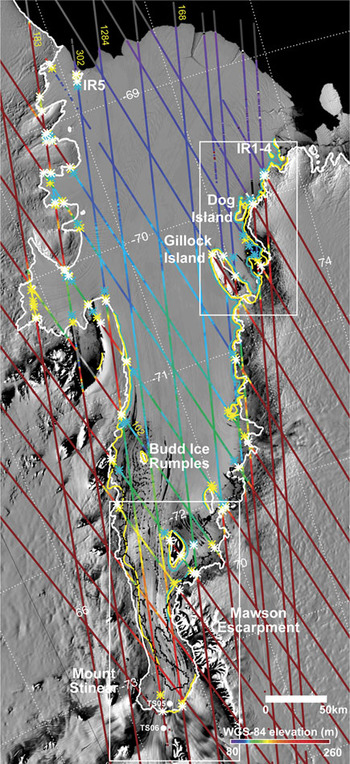
MOA over entire AIS (epoch of 2003–2004 summer) with ICESat tracks (colour-coded with WGS-84 elevation and annotated with track number) and the different GZ features identified. The locations of the five newly mapped ice rises (IR1–4 near the north-eastern ice front and IR5 in the north-west) are indicated. The locus of the landward and seaward limits of flexure (points F and H) from InSAR are shown by the yellow and blue lines, respectively. The ICESat picks for points F, H and I are also shown (yellow, cyan and white asterisks, respectively). Also shown is the Ib line estimate from MOA (white line), and the locus of H derived from hydrostatic calculations (black line; Fricker et al. Reference Fricker, Allison, Craven, Hyland, Ruddell, Young, Coleman, King, Krebs and Popov2002a). The locations of two GPS records (TS05 and TS06) either side of the GL in the southern AIS are indicated (see also Fig. 8a). White rectangles delineate areas that are shown at larger scale in Fig. 8a & c.

Some tracks crossed the GZ more than once (e.g. Tracks 183 and 302; see Fig. 7), giving multiple opportunities for GZ picks. We confidently identified all three GZ points (F, H and Ib) at many of the GZ crossings; however for some crossings we could only identify point Ib or point F. An example of a “clean” GZ signal is shown in Fig. 6b (Track 302) where all three points are easily identified on the southern side of the newly identified ice rise (IR5) near the north-western ice front (see Fig. 7).
Overall, we obtained 60 locations of point F, 56 of point Ib and 33 of point H. We estimate the associated location uncertainties for each of these picks at ∼170 m (the ICESat shot-to-shot spacing) for points F and Ib. The seaward limit of flexure (point H) is more difficult to locate precisely. The gradients and the rate of divergence of the ICESat elevation anomaly profiles, i.e. the visual features used to identify F in the (noisy) residual signal, tend to change abruptly near point F (see Fig. 6b). As the seaward limit of flexure (H) is approached and the ice settles to hydrostatic equilibrium, the gradient of the elevation anomaly tends to zero; we locate H at the point where it first becomes zero. Elastic-beam modelling (Jeremy Bassis, personal communication 2007) also suggests that the ice can slightly overshoot hydrostatic equilibrium before settling to a true equilibrium about one GZ width further seaward. These characteristics of the seaward limit imply that visual selection of point H from elevation anomaly plots will be sensitive to: ice shelf surface texture recorded along-track, orientation of tracks relative to the GL, width of the GZ, and noise in ICESat elevations relative to the maximum vertical displacement due to tides and other ocean processes. As described above, we attempted to mitigate these sources of uncertainty for each track by using the best set of repeats to optimise tidal range and signal quality. We dealt with each track on a case-by-case basis; in some cases this meant only using the two repeats that were close together in space and time, but with large tidal range. The resulting estimate of uncertainty in location of point H is different for each track; however, from reviewing the AIS ICESat tracks and several hundred tracks from other sections of GZ around Antarctica, we estimate a typical uncertainty of ∼300 m for point H.
The ice rise IR5 near the north-western ice front seen in ICESat Track 302 has an area of ∼50 km2 area estimated from MOA. The elevation anomalies on the grounded ice of the ice rise are due to cross-track slope effects. The flexure zone upstream (south) of this pinning point is well defined, while downstream the surface is rougher and the flexure zone is harder to locate. An embayment in the AIS front (which is named on local maps as Mackenzie Bay) downstream of IR5 may be related to the disruption of ice flow by IR5.
Further south, Track 102 shows a topographic dip of ∼50 m downstream (north) of Budd Ice Rumples (Fig. 6c). This dip and the crevasses downstream result from local disturbance of ice by the ice rumples. From speckle-tracking analyses of RADARSAT SAR data, we know that ice flows faster on the east side of this feature than on the western side (Joughin Reference Joughin2002, Young & Hyland Reference Young and Hyland2002).
Track 168 shows a large elevation anomaly south of the landward limit of flexure (point F) near Clemence Massif (Fig. 6d). We interpret this feature as a surface melt pond or lake, draining between June 2005 and March 2006, and filling between November 2006 and March 2007.
Comparison of AIS GZ from different satellite techniques
We plotted the results of mapping the GZ, using the different satellite techniques described in the methods section, on MOA (Fig. 7, with two regions shown at larger scale in Fig. 8). As noted above, each technique identifies different features associated with the GZ (Table I). The MOA analysis tracks the continuous line of the break in slope (point Ib in Fig. 2), while ICESat repeat-track analysis identifies point Ib at discrete points. The landward limit of flexure (point F in Fig. 2) is provided by InSAR (the landward fringe) and also by ICESat. The locus of the hydrostatic point H is approximated by the InSAR seaward fringe, and is also estimated at discrete points by ICESat. In general we find that the H-points derived from ICESat are seaward of the H-line mapped by InSAR. We hypothesize that this is because the four SAR images used to generate the DSI were acquired during low tide (Fig. 5b), whereas the ICESat data were acquired at varying tidal states, capturing a larger tidal range and therefore more flexure. This results in a wider flexural boundary layer than inferred from the InSAR results at the ICESat locations. Based on estimates of our ICESat-derived locations for points F and H, most values of the GZ width are in the range ∼0.5–6 km, but three values (∼10%) exceed ∼7 km, with the largest value being ∼12 km.
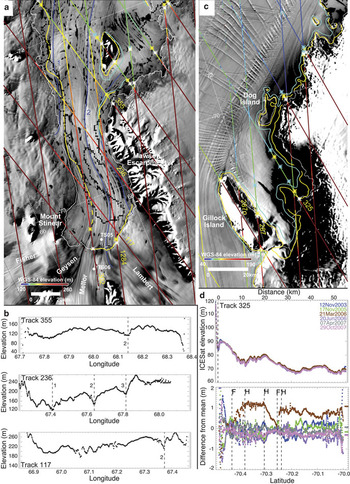
a. MOA over the southern AIS with ICESat tracks (colour-coded with elevation; with a decreased range cf. Fig. 7) and the different GL estimates overlaid (all lines are the same as in Fig. 7). Yellow dashed line is the inferred location of the locus of point F along the suture zone between Geysen and Mellor ice streams. ICESat elevation lows are aligned with three major ice shelf flowlines (dark blue lines, numbered 1, 2 and 3 on image and in ICESat profiles below). b. ICESat elevations along three tracks that cross the southern part of the AIS GZ. c. MOA over the north-eastern AIS with ICESat tracks and GL estimates overlaid. Track 287 had several of its repeats off-pointed to a Target of Opportunity (Track 287o). d. ICESat elevations and elevation anomalies for Track 325 showing that points F and H were derived based on primarily on one repeat acquired at high tide. Predicted relative tidal displacements (shifted to zero mean) are shown at right of the elevation anomaly plot.

In the southern part of the ice shelf, there are large discrepancies (of order 10 km) in the location of specific GZ features determined from different techniques (Fig. 8a). In the south-east, the locations for point F determined from ICESat are consistent with InSAR (Swath 1) and with point Ib obtained with MOA. However, west of ICESat Track 302 there is no InSAR. A single ICESat-based identification of point F on Track 302 is ∼15 km north and ∼20 km east of the MOA estimate of point Ib. Further north, on the western side of the southern channel of the AIS, point F from InSAR Swath 2 lies a few kilometres east of the MOA point Ib. Although InSAR and ICESat data are not available from the south-west corner of this channel, the available data are consistent with the landward limit of flexure lying along the flowband separating ice from the Mellor and Geysen glaciers. This interpretation places the GL for the Fisher and Geysen glaciers several tens of kilometres downstream of the location based on MOA point Ib, with potentially significant implications for modelling the ice flow in this region and the ocean’s interaction with the ice base along the deep GL of the southern AIS. The sections of these two glaciers between point Ib and the estimated location of the landward flexure limit (point F) are reminiscent of ice plains previously reported by Corr et al. (Reference Corr, Doake, Jenkins and Vaughan2001) and Fricker & Padman (Reference Fricker and Padman2006). We note that the MOA results for point Ib were not easy to select in this area so that MOA, by itself, only poorly constrains the general location of the GZ. However, the observations point to a methodology by which high-resolution mapping of Ib using MOA can be improved by guidance from the more spatially intermittent data provided by ICESat and InSAR.
Different estimates for point H have previously been made in the southern region using buoyancy calculations based on an ERS RA data and ice thickness from RES (Fricker et al. Reference Fricker, Allison, Craven, Hyland, Ruddell, Young, Coleman, King, Krebs and Popov2002a). In this region there is significant data loss from the RA due to rough topography; therefore, the location of H derived from this technique has a high associated uncertainty, although this is difficult to quantify. When InSAR or ICESat data for the seaward fringe are available, they define point H more accurately than buoyancy calculations.
The north-eastern part of AIS is shown at larger scale in Fig. 8c. Track 325 samples to the north of Gillock Island and has several repeats acquired at low tide, and just one at high tide (Fig. 8d). We note that our picks for F and H are heavily dependent on this one repeat. We do not think that the picks are unreasonable, and it seems that the track is sampling the edge of the flexure zone around the headland just east of the southern end of Dog Island.
We have combined the InSAR, ICESat and MOA datafiles to create a new AIS GZ database, with flags that identify whether each point corresponds to landward and seaward flexure points F and H, or the point Ib. This has been sent to A. Paul R. Cooper for inclusion in the Antarctic Digital Database and is also available through the Australian Antarctic Division Data Center.
GPS validation of GZ
Two field campaigns were conducted, in 2000–01 and 2002–03, to deploy GPS receivers to verify grounding-zone features identified from the InSAR data obtained in 1996. While GPS campaigns cannot contribute significantly to mapping of GZ features, the information from these regionally-focussed campaigns contributes significantly to our interpretation of InSAR features and our confidence in the final GZ map.
Southern GZ (2000–01)
The University of Tasmania conducted a GPS field campaign during the 2000–01 field season to the southern AIS GZ; locations of the two GPS sites (TS05 and TS06) are shown in Figs 7 & 8a. The motivation for this GPS campaign was to validate the GL location of Fricker et al. (Reference Fricker, Allison, Craven, Hyland, Ruddell, Young, Coleman, King, Krebs and Popov2002a) and to understand flexure across the GZ. TS05 and TS06 were located straddling this previously-estimated GL, 8 km downstream and 5 km upstream, respectively. TS06 observations started on 7 January 2001 and TS05 started one day later. The antenna pole at TS05 slowly melted out during the summer and eventually fell to the ground after 20 days. However, the receiver continued to collect GPS observations until 1 April 2001. The TS06 receiver had regulator problems and stopped working after about 30 days, but restarted on 8 March until losing power on 12 April. After recharging of its batteries by the solar panel, the TS06 receiver restarted again in early September 2001 but stopped working on 13 September. We only consider GPS observations in the period 8–26 January 2001, when both TS05 and TS06 were operational.
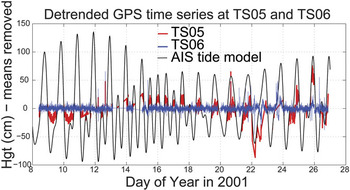
We processed the GPS data using MIT’s GAMIT/GLOBK/TRACK software (Chen Reference Chen1998). We used the nearest bedrock-mounted GPS site at Dalton Corner (see Fig. 1 for location) as a base station and computed GPS kinematic solutions using observations every 1 min over baselines of order 65 km. We removed a least-squares quadratic fit from the time series of TS05 over the period of pole fall-over, to account for this signal. For TS06, we removed a linear trend from the time series to account for the down-slope movement on the glacier. Figure 9 shows residual time series of resulting GPS heights at both sites for 19 days in January 2001. Also shown is the AIS-2 km tide model prediction at the model’s nearest ice shelf grid node, as an independent verification of whether the ice shelf was fully floating (black dashed line). The results confirmed that TS06 was located on grounded ice. At TS05, the ice shelf is floating but has reduced tidal signal (about 30% of the full tidal amplitude). This is consistent with the location of TS05, which is about one-third of the way from the GL identified by MOA point Ib and DSI Swath 1 point F to the seaward limit of flexure (point H) identified from buoyancy calculations (see Fig. 8).
Time series of detrended GPS data for 19 days in January 2001 at locations TS05 and TS06 in the southern GZ. The prediction of ocean tide height from the AIS-2 km tide model is shown as a dashed line. This model assumes that the ocean/ice-shelf system is hydrostatic to the GL.

Near Gillock Island (2002–2003)
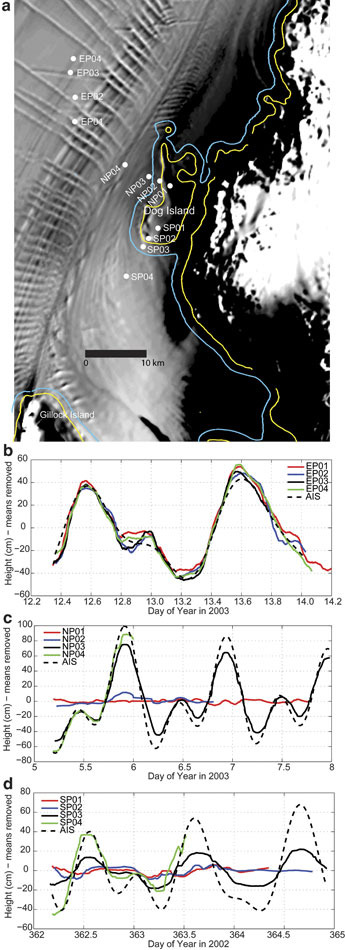
Based on our results from InSAR analysis over the AIS, we carried out GPS fieldwork in the 2002–03 summer across EGP1 and Dog Island (DI), the grounded region north of Gillock Island. The primary motivation for this survey was to validate the InSAR-derived GZ in this region, with an ancillary aim being to examine EGP1 in more detail. We deployed GPS receivers along two main profiles (Northern Profile (NP) and Southern Profile (SP)) straddling DI, with a third profile (EP) across EGP1 (Fig. 10a; Table IV). Each site was occupied for 2–3 days during a total campaign period of about two weeks. The observation rate was 30 sec for the NP and SP sites and 5 sec for the EP sites, where we expected larger movement of the ice shelf from tides and/or horizontal ice flow.
a. Site locations for 2002/03 GPS campaign plotted on MOA, with seaward (blue) and landward (yellow) limits of ice flexure from InSAR. Time series of elevation data recorded at GPS sites: b. EP01-04 (across EGP1), c. NP01-04 and d. SP01-04 (across the DI GL), for 2–3 day periods during the 2002/2003 field season days (see Table IV). Tidal predictions from AIS-2 km tide model are also shown (AIS; black dashed lines).

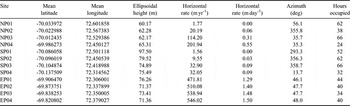
Mean positions (ITRF2000) and velocities of the 12 2002–2003 GPS sites. Total occupation time in hours for each site is given in the final column; the dates of the survey were 29 December 2002 through 14 January 2003.

We initially processed the GPS data using regional geodetic solutions based on the GAMIT/GLOBK software (King & Bock Reference King and Bock2006) and techniques described in King et al. (Reference King, Nguyen, Coleman and Morgan2000). We used all available regional data for the solutions: nine permanent International GPS Service (IGS) sites were available within the Antarctic region, and five other GPS units within the Amery area were available through other fieldwork campaigns. To assess whether the sites were floating, we determined the vertical motion of the GPS sites using two different techniques, one based on the precise point positioning (PPP) method (King & Aoki Reference King and Aoki2003, Zhang & Andersen Reference Zhang and Andersen2006) and the other from long-baseline kinematic solutions from a rock site at Landing Bluff (marked “NMS138” on Fig. 1; baselines of order 70–80 km) using MIT’s TRACK software (Chen Reference Chen1998). Both techniques gave similar results, although both had some difficulty with processing data from the Leica SR399 receivers (9 channel), producing time series that required smoothing to clearly define the vertical signal. A median filter, corresponding to about 1 hr smoothing, was used to produce Fig. 10b–d. The AIS-2 km tide model was used as an independent verification of whether the ice shelf was fully floating or whether the sites were somewhere in the GZ region (between F and H).
As an additional check on the locations of GPS sites relative to the GZ around the features seen in the DSI Swath 2, we computed regional GAMIT/GLOBK solutions to derive mean positions and velocities of the sites in the ITRF2000 reference frame (Table IV). We looked at both horizontal and vertical coordinate time series for changes associated with proximity to the GZ. The averaged horizontal rates show that the end points of the two profiles positioned on DI (i.e. NP01 and SP01) have small horizontal motion compared to the other points on the profile, which span the floating ice region between the GZ and Gillock Island (see Table IV). We therefore conclude that these points are grounded, which is consistent with the InSAR results. The other points in the profiles experience approximately north to north-easterly flow of 30–200 m a-1, indicating glacier flow around DI. The derived velocities indicate that the EP points are all moving with the main flow of the ice shelf in this region (∼500 m a-1; Young & Hyland Reference Young and Hyland2002) at azimuths of 46–48°.
More explicit evidence for the state of ice shelf grounding can be seen from the vertical GPS times series. All four EP GPS sites were floating during our observation period, with elevations corresponding closely to the modelled tides at all phases of the tidal cycle (Fig. 10b). Although the exact cause of the EGP1 signal in the DSI (Fig. 4) is undetermined, it is possible that the ice shelf thickness decreased sufficiently between 1996 (the InSAR epoch) and the GPS sampling in 2003 to preclude grounding. As we have noted above, the feature lies in a heavily crevassed and fractured zone of variable ice thickness, so that a small amount of downstream advection might significantly change the ice thickness over a bedrock high. Slight thinning of the ice shelf in this region is consistent with results reported by King et al. (Reference King, Coleman, Freemantle, Fricker, Hurd, Legrésy, Padman and Warner2009); see their fig. 5. At this time, however, we regard our hypothesis that the fringe pattern seen in the 1996 DSI is associated with partial grounding on a small bedrock high to be speculative: we cannot exclude other mechanisms such as icequakes or crevasse movement on the basis of the available data.
Time series of GPS elevations recorded at the sites across DI show progressive damping of the vertical tidal signal across the GZ (Fig. 10c & d corresponding to NP01–NP04 and SP01–SP04 respectively). Along the NP profile, NP01 shows no tidal response, which is consistent with it being fully grounded; NP02 shows evidence of small vertical motion during high tide cycles; and NP03 and NP04 appear to be fully floating. We see a similar behaviour from fully grounded to fully floating along the SP profile (Fig. 10d). SP01 is consistent with it being fully grounded, SP04 is fully floating, and SP02 and SP03 show varying degrees of tidal response. In each case the phase is the same as the modelled tides, but the amplitude is damped increasingly with distance landward, SP02 displaying ∼40% of the full tidal amplitude. The GPS measurements along both transects (NP and SP) confirm the location of the GZ from InSAR in this region. Furthermore, the fractional response of the ice shelf elevation change relative to the ocean tide and IBE seaward of H is represented by the fringes seen in InSAR.
ICESat detection of southern AIS channels
ICESat tracks across the southern part of the AIS show that there is significant topographic variation across the flow (Fig. 8a & b). Elongated ridges and valleys were first noticed in the AIS-DEM of Fricker et al. (Reference Fricker, Hyland, Coleman and Young2000), originating from the southern GZ and oriented along-flow; however, ICESat provides much finer along-track spatial detail than does the ERS RA. The inferred longitudinal channels can be seen in adjacent ICESat profiles (Fig. 8); the minima of the elevation profiles are aligned with distinct flowlines that can be traced upstream to separate ice streams (Fricker et al. Reference Fricker, Young, Allison and Coleman2002b; see flowlines numbered 1, 2 and 3 in Fig. 8). Flowline 1 is on an ice stream that flows into the AIS around 72.5°S and flowlines 2 and 3 are the western and eastern suture zones of Lambert Glacier. The channels are ∼10 km apart, 1.5 km wide and are inferred to have a relief on the ice shelf base of ∼300–500 m, given their surface expressions of ∼30–50 m and the assumption of hydrostatic balance. We note that the large elevation anomaly on Track 1284 near 73.07°S (Fig. 6a) crosses the ice shelf close to flowline 2, and propose that this significant flow feature carries supraglacial meltwater during the summer months; see Phillips (Reference Phillips1998).
These channels are similar in geometry to those reported by Rignot & Steffen (Reference Rignot and Steffen2008) for Petermann Glacier, Greenland, where the channels had 5 km spacing, 1–2 km width and 200–400 m basal relief. Rignot & Steffen (Reference Rignot and Steffen2008) found no evidence that the channels were associated with upstream glaciological features; therefore, the AIS channels may be different in their origin from the Petermann Glacier channels. However, they could perform a similar role in channelling the ocean circulation under the ice shelf. Basal channels provide preferred pathways for Ice Shelf Water generated by basal melt at the GL to flow directly northward, rather than roughly parallel to the GL as expected for “smooth” shelves due to the influence of planetary rotation. The enhanced northward flux of ISW associated with the channels may drive faster replenishment of the relatively warmer High Salinity Shelf Water into the GZ, increasing basal melt there. If this is true, channels in suture zones may have a large influence on the mass balance of the ice shelf and should therefore be incorporated into the AIS cavity geometry for ice shelf-ocean model studies. This implies that, for accurate modelling, we need information about the ice properties (flow, thickness) along the GZ at length scales of ∼1 km where these features are found.
Conclusions
We have identified several structural features of the GZ for the AIS, using a variety of remote sensing products. Using available ERS-1/2 tandem-mission InSAR data from 1996 and ICESat repeat-track analyses (2003–2008), we have accurately mapped 55% of the AIS landward limit of flexure (point F in Fig. 2). The GL for the remainder of the AIS has been estimated from the break-in-slope (point Ib) identified from MODIS imagery (2003). This method provides a continuous estimation of the GL around the perimeter and islands/ice rises, but it is inaccurate in some places. However, in the absence of any other information, it can be very useful.
The seaward limit of ice flexure (point H in Fig. 2) has been mapped previously by associating it with the hydrostatic point based on buoyancy calculations constrained by satellite RA and RES (Fricker et al. Reference Fricker, Allison, Craven, Hyland, Ruddell, Young, Coleman, King, Krebs and Popov2002a). We have updated this map in some areas using the seaward limit of fringe patterns in DSI swaths (Figs 3 & 4) and seaward limits of flexure in ICESat repeat-track data. The DSI method is, however, severely compromised for the AIS because of poor sampling of ocean tidal phase by the ERS-1/2 tandem mission (Fig. 5). Because the ICESat method samples a larger tidal range, the H-points derived from ICESat are generally seaward of the H-line mapped by InSAR. However, the ICESat method is limited by sparse track density at these relatively low polar latitudes, rough ice surface characteristics in the GZ, and loss of data due to clouds.
In some places the GL is quite different from previous maps; e.g. in the southern portion the inferred location of the GL for the Fisher and Geysen glaciers is tens of kilometres north of the GL estimated from the point Ib from MODIS imagery. There are, also, significant differences in the location of the seaward flexure limit (point H) between the buoyancy-based estimate (Fricker et al. Reference Fricker, Allison, Craven, Hyland, Ruddell, Young, Coleman, King, Krebs and Popov2002a) and InSAR and ICESat measurements, where they are available.
Several new features have been mapped for the first time in this study. A new grounded region has been identified in the InSAR to the north of Gillock Island (“Dog Island”) which was confirmed with GPS data acquired in 2002–03. From the InSAR data we also have defined the perimeters of several previously uncharted islands and ice rises in the AIS region. An additional ice rise, visible in MOA near the north-west front but not sampled by the InSAR swaths, was confirmed with ICESat repeat-track analysis. Ice rises are pinning points that can locally stabilize the ice shelf. For the AIS, IR1–5 may help determine the minimum extent of the AIS front during its periodic advance and calving retreat (Fricker et al. Reference Fricker, Young, Allison and Coleman2002b). However, IR1–5 also appear to disrupt the downstream structure and flow of the ice shelf; see ICESat track across IR-5 (Fig. 6b) and MOA background image in Fig. 7. These flow disruptions may contribute to the lateral divergence experienced by the ice front in the central portion of the ice shelf as it expands beyond the pinning points, and thus determine the maximum northward extension of the ice shelf front before calving occurs. InSAR also detected two small regions of anomalous surface elevation change that may represent ephemeral grounding points and, therefore, the presence of local bedrock highs not seen in available maps. However, other potential causes of these features exist and further study is required.
The influence of GZ features, such as suture zones between distinct glaciers and ice rises and rumples, on the surface height and thickness of the AIS is clearly seen in the high-resolution ice surface height profiles from the ICESat laser altimeter. These profiles reveal a deep trough downstream of Budd Ice Rumples and three deep, along-flow channels in the narrow southern region where the ice sheet first becomes afloat. These channels may play a role in ice shelf stability by modifying the ocean thermohaline flow that circulates buoyant meltwater away from the GL, with a subsequent replenishment of relatively warm and dense High Salinity Shelf Water into the GZ. We expect that these channels are permanent features as they are associated with permanent features of the GZ and the flow of tributary glaciers into the shelf.
The new GZ map and identification of basal channels improves our ability to model the evolution of the ice shelf through thermodynamic exchanges with the underlying ocean; i.e. basal melting and marine ice accretion. Observations of the width of the GZ (the distance between points F and H in Fig. 2) can be used to validate models of ice sheet flexure across the GZ and may ultimately contribute to understanding the variability of the structure of the ice in the GZ as represented by thickness and Young’s modulus. Knowledge of the GZ width also enables us to express tidal corrections within the GZ as a fraction of the full, seaward, hydrostatic response, and to include flexural modelling as part of the tide model within this GZ region. Improved mapping the variability of ice thickness and strength across the GZ will, ultimately, contribute to modelling of the coupling of grounded and floating ice.
The new GZ provides a benchmark database against which future measurements of GZ features can be compared for change detection studies. The dataset has been sent to the Antarctic Digital Database, with flags that identify whether each point corresponds to inner and outer flexure points F and H, or the point Ib. We intend that this more complex definition of the AIS provides a model for further development of a circum-Antarctic GZ dataset, which recognizes that a single GL location is no longer sufficient for studies of ice shelf dynamics and coupling with the sub-ice shelf ocean cavity.
Acknowledgements
We thank: Karen Chadwick for SAR processing, Rachael Hurd for GPS processing, David Sandwell for SAR processing software, Ian Joughin for SAR conversion software, Ian Allison for providing the AWS data, and Lana Erofeeva for tide modelling. ERS SAR data were provided by the Alaska SAR Facility and are copyright to ESA. We thank the Australian Antarctic Division for providing regional maps, AUSLIG/Geoscience Australia for providing aerial photos and site coordinates, and NASA’s ICESat Science Project and the NSIDC for distribution of the ICESat data (see http://icesat.gsfc.nasa.gov and http://nsidc.org/data/icesat) and NSIDC for MOA. We benefited from useful discussions with Jeremy Bassis, Glenn Hyland, Marjorie Schmeltz, Roland Warner and Neal Young. Bob Bindschadler and two anonymous reviewers deserve considerable credit for their thorough comments on earlier versions of this manuscript. Work was funded under NASA grants NRA-99-OES-10 RADARSAT to SIO, NASA grant NNG05GR58G to ESR and an Australian Research Council Grant DP0666733 to Coleman. The GPS fieldwork was supported by the Australian Antarctic Division through AAS grants held by Richard Coleman (PI) and Helen Amanda Fricker (co-I). This is ESR contribution number 103.