I. INTRODUCTION
In the near surface of plasma-facing materials, high densities of interstitials and vacancies are produced in addition to the implantation of high concentrations of helium as well as hydrogen isotopes from the plasma. These defects and gases will induce changes in the microstructure and can lead to dramatic changes in material properties. Being virtually insoluble in metals, but very mobile as shown by both theoretical Reference Becquart and Domain1 and experimental results, Reference Soltan, Vassen and Jung2 He atoms can be trapped, associate with vacancies, forming platelets and bubbles. They have been shown to contribute to swelling, cause intergranular embrittlement, and produce roughening and blistering at metal surfaces. Reference Trinkaus and Singh3–Reference Nordlund, Bjorkas, Ahlgren, Lasa and Sand5 As a consequence, the study of the behavior of helium and hydrogen isotopes in metals has attracted and still attracts very much attention. In particular, their migration properties and the interactions they can have with point defect created by irradiation as well as other defects of the materials (grain boundaries, dislocations…) are of fundamental as well as of practical interest. Reference Trinkaus6–Reference Van Veen, Caspers, Kornelsen, Pastenau, Van Gorkum and Warnaar9 It has been known for a long time now that He and H atoms bind strongly to vacancies. When no traps are available, He atoms have been shown to form clusters Reference Becquart and Domain1,Reference Wilson10 which are mobile. This propensity to form clusters is so strong that if too many He atoms are aggregated together, the system needs to relieve the strain created by the interstitial elements by the ejection of one or more matrix atoms leading to the formation of one or more Frenkel pairs (FP), i.e., vacancies and self interstitial atoms (SIAs). If no vacancy is initially present, the He cluster will be trapped by the vacancy it created, this is thus a self-trapping (ST) event as the binding energy with the vacancy is quite large. If one or more vacancies are already associated with the He cluster, the same mechanism can take place which is usually referred to as trap mutation (TM) or loop punching, if more than one SIA is created (when many SIAs are emitted at the same time, they are usually bound together also and form a dislocation loop). These FP creations make He clusters and He vacancy (nHe.mv) clusters be nonsaturable traps for themselves unlike what is observed for hydrogen atoms for instance. Reference Henriksson, Nordlund, Krasheninnikov and Keinonen11,Reference Becquart and Domain12 This is not a newly found mechanism as Evans, Reference Evans13,Reference Evans14 based on the work of Greenwood in 1959, Reference Greenwood, Foreman and Rimmer15 wrote that “plastic” deformation around an overpressurized helium bubble causes its growth by punching out single self interstitials or interstitial-type dislocation loops. FP or punched out dislocation loops have been observed experimentally in many metals: in Cu around H bubbles Reference Wampler, Schober and Lengeler16 or in Mo using a combination of transmission electron microscopy and thermal desorption spectroscopy experiments by Evans et al. Reference Evans, Van Veen and Caspers17 Some experimental evidence for punching out single SIAs has been obtained by He desorption experiments. Reference Van Veen, Caspers, Kornelsen, Pastenau, Van Gorkum and Warnaar9 In tungsten, Nicholson and Walls Reference Nicholson and Walls18 seem to be among the first ones to have obtained direct evidence of the formation of mutated traps as their field ion microscope study of subthreshold (200 eV) He implanted tungsten showed the formation of small voids and dislocation loops. TM has been observed at least by Abd El Keriem Reference Abd El Keriem, van der Werf and Pleiter19 for He in polycrystalline W and later on by Iwakiri after low-energy (250 eV) He + ion irradiations in an electron microscope linked with an ion accelerator. Reference Iwakiri, Yasunaga, Morishita and Yoshida20
From the modeling point of view, Wilson Reference Wilson, Bisson and Baskes21 used molecular statics (MS) and different interatomic potentials describing the Ni–He system and found that five interstitial He atoms can spontaneously produce a FP. An 8 He atom cluster gives rise to two such defects, and 16 helium atoms to more than five FP. Henriksson and co-workers Reference Henriksson, Nordlund and Keinonen22 studied the formation of He bubbles by molecular dynamics (MD) using their own potential. They implanted subthreshold (50, 100, and 200 eV) He ions in tungsten at 0 and 300 K and observed interstitial dislocation loop punching. More recently, self trapping in Fe was investigated by Gao et al. Reference Gao, Huiqiu Deng, Heinisch and Kurtz23 using a density functional theory (DFT) based Fe–He potential. They found that the temperature for FP formation decreases when the He cluster size increases and is close to 300 K when the size of the He cluster is larger than four atoms. The modeling of larger clusters where the He–He interaction inside the bubble relates to its equation of state has been investigated recently, for instance, in Fe Reference Stoller, Golubov, Kamenski, Seletskaia and Osetsky24 and FeCr. Reference Caro, Hetherly, Stukowski, Caro, Martinez, Srivilliputhur, Zepeda-Ruiz and Nastasi25 More complex systems have been also investigated such as the interaction of He with large defects such as grain boundaries and surfaces. Reference Hu, Hammond, Wirth and Maroudas26 At the same time, work has been done to characterize in full detail the diffusion and properties of small He clusters in Fe Reference Stewart, Osetsky and Stoller27 and in W. Reference Perez, Vogel and Uberuaga28 The accuracy of the empirical atomic potentials is always a complex issue.
In this paper, we have performed DFT calculations as well as MD simulations with a newly derived W–He potential based on DFT results Reference Juslin and Wirth29 to investigate self trapping and TM. After a brief presentation of the computation procedures, we present first the reactions and binding energies related to the ST and TM obtained using DFT and the empirical potential. The second part of this paper is devoted to the determination of the activation energy for the ST that we evaluated using both static and dynamic approaches.
II. COMPUTATIONAL PROCEDURE
A. Ab initio and MD general procedures and tools
A large number of ab initio calculations in the framework of the DFT were performed to find the ground states of configurations containing various amounts of vacancies (m ≤ 4), He atoms (n ≤ 30), and SIAs (p ≤ 4) using the Vienna Ab initio Simulation Package VASP. Reference Kresse and Hafner30
The calculations were done using Blöchl’s projector augmented-wave (PAW) method Reference Kresse and Joubert31 within the generalized gradient approximation (GGA) of Perdew and Wang. Reference Perdew and Wang32 The pseudopotentials were taken from the VASP library. The supercell approach with periodic boundary conditions was used to simulate point defects as well as pure phases. Brillouin zone sampling was performed using the Monkhorst and Pack scheme. Reference Monkhorst and Pack33 The plane wave cut-off energy was 350 eV to get converged results. 250 atoms with 8 k-points as well as 1024 atom supercells with 8 k-points were used to check the convergence of the calculations with supercell size. For clarity and because the results were converged, only the results obtained with the largest (1024 atoms) atom supercell calculations will be presented in this article. All the structures have been relaxed by conjugate gradient, keeping the volume constant. The stopping criterion for the ionic relaxation was a change in the total free energy smaller than 0.001 eV between two ionic steps. The uncertainty on the ab initio results, according to our more than 10 year experience with these calculations, is close to 0.01 eV for the data presented in this work. Note that different approximations or the use of different pseudopotentials are likely to produce results that differ by more than 0.01 eV from these.
To explore in an efficient manner the different configurations that a nHe.mv.pSIA cluster can adopt, MD simulations with the newly developed empirical potential Reference Juslin and Wirth29 were run for a few thousand steps at 1000 K (with a time step of 1 fs). The MD simulations were performed using the DYMOKA code as well as LAMMPS. Reference Plimpton34 The W–W potential is based on a modified version of the Ackland Thetford tungsten potential Reference Ackland and Thetford35 improved to better describe the energy at distances corresponding to interstitials. The W–He potential is a screened Coulomb potential joined to the BZL potential at short distance and adjusted to reproduce the formation energies of the simple He defects. For He–He, the Beck potential Reference Beck36 was used, which has been hardened at the short range by Morishita. Reference Morishita, Sugano and Wirth37
B. Starting and final configurations
The starting configurations for pure nHe clusters, pure mv clusters, mixed nHe.mv clusters, and pure pSIA clusters were always obtained as follows:
-
(i) In the case of a pure nHe cluster, the He atoms were introduced in the tetrahedral sites of the bcc-W lattice starting from the center of the box and completing around that position.
-
(ii) In the case of a pure mv cluster, the vacancies were created by deleting W atoms to obtain the most stable mv configuration, i.e., the system with (1024−m) W atoms with the lowest energy.
-
(iii) To obtain a mixed nHe.mv cluster, the nHe atoms were introduced in octahedral sites of the bcc-W lattice starting from the positions within the pure mv cluster and completing around those.
-
(iv) In the case of a pure pSIA cluster, the minimum configuration was obtained by introducing additional W atoms in octahedral sites of the bcc-W lattice, one by one.
From these starting configurations, MD simulations were run for 10,000 to 100,000 steps at 1000 K. Every 100 steps, an energy minimization of the system was performed by iteratively adjusting atom coordinates keeping the volume constant, thus obtaining a large set of minimum configurations. The minimization procedure used is a Polak-Ribiere conjugate gradient method. Iterations are terminated when the relative uncertainty of the total energy reaches 1×10⁻¹⁵ or the uncertainty of forces reaches 1×10⁻¹⁵ eV/Å or the number of iterations reaches 10,000. 5 or 6 of the energetically lowest configurations obtained were then minimized using VASP and the most stable configuration was chosen for the energy calculations. As this potential is in good agreement with the DFT results regarding the stability of small nHe.mv clusters, we expect this method to provide VASP with configurations not too far from low energy configurations according to VASP.
Mixed nHe.mv.pSIA configurations were obtained by, first, running MD simulations at temperatures ranging from 100 to 1800 K for different nHe.mv clusters during several thousands steps. The ST or TM event was detected as the creation of, at least, one SIA and one vacancy at the same time, and the procedure described above, i.e., the conjugate gradient minimization of the nHe.mv.pSIA configurations was then done every 100 steps and the 5 or 6 energetically lowest configurations were chosen as input configurations for VASP.
C. Binding energy calculation method
The binding energy
 $E_{{\rm{A}} - {\rm{B}}}^{\rm{b}}$
between A and B (where A is for instance a cluster containing n He atoms and B is a vacancy) is obtained as
 $$E_{{\rm{A}} - {\rm{B}}}^{\rm{b}} = \left[ {E\left( {\rm{A}} \right) + E\left( {\rm{B}} \right)] - [E{({\rm{A+B}})} + E_{{\mathop{\rm Re}\nolimits} {\rm{f}}.} } \right]\quad {\rm{,}}$$
where E(A) or E(B) is the energy of the supercell containing A or B, respectively, E(A + B) is the energy of the supercell containing both A and B in interaction with each other. This is done because of the limited size of the supercell that can be used (the cells are too small to be able to determine in one calculation the energy of a supercell containing the two entities not interacting with each other). All the supercells contain the same number of metal sites, i.e., have the same size. Except when otherwise stated, the reference state E Ref. of the binding energies presented in this work is always the energy of a supercell without any defects, i.e., a perfect crystal.
For both the DFT and the empirical potentials, the binding energies have been determined in 1024 atom supercells with periodic boundary conditions as explained before in Sec. II. A and II. B.
III. GROUND STATE CONFIGURATIONS
A. Self trapping
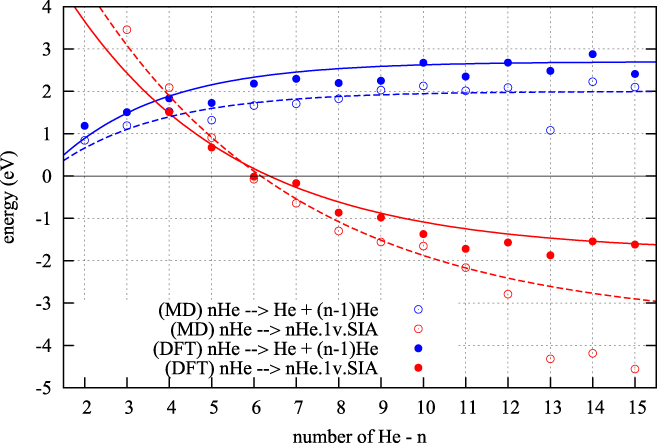
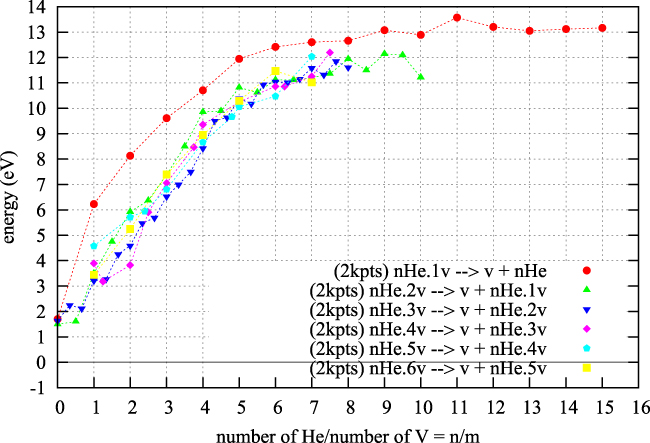
In Fig. 1, the full blue circles represent the energy change when a He atom binds to a pure He cluster, i.e., the binding energy (E b). The red circles represent the energy change when a FP is emitted from a pure He cluster and the SIA remains attached to the cluster (E ST). As the vacancy thus created will trap the He cluster, this event is referred to as self trapping (ST). Comparing the two sets of data at a given number n of He atoms indicates thus whether a pure He cluster will tend to emit a single He atom or a FP.
Binding energies (eV) of one He atom to a pure He cluster compared to the ST energy. Comparison between the DFT results (full symbols) and the prediction of the empirical potential (hollow symbols).

The DFT calculations indicate that for n > 6, the He cluster reaches a more stable state when it emits a FP. The empirical potential predicts roughly the same threshold and roughly the same trends regarding the reaction energy associated to ST. It tends however to overestimate the drop of energy when large He clusters (n >= 13) self trap.
B. Trap mutation
Vacancies are well known to stabilize He clusters, and we have thus investigated the ground state energies involved in the creation of FP when He clusters are associated with vacancies.
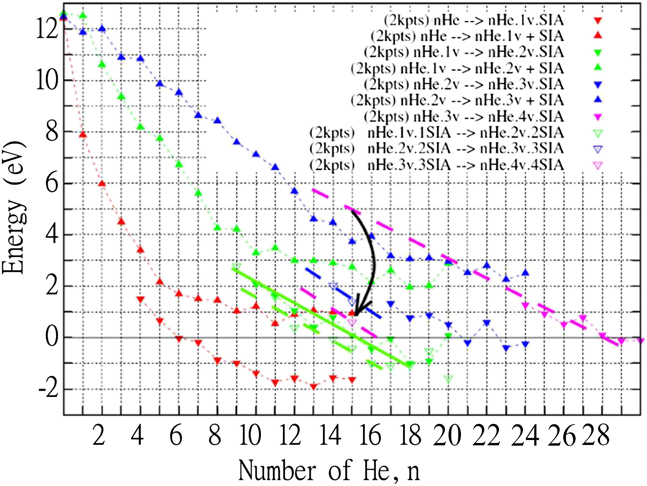
Figure 2 illustrates the effect of the presence of vacancies on the FP emission. When no vacancies are available, ST should take place when the amount of He atom is close to 6. When 1 vacancy or 2 or 3 is available, TM takes place when the number of He atoms is close to 13, 21, and 29, respectively, thus indicating a close to linear relationship.
DFT TM energies (eV) for He clusters in up to 3 vacancies. The downward triangles represent configurations in which the SIA remains close to the He clusters, whereas the upward triangles represent configurations in which the SIA is located far from the vacancies and the He atoms.

Binding energies considering SIA far from the cluster after TM process have been obtained using Eq. (1) where A is the nHe.mv cluster and B the SIA alone in the W-bcc lattice. With this scheme, the cluster and the SIA cannot interact with each other at all. The case considering a SIA created close to the cluster is obtained simply by
 $$E_{\rm{b}} = \left[ {E\left( {n{\rm{He}} \cdot \left( {m + 1} \right){\rm{v}} \cdot {\rm{SIA}}} \right)} \right] - \left[ {E\left( {n{\rm{He}} \cdot m{\rm{v}}} \right)} \right]{\rm{.}}$$
There is a large difference of almost 2 eV (3 eV for the largest clusters) when the SIA is situated far from the He cluster in the vacancies (upward triangles) as compared to when it is bound to it. It indicates that the SIA tends to remain close to the He-vacancy cluster.
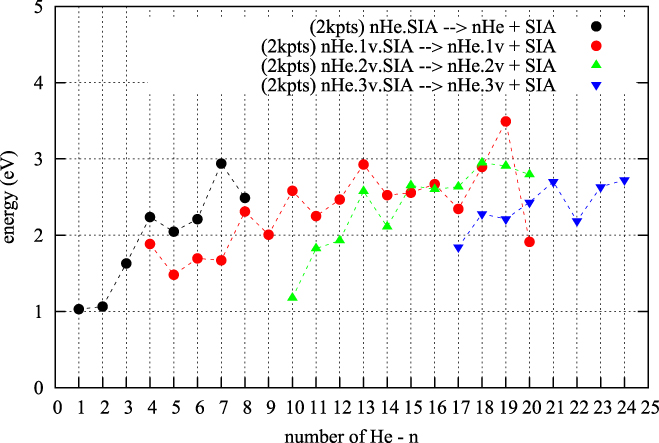
This is confirmed by Fig. 3 which has been obtained by calculating the difference between the FP creation energy when the SIA is far from the He cluster (upwards triangles in Fig. 2) and the TM energy when the SIA is next to the He cluster (downwards triangles in Fig. 2). The binding energy of a SIA with a He-vacancy cluster can be very large and seems not to depend very much on the number of vacancies. Note that all the data presented up to now are ground state configuration energies, they indicate the relative stability of the different configurations investigated. However, they do not take into account the activation barriers for the FP emission, when the DFT calculations indicate that a self trapped configuration is more stable than a pure He cluster configuration, which characterizes how much energy is needed to go to the more stable state.
DFT results for the binding energies (eV) of one SIA to nHe.mv clusters.

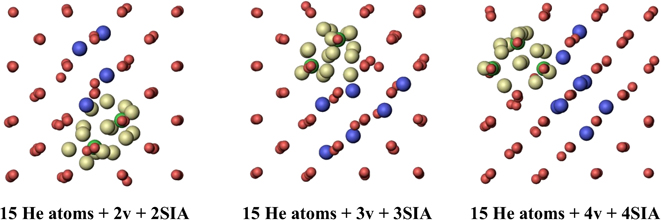
When more than one SIA is emitted, the SIAs tend to remain together as can be seen in Fig. 4.
Snapshots in the [001] zone axis of the bcc-W lattice of a 15He cluster close after ST + 1 TM events, ST + 2 TM events, and ST + 3 TM events. The red spheres represent the W atoms, the gold spheres represent He atoms, the green spheres represent the vacancy, and the blue spheres represent the crowdions which are oriented along 〈111〉 directions. DFT calculations.

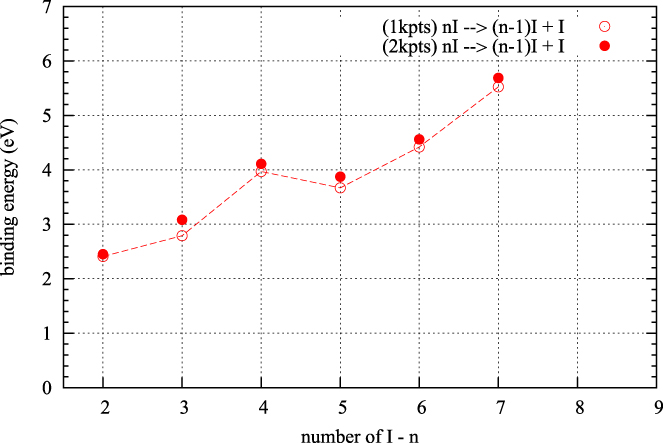
This is not so surprising considering the binding energy of one SIA to a He cluster (Fig. 3) and the binding energy of a SIA to a SIA cluster (Fig. 5).
DFT binding energies (eV) of SIA atoms (I) to pure SIA clusters.

The fact that the SIA remains close to the nHe.mv cluster has non negligible consequences. Figure 2 compares for a few cases, the ST and TM energies in the presence or in the absence of a SIA. The more SIAs next to the nHe.mv cluster, the lower the ST and TM energies (note that these energies are ground state energies and that no information on the activation barrier for ST or TM can be extracted from them). For m = 3 (i.e., when 3 vacancies come into play), the emission of a SIA from a nHe.3v cluster (nHe.3v → nHe.4v.SIA) costs 4 eV more than the emission of a SIA from the same clusters next to the SIA that had first been emitted (nHe.3v.3SIA → nHe.4v.4SIA) as shown by the black arrow between the two sets of purple data in Fig. 2.
C. Stability of mixed nHe.mv clusters
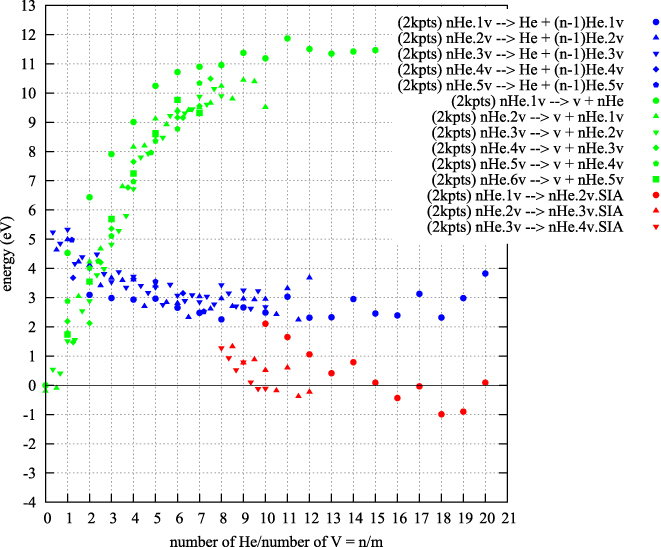
A bubble (mixed nHe.mv) can grow by the addition of vacancies or He atoms. Figure 6 summarizes the stability of nHe.mv bubbles (n ≤ 30, m ≤ 4) versus vacancy or helium emission as well as TM. The data are represented as a function of n/m, the He to vacancy ratio, that can be related to the He density in the bubble considering that n He atoms occupy m vacancies.
Stability of nHe.mv clusters versus vacancy emission, helium emission, and TM as a function of n/m. Green symbols: vacancy binding energy (eV), blue symbols: He binding energy (eV), red symbols: energy to TM (eV). DFT calculations.

The vacancy binding energy increases with the He to vacancy ratio (n/m), as the emission of a vacancy leads to a decrease of the volume that the He cluster can occupy and thus to an increase of the helium pressure. The increase is almost linear for small bubble sizes as found also in Fe. Reference Fu and Willaime38 For the same reason as previously stated, the binding energy of a He atom to a He cluster decreases with the n/m ratio.
Estimating activation energies is never a trivial task as finding the transition state is not often easy. In the literature, the activation energy for emission processes is usually estimated by calculating the so-called dissociation energy which is the sum of the binding energy and the migration energies of the emitted species. Reference Morishita, Sugano and Wirth37,Reference Fu and Willaime39–Reference Jourdan and Crocombette41 In the case of tungsten and for Fig. 6, the dissociation energies corresponding to the emission of one vacancy or a He atom are obtained by adding 1.7 or 0.06 eV, respectively, to the binding energies. In a simple extrapolation of this idea, the activation energy for ST or TM would be obtained by adding 0.013 eV to all the binding energies represented by red symbols in Fig. 6. To test this hypothesis, we have represented the dissociation energies thus obtained in Fig. 7. Using the Arrhenius formula with an attempt frequency, f a, equal to 5×10¹² s−1, in the range of the Debye frequency, an estimation of the probability of the emission event can be obtained. By definition, this event probability ranges from 0 to 5×10¹² s−1 and there is no obvious way to distinguish activated from nonactivated events. Our approach is based on our experience of an OKMC method that uses such probabilities, modeling the microstructure evolution during time scale as long as the time of the experiment Reference De Backer, Lhuillier, Becquart and Barthe42 which typically lasts from several minutes to one hour. We usually observed that an event becomes important when its probability, f c, is higher than 1 to 104 s−1. Using the Arrhenius law, one gets thus a relation between the dissociation energy and the temperature above which the event becomes important, on this time scale (1 to 104 s):
 $$E_{\rm{d}} = k_{\rm{B}} \ln \left( \,{{{f_{\rm{c}} } \mathord{\left/ {\vphantom {{f_{\rm{c}} } {f_{\rm{a}} }}} \right. \kern-\nulldelimiterspace} {f_{\rm{a}} }}} \right)T_{\rm{a}} = \alpha T_{\rm{a}} \quad {\rm{,}}$$
where E d is the dissociation energy, T a is the activation temperature, and α a factor that ranges from 0.0025 to 0.0033 taking as a criteria a probability, f c, of respectively 1/s and 104/s. Considering the approximation made on the attempt frequency, the large change on the criteria does not change a lot the value of α and thus the estimation of the activation temperature. As we want to compare activation temperatures using a simple and unique criteria, we used an averaged value α = 0.0029. Furthermore, this relation is the same as the one obtained in Ref. Reference Fedorov43. In that work, the authors developed a first-order kinetic approach to model He desorption during an annealing with a temperature ramp of 1 K/s. They obtained the same simple formula for the temperature of the desorption peak as a function of the activation energy.
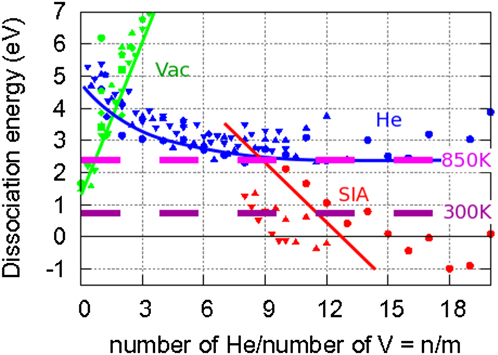
Dissociation energies (eV) for vacancy emission, helium emission, and TM from a nHe.mv cluster as a function of n/m. The threshold energies between activated and unactivated processes have been obtained with relation (1). Room temperature (respectively 850 K) is represented by the purple (respectively pink) dashed line. DFT calculations.

Using E d = 0.0029 T a, one obtains 0.8 and 2.4 eV as dissociation energies activated at room temperature and 850 K, respectively. These thresholds have been represented in the dissociation energy plot of Fig. 7. Clusters for which a dissociation event exists with a dissociation energy smaller than the threshold cannot persist in the material on the experimental time scale. Figure 7 thus indicates that there is He or He to vacancy ratio stability range limited by vacancy and SIA emission curves and which strongly depends on temperature. At room temperature (purple dashed line in Fig. 7), nHe.mv clusters are very stable: neither He emission, nor vacancy emission can take place. ST can take place for large n/m: n/m > 8 whereas TM takes place for 27He.3v or 18He.2v clusters. Vacancy emission will take place at higher temperatures and for a n/m ratio close to 0.5.
The 850 K line (pink line in Fig. 7) marks out the stability range of He clusters in a single vacancy toward the emission of He or TM. Below this line, He clusters are stable until the n/m ratio reaches 10. When more than one vacancy is present, then the n/m ratio shifts toward lower values (n/m ≤ 8 and m > 2).
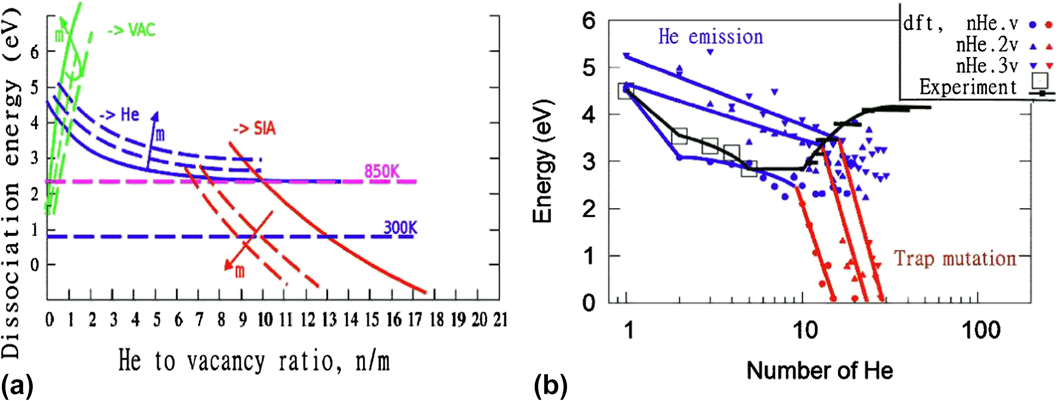
The DFT data in Figs. 6 or 7 show also that when the He to vacancy ratio, n/m = 10, it requires more than 2 eV to emit a FP from 10He.v and 0.6 eV to emit a FP from 20He.2v and there is no barrier for a 30He.3v cluster to emit a FP (this point is discussed below). The n/m ratio (i.e., the He density in the bubble) is not enough to characterize the stability of nHe.mv clusters as described previously by Trinkaus, Reference Trinkaus6 shown previously by MD simulations in Fe Morishita et al. Reference Morishita, Sugano and Wirth44 and more recently by Jourdan and Crocombette. Reference Jourdan and Crocombette41 Similarly, the higher the number of vacancies (and thus the bubble size) the higher the dissociation energies for vacancy and He emissions. This enlightens the fact that the larger the bubble, the higher its stability, because the surface energy is less and less penalizing. On the contrary, the dissociation energy for the SIA emission decreases when the He bubble size increases (for a given He/v ratio), this becomes clear when one considers that the dissociation energy can be estimated by the FP formation energy minus the binding energy for the vacancy emission. There is thus a “size” effect on the dissociation energies which is schematically illustrated in Fig. 8. TM depends not only on the density of He in the bubble (i.e., the n/m ratio) but also on its size (i.e., m). The same holds also for vacancy and He emission but to a lesser extent according to our DFT data.
(a) Schematic illustration of the influence of the bubble size (i.e., the number of vacancies) on the vacancy emission, the helium emission, and the occurrence of TM. (b) Comparison with the experimental data of Ref. Reference Kornelsen and Van Gorkum45. The experimental activation energies have been obtained from the desorption temperatures using E = 0.0029 T. Note that the experimental temperature ramp is fast and can lead to an overestimation of the activation energies and that the He migration energy being very low, it can be neglected and activation energies and binding energies are thus very close. The solid lines are just guide for the eyes. The blue solid lines underline He emission, the red solid lines TM, and the gray solid line the experimental results.

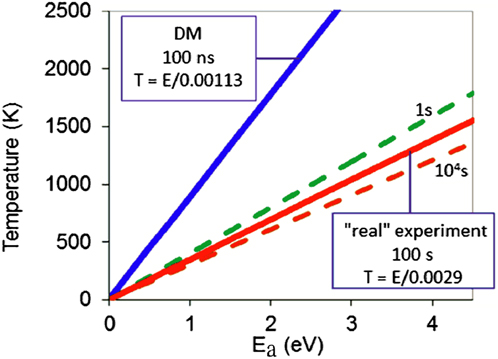
Our results allow us to provide an explanation to the experimental results obtained by Kornelsen and Van Gorkum. Reference Kornelsen and Van Gorkum45 In their experiment, thermal desorption spectrometry was used to study the fate of He implanted in W containing various inert gas impurities. The authors observed that the dissociation peaks (and thus the binding energies) decreased first with the number of He (the size of the He clusters), but that for He clusters containing more than 10 He atoms the temperature of the dissociation peaks increased with the number of He atoms [Fig. 8(b)] and did not depend anymore on the impurity trapping the He atoms. There is no real explanation in the paper about this change in the trends. Our results indicate that in these range of He cluster sizes, ST and TM take place and because of the pressure decrease due to the emission of the SIA and the creation of the vacancy the binding energy with He atoms increases. Furthermore, the He content at which successive TMs occur in nHe.v, nHe.2v, and nHe.3v and the resulting increase of the binding energies are in good agreement with their experimental results. Indeed in their experimental desorption spectra, the authors observe that, above an averaged dose of 5.6 He per trap, a peak appears at 950 K (Fig. 3 of Ref. Reference Kornelsen and Van Gorkum45). In the experiment, a fast temperature ramp of 40 K/s was used instead of the temperature ramp of 1 K/s used in formula (1). This faster temperature ramp causes a 13% increase of the peak temperature. Figure 9 represents, for different characteristic times, the minimum temperature at which an event will be observable. For instance, in MD simulations, the characteristic simulation length being around 100 ns, events with activation energies higher than 2 eV will not be observed at temperatures lower than 1800 K. As a consequence, in a desorption experiment, if the desorption ramp is slow, events with high activation energies will be observed at lower temperatures than if the ramp was faster. Keeping this issue in mind, we find that the experimental results are thus in good agreement with our schematic illustration of Fig. 8a. At higher doses of 21 and 60 He per trap (Figs. 4 and 6 of Ref. Reference Beck36), this peak remains but becomes less and less important compared to the higher energy peaks. We believe that this peak is due to the release of He from pressurized monovacancies and remains because of the competition between the emission of He and TM occurring at He to vacancy ratio as illustrated in Fig. 8a. Those experimental results show thus that nucleation happens on the impurities and that at high helium amount, the impact of the impurity is no more important. Another interesting point is that the He.v “impurities” obtained by pre-implantation of 5 keV He act also as nuclei for He bubbles as we were able to show they did, in 800 keV He implantation followed by annealing. Reference De Backer, Lhuillier, Becquart and Barthe42 Complementary DFT calculations of He cluster binding energies with impurities as Ne, Ar, Kr, and Xe, in good agreement with these experiments, have been calculated by D. Nguyen-Manh and submitted recently to Ref. Reference Nguyen-Manh and Dudarev46.
Minimum temperature at which an event can be observed for different characteristic times, versus activation energy. The attempt frequency chosen is 5.0 × 10¹² s−1.

The larger the bubble (the more vacancies), the easier TM, but the more difficult the emission of He atoms. The case of the emission of vacancies is a bit special as, because of the divacancy lack of stability, Reference Becquart and Domain47 the vacancy binding energy for very small bubble sizes (m = 2 or m = 3) is lower than the vacancy binding energy for He clusters contained in one single vacancy, however, it is reasonable to expect that when m becomes larger than 3 this trend is reversed as illustrated in Fig. 10.
DFT vacancy dissociation energies from nHe.mv clusters for different values of m.

IV. ACTIVATION BARRIERS FOR ST
The activation barrier for ST was determined using both a dynamic and a static approach, more precisely the nudged elastic band (NEB) method. Reference Henkelman and Jonsson48,Reference Henkelman, Uberuaga and Jonsson49
A. Dynamic approach
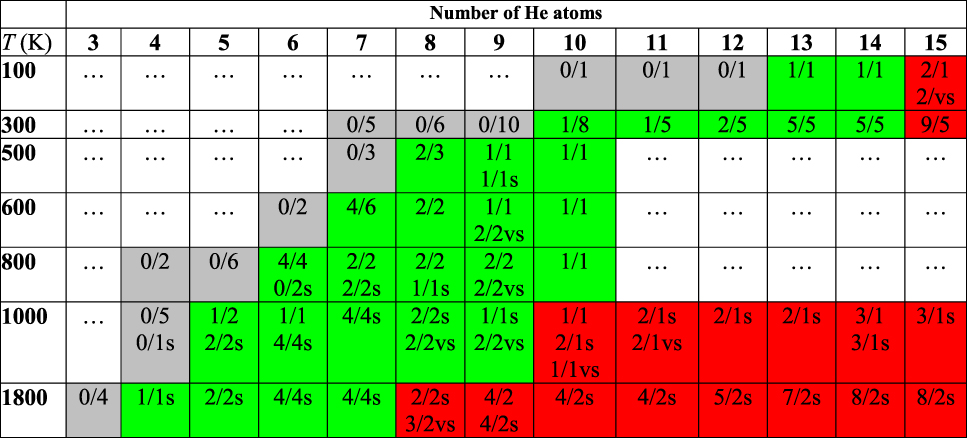
Two series of MD simulations were performed. In boxes 20 × 20 × 20 (in lattice units), He atom clusters were introduced in an otherwise perfect lattice (i.e., without any point defects) and the simulations were run at different temperatures for times ranging from 1 to 100 ns. Depending on temperature and number of He atoms introduced, the formation of zero, one, or two FP was observed. The results of the simulations are presented in Table I. The gray shaded cells represent cases where no ST event was observed in any of the simulation run, the green shaded cells represent cases where no more than one FP was observed per simulation, and the red shaded cells represent cases where more than one FP was created in the course of the simulations. The simulations were run in the microcanonical ensemble (NVE) with a time step of 1 fs.
Number of FP created (n FP) (i.e., ST event observed) versus number of simulations (n sim) at different temperatures and for different cluster sizes. The cells are colored according to the n FP/n sim ratio. The simulation time was 100 ns except when indicated otherwise: s stands for 10 ns simulations and vs stands for 1 ns simulations.

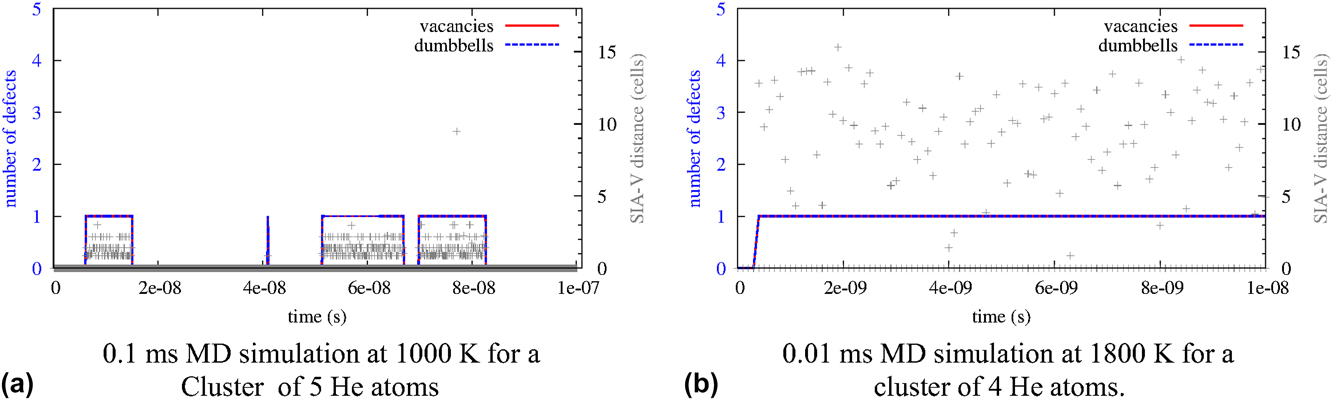
The formation of a FP is a thermally activated event which depends also on the amount of He atoms. Even though the potential, in agreement with the DFT calculations, predicts that clusters of n He atoms are less stable in interstitial configurations than when they are in a vacancy next to a SIA for n larger than 6, the amount of He atoms has to be increased up to 13 to observe a TM event in the time span of the calculations. For all the temperatures investigated but the highest (1800 K), the SIAs formed remain close to the He cluster trapped in the created vacancy as can be seen in Fig. 11. This figure shows two plots of the number of FP created and the distance between the SIA and the vacancy versus time in MD simulations of a 5He cluster at 1000 K and a 4He cluster at 1800 K.
ST events during MD simulations at different temperatures. (a) The left hand side scale represents the amount of FP in the box. (b) The right hand side scale, which corresponds to the gray crosses, represents the distance (in lattice unit) between the SIA and the vacancy.

If we apply the formula illustrated in Fig. 9 to ST, at 100 K, an activation energy for this event close to 0.1 eV is sufficient to make the He cluster lifetime longer than 10 ns and thus ST will be difficult to observe by MD. The data in Table I thus suggest that the activation energy for ST of nHe clusters containing up to 12 He is higher than 0.1 eV. This is in contradiction with our first approach using the dissociation model as the binding energy (see Fig. 1) becomes negative above 6He and thus if one adds the SIA migration energy (0.013 eV) to these binding energies, the resulting activation energy would be negative also. As the data in Table I indicate that ST is only observed in MD simulations for clusters containing more than 13 He for which the binding energy is −4 eV, one can easily conclude that the dissociation model used in literature, Reference Morishita, Sugano and Wirth37,Reference Fu and Willaime39–Reference Jourdan and Crocombette41 which we tested in Fig. 7, cannot be used to estimate the activation energy for ST (and very likely for TM) which depends on the number of He atoms in a more complex way.
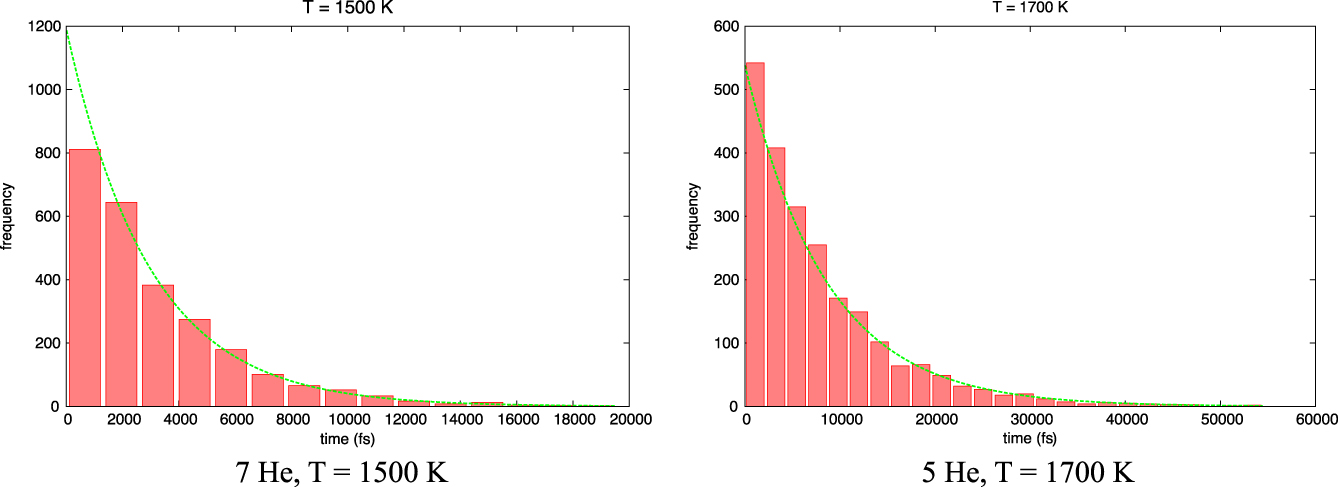
The ST event was more carefully analyzed for small He clusters. For this purpose, thousands of MD simulations were run with different seeds at different temperatures, in the canonical ensemble (NVT), in boxes containing 1024 atoms and He clusters with sizes varying from 5 to 8. Each simulation was pursued until a ST and more precisely the occurrence of a SIA (a crowdion) in the simulation cell was observed, and the time at which the event took place was recorded. If we note p(X) the event corresponding to the occurrence of a SIA (a crowdion) formation after a time X, Fig. 12 indicates that its probability distribution follows an exponential law
 $p\left( {X = t} \right) = a\exp \left( {bt} \right)$
where a > 0 and b < 0.
Distributions of time (in fs) to reach a ST event for He clusters of two different sizes. The green curve represents the exponential law fitted.

From the exponential fits, one obtains the mathematical expectation
 $\varepsilon$
and thus the characteristic time of the SIA appearance
 $\tau = \varepsilon ^{ - 1}$
of the distributions, as by definition of the exponential law,
 $a = {\raise0.7ex\hbox{$\varepsilon $} \!\mathord{\left/ {\vphantom {\varepsilon {\left( {1 - \varepsilon } \right)}}}\right.\kern-\nulldelimiterspace}\!\lower0.7ex\hbox{${\left( {1 - \varepsilon } \right)}$}}$
and
 $b = \ln \left( {1 - \varepsilon } \right)$
. The characteristic time
 $\tau$
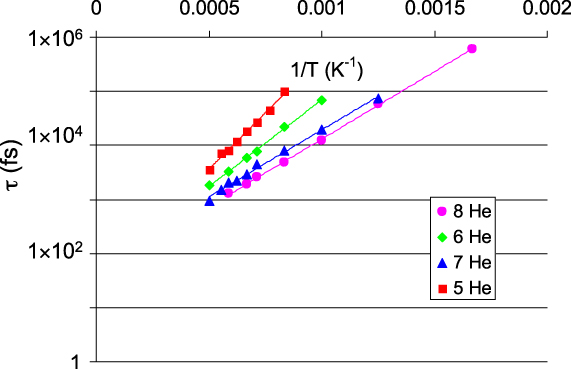
was calculated for each temperature and plotted as a function of 1/T in Fig. 13. The SIA appearance probabilities clearly follow an exponential law as a function of 1/T in the temperature range investigated, which suggests that the ST is indeed a thermally activated process that involves one single activation barrier. This activation barrier for the ST can be calculated using Ea = s/k where s is the slope of the fit and k is Boltzmann constant. An extrapolation of these fits provides an estimate of the event attempt frequency which is close to 2·10−13 s.
Characteristic times (in fs) for ST as a function of temperature for He clusters of size 5 to 8.

B. NEB calculations
To describe the total energy change during the ST process we performed a NEB calculation, as described in Refs. Reference Henkelman and Jonsson48,Reference Henkelman, Uberuaga and Jonsson49 on systems containing 1024 tungsten atoms (8 × 8 × 8 bcc cells) with 3, 4, 5, 6, 7, or 8 He atoms.
For each number of He atoms, a total of 10 replicas (#1 to #10) were initially created in which the first and the last replica correspond to minimized configurations (obtained applying a conjugate-gradient method on configurations taken from MD simulation at 1000 K before and after the TM process occurred).
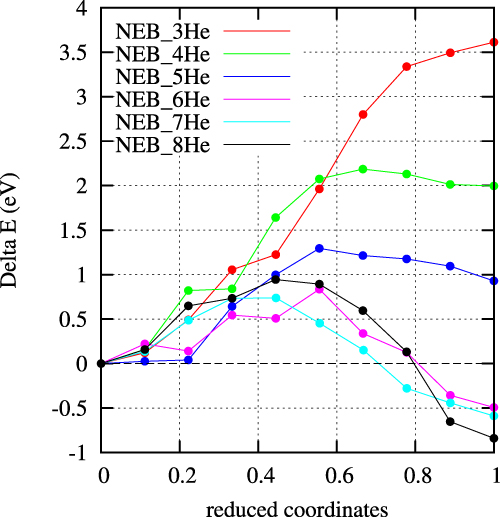
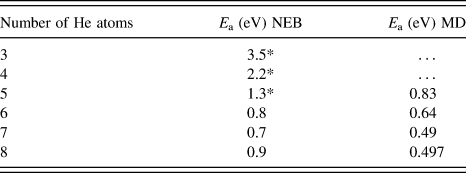
The initial coordinates of all atoms in the intermediate replicas #2 to #9 were set to values linearly interpolated between the corresponding atoms in replicas #1 and #10. In our NEB calculation, each #M replica was linked to the #M − 1 and #M + 1 replicas by only the two tungsten atoms corresponding to the SIA created during the ST process, and with an inter replica spring constant of 1.0 eV/Å. The multi-replica minimizing procedure was processed with the method described in Refs. Reference Nakano50,Reference Bitzek, Koskinen, Gahler, Moseler and Gumbsch51 until a stopping tolerance for force of 0.001 eV/Angstrom was reached or with a maximum of 20,000 iterations. At the end of the minimizing procedure, i.e., the NEB calculation, tungsten and He atoms directly participating to the TM process are positioned differently in each replica. The pathway of the TM process is then described by the position of the concerned atoms in each replica. The 10 replicas total energy variation obtained at the end of the NEB calculation and for different He cluster sizes is plotted in Fig. 14, and the resulting activation energies are gathered in Table II. The results indicate clearly that for small cluster sizes, the activation energy for ST is much too high to be related to an event observable using conventional MD techniques except at high temperature such as 1800 K. Note that the NEB results obtained in Ref Reference Boisse, Domain and Becquart52 for the 7He case are different from the ones showed here as we were able to find a lower energy configuration for the initial configuration.
NEB calculations of the activation energy (eV) for ST for He clusters of various sizes obtained with the empirical potential. The NEB results obtained in Ref. Reference Boisse, Domain and Becquart52 for the 7He case are different from the ones showed here as we were able to find a lower energy configuration for the initial configuration.

Activation barriers E a (eV), for ST, obtained by NEB calculations and by MD. The * indicates that the final state is higher in energy than the initial state.

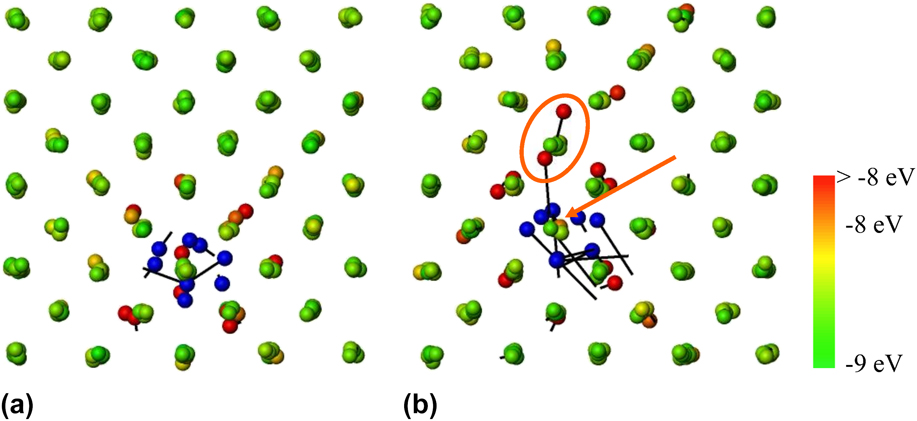
The NEB values are always larger than the dynamic values. This difference between dynamic and NEB approach can be attributed to the difficulty to obtain the minimum energy pathway for ST because of the large mobility and rearrangement of the He atoms in the cluster during the minimization or the contribution of several different pathways. The initial and final configurations for an 8He cluster are illustrated in Fig. 15.
Snapshots of the initial (a) and final (b) configurations used for the 8He cluster NEB calculation. The helium atoms are represented by blue spheres. The tail represents the displacements from the first step of the MD simulations in which the ST event took place. The W atoms are colored upon their potential energy, the most energetic ones being in red. The SIA is circled in red and the arrow indicates the position of the vacancy.

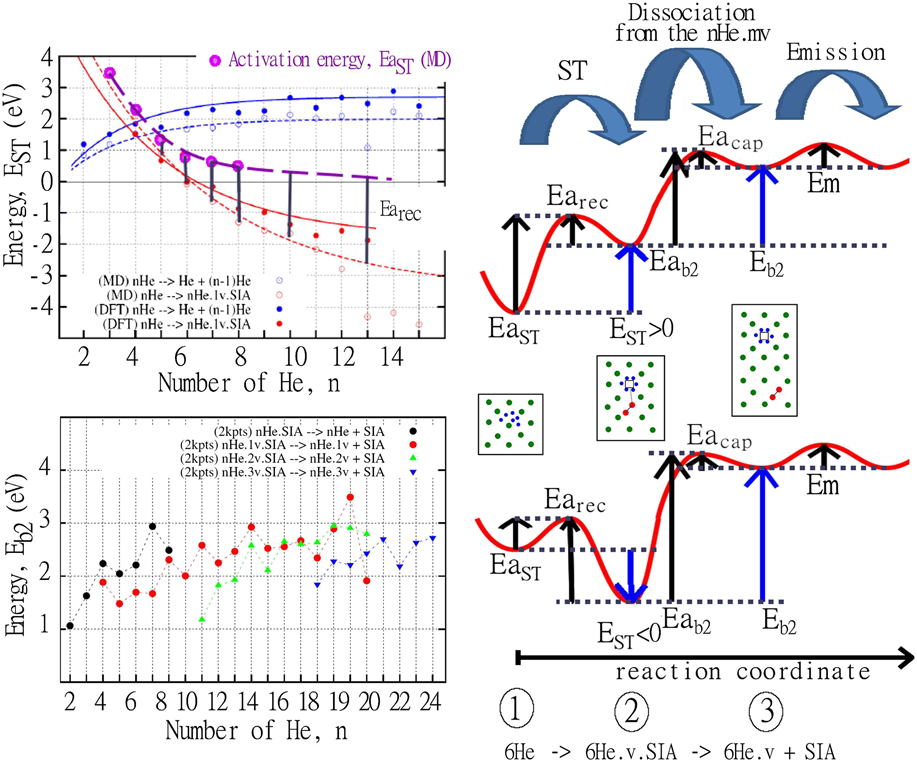
Figure 16 summarizes the two situations encountered in the growth of He clusters and ST. A cluster containing (n − 1) He atoms can grow by the adjunction of a new He atom. When the He cluster is too big, i.e., when n is too large, ST can occur by the formation of a FP which corresponds to the reaction nHe → nHe.v.SIA. The difference (E ST) between the two He clusters (the nHe and the nHe.v.SIA cluster) formation energies characterizes the respective stabilities of the clusters. When E ST is positive, the nHe.v.SIA cluster is less stable than the nHe cluster.
Schematic drawing of the different situations encountered in ST. ST corresponds to the transition from configuration 1 to configuration 2. The emission of the SIA created corresponds to the transition from configuration 2 to configuration 3. The two plots on the left come from Figs. 3 and 17.

When E ST becomes negative, the nHe cluster contains too many He atoms and is metastable and ST should take place to decrease the overall energy. Our results indicate that this will not take place spontaneously, i.e., that ST is a thermally activated event. As a consequence, when the temperature is high enough to overpass EaST, the nHe cluster can self trap, i.e., become configuration 2 in Fig. 16. EaST = E ST + Earec where Earec is the activation energy for the reverse reaction, i.e., the recombination of the FP (configuration 2 becoming configuration 1). The SIA emitted will remain trapped on the (n + 1)He.v cluster unless the temperature is high enough to make it overpass Eadiss. This event corresponds to the transition from configuration 2 to configuration 3 in Fig. 16.
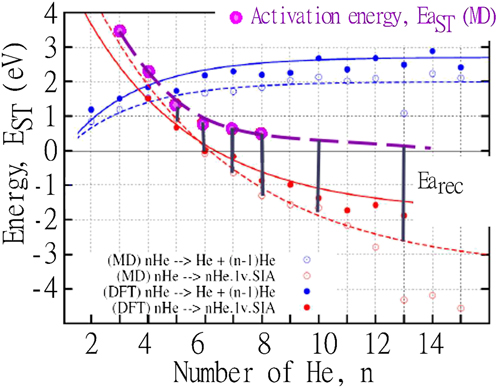
On the bottom left of Fig. 16, we also reproduce Fig. 3 that is actually our calculations of E b2 of the schematic drawing on the right. Top left of Fig. 16 is a summary of our calculations for the other energies, and is enlarged in Fig. 17.
Binding and activation energies (eV) for the FP emission from a nHe.mv cluster as a function of the number of He calculated using DFT and MD methods. The black vertical lines represent the activation energy for the reverse reaction, i.e., the recombination of the FP, i.e., the transition from configuration 2 to configuration 1 in Fig. 16.

Figure 17 compares the calculated ST activation energies (pink dotted line) with the binding energies (red dotted line) of Fig. 1. It clearly shows that the ST activation energy depends on the cluster size. The difference between the two sets of data, represented by black vertical lines represents thus the activation energy for the reverse process Earec. Our results indicate that the simple dissociation model which states that EaST = E ST + E m where E m is a constant taken to be the migration energy of the emitted species, i.e., of the SIA, often used to calculate activation energies cannot be applied as the data in Table II indicate that Earec is higher than 0.013 eV.
Figure 17 also shows clearly that, as could be expected, the activation barrier for ST's reverse process, i.e., the recombination of the FP increases when the size of the He cluster increases.
Note also that E b2 in the case of W is close to 2 eV and that the SIA is strongly bound to the (nHe.v+ 1)He.v cluster as the activation energy for the dissociation of the SIA (Eadiss) is equal to Eacap + E b2 as shown in Fig. 16.
Finally, we analyzed the relation between all the activation energies EaST and the temperature Ta at which the events were observed in our MD simulations and found a similar relation to Eq. (2) but with a smaller coefficient coherent with the fact that the simulation time in MD is smaller than a real experiment timescale. This formula is Ea = 0.0011 Ta. As ST of one 13He cluster has been observed with MD at 100 K, one can consider that the activation energy of this process is around 0.1 eV and thus a sensible extrapolation of the activation energy curve up to this cluster size can be done as shown in Fig. 17.
V. CONCLUSIONS
The threshold for ST and TM has been determined, based on static and dynamic energy calculations using both DFT and MD using an EAM potential. According to the DFT results, ST should take place in tungsten when 6 He atoms cluster together without the presence of any defect. When one or two or three vacancies are available, TM takes place for He clusters of size 13, 21, and 29, respectively. A clear dependence of the binding energies of nHe.mv clusters with the n to m ratio has been observed and can be viewed as an effect of the He density, thus the pressure inside the bubble. However, an effect of the bubble size (thus m) has been put in evidence, similar to what is known for the pure defect clusters, but with the opposite trend: the larger the nHe.mv cluster the more favorable the SIA emission process. Calculations show that the emitted SIA is bound to the nHe.mv clusters and even more strongly bound when a SIA is already trapped.
The dynamics of the ST has been investigated using MD and MS methods. ST is thermally activated and Arrhenius plots of ST event observed by MD gave activation energies that have been compared to the ones obtained by NEB calculations. They are found to be around 0.5 eV for 7He clusters or 8He clusters by the dynamic method and between 0.5 and 0.9 eV by NEB.
It has been shown that the dissociation model which is often used to calculate activation energy cannot be applied to ST and TM. A sensible extrapolation of ST activation energy has been proposed for the ST of He clusters containing up to 12 He which clearly suggests that the energy barrier for FP recombination increases with the cluster size.
ACKNOWLEDGMENTS
This work is supported by CEA under the collaborative contract number V 3542.001 on Fusion engineering issues. This research has been done using the CRI supercomputer of the Université Lille1 – Sciences et Technologies supported by the Fonds Européens de Développement Régional. This work is also a part of the research program of the EDF-CNRS joint laboratory EM2VM (Study and Modelling of the Microstructure for Ageing of Materials). This project has received funding from the European Union's Horizon 2020 research and innovation programme under grant agreement number 210130335 and from the RCUK Energy Programme [grant number EP/I501045]. The views and opinions expressed herein do not necessarily reflect those of the European Commission. Dr. A. De Backer particularly thanks Dr. D. Nguyen-Manh for pointing out the experimental results of E.V. Kornelsen.