INTRODUCTION
There is little question that even low levels of fishing can lead to substantial depletion of some groups of coral reef fishes (Jennings & Polunin Reference Jennings and Polunin1996; Dulvy et al. Reference Dulvy, Polunin, Mill and Graham2004). More generally, coral reef areas within marine reserves tend to have two or more, sometimes up to 10 times, the biomass of targeted fishes when compared to nearby fished areas or pre-closure stocks (Russ & Alcala Reference Russ and Alcala1989, Reference Russ and Alcala2003; Polunin & Roberts Reference Polunin and Roberts1993; Friedlander et al. Reference Friedlander, Brown and Monaco2007b; McClanahan et al. Reference McClanahan, Graham, Calnan and MacNeil2007). Furthermore, studies based around reserves will tend to underestimate the impacts of fishing, because marine reserves are generally too small or have insufficient compliance to effectively protect the wide-ranging and vulnerable taxa, such as sharks and other large apex predators, which make up the bulk of fish biomass in large, isolated and virtually-unfished areas (Friedlander & DeMartini Reference Friedlander and DeMartini2002; Robbins et al. Reference Robbins, Hisano, Connolly and Choat2006). It therefore seems reasonable to suppose that, in most cases, coral reef fish stocks close to human population centres will have been substantially altered by fishing activities.
High human population density and what accompanies it (for example urbanization, land- and watershed-alteration and associated increases in the input of sediment, nutrients and other pollutants into marine waters) can lead to the degradation of nearby coral reefs (Tomascik & Sander Reference Tomascik and Sander1987; Hunter & Evans Reference Hunter and Evans1995; Edinger et al. Reference Edinger, Jompa, Limmon, Widjatmoko and Risk1998). Degraded reefs, on which coral cover and associated structural complexity has been lost, have much lower capacity to support diverse and abundant fish populations (Friedlander et al. Reference Friedlander, Brown, Jokiel, Smith and Rodgers2003; Jones et al. Reference Jones, McCormick, Srinivasan and Eagle2004; Graham et al. Reference Graham, Wilson, Jennings, Polunin, Bijoux and Robinson2006; Wilson et al. Reference Wilson, Graham, Pratchett, Jones and Polunin2006). Therefore, coral reef fish stocks near human population centres are potentially affected by both fishing and anthropogenic environmental or habitat degradation.
Although there is now widespread recognition that coral reefs and coral reef fish populations worldwide are under stress from overfishing and the consequences of coastal development, human population growth and climate change (Wilson et al. Reference Wilson, Graham, Pratchett, Jones and Polunin2006; Kleypas & Eakin Reference Kleypas and Eakin2007; Newton et al. Reference Newton, Cote, Pilling, Jennings and Dulvy2007), an essential first step towards developing effective management responses is to determine the importance of the various factors contributing to degradation in any particular situation. In particular, it is likely to be difficult to build support for appropriate remedial action if it is not possible to reach a consensus on the underlying cause(s) of resource declines. One means towards distinguishing the impacts of fishing on reef fish stocks from those due to habitat and other environmental degradation is to compare responses of target- and non-target fishes to increasing local human population density. Although a wide range of coral reef fish species are taken by reef fisheries, except where fish stocks are heavily overfished, fishers tend to be highly selective, and there are sharp differences among taxa in resilience to fishing pressure; large-bodied and slow-growing species are particularly vulnerable to overexploitation (Jennings & Lock Reference Jennings, Lock, Polunin and Roberts1996; Jennings et al. Reference Jennings, Reynolds and Mills1998). Therefore, the impacts of fishing should be most evident among highly-targeted or vulnerable taxa. In contrast, the effects of habitat degradation can be expected to have much broader effects on reef fish assemblages. For example, a recent meta-analysis of reef fish assemblage responses to habitat degradation found that 62% of all fish species declined markedly in abundance following habitat degradation involving ≥ 10% decline in coral cover (Wilson et al. Reference Wilson, Graham, Pratchett, Jones and Polunin2006). Similarly, dramatic coral loss within a marine reserve in Papua New Guinea led to declines in the abundance of 75% of reef fish species surveyed (Jones et al. Reference Jones, McCormick, Srinivasan and Eagle2004).
Hawaii, the locus of this study, contains areas such as the island of Oahu which are populous and heavily urbanized, but there remain other locations which are very lightly populated and relatively undeveloped. Therefore there is great scope for there to be a large range of human impacts among reef areas within and between islands. In addition, although there is widespread public recognition that fish stocks have declined and that overfishing has been a factor (DAR [Division of Aquatic Resources] 1988; Maly & Pomroy-Maly Reference Maly and Pomroy-Maly2003), there is a perception among some elements of the fishing community that the primary cause of fish stock declines has not been overfishing, but instead has been habitat degradation arising from onshore urbanization and development (Hamnett et al. Reference Hamnett, Lui and Johnson2006).
In order to assess the impact of fishing on coral reef fish assemblages in Hawaii, we examined the relationships between a variety of fish stock metrics and local human population using data from 89 coral reef survey sites spread widely around the Main Hawaiian Islands (MHI). Our expectation was that, if fishing was the prime driver of any fish assemblage declines along human population gradients, then heavily-targeted or vulnerable fishes would decline most severely, whereas lightly-targeted groups would be much less affected. Alternatively, if fish stock declines were a general symptom of environmental or habitat degradation as local human population increased, we would expect the impacts on local fish communities to be more general, affecting both heavily and lightly targeted fish groupings.
MATERIALS AND METHODS
Coral reef rapid assessment surveys
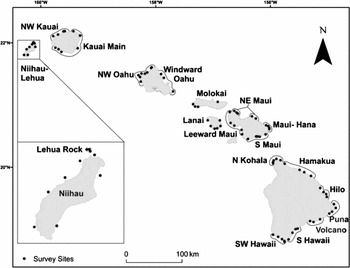
Between February 2005 and August 2006, staff of the NOAA Pacific Islands Fisheries Science Center, Coral Reef Ecosystems Division (NOAA-CRED) and Hawaii Division of Aquatic Resources (HDAR) conducted 128 surveys of fish and benthic populations at sites throughout the MHI (Fig. 1). As part of the broader Pacific Reef Assessment Program (RAMP), survey cruises were initiated primarily to assess conditions at reef areas which had not previously been heavily surveyed. Therefore, although survey sites were widely spread throughout the MHI (Fig. 1), some of the most heavily populated and most impacted parts of the state, for example South Oahu and Kaneohe Bay on Oahu (Hunter & Evans Reference Hunter and Evans1995; Friedlander et al. Reference Friedlander, Brown, Jokiel, Smith and Rodgers2003; Williams et al. Reference Williams, Walsh, Miyasaka and Friedlander2006) were not visited by survey cruises. The main other gaps in terms of spatial coverage were the west coast of the Big Island of Hawaii, which has been surveyed by HDAR and partners since 1999 (Tissot et al. Reference Tissot, Walsh and Hallacher2004), and marine reserves generally, which have been thoroughly surveyed for other studies in recent years (Friedlander et al. Reference Friedlander, Brown and Monaco2007a, Reference Friedlander, Brown and Monacob).
Survey sites and location groupings.

For each region visited by cruises, a number of potential survey sites were selected haphazardly by scientific staff of NOAA-CRED using GIS habitat and depth maps to identify areas which appeared to have extensive hard bottom mid-depth areas suitable for surveys. In a few cases, on reaching sites selected from those maps, it was impossible to locate suitable hard bottom habitat, and in those cases survey teams would simply move to the next of the previously selected sites. Where suitable habitat was available, survey teams began surveys as close as possible to the point at which they entered the water. At each site, fish belt transect surveys were conducted by pairs of divers on three 25 m-long transects per site. Divers recorded the species, number and size (total length [TL] to the nearest cm for fishes <5 cm, and in 5 cm bins for all others) of fishes observed on transects during two passes: an outward swim in which all fishes >20 cm TL were recorded in adjacent 4 m wide belts, and a return swim in which all fishes ≤20 cm TL were recorded in 2 m wide belts per diver. Simultaneously, a third diver surveyed fishes > 25 cm TL in four stationary point count cylinders (SPC) of 10 m diameter and five minute duration which were haphazardly located in the surveyed habitat. All three fish surveyors separately recorded the presence of any fish species observed in the survey area at any time throughout the dive. Benthic surveyors recorded bottom cover on the first two transects surveyed by the fish team using a point-intercept method. Benthos (corals to species level, other functional or taxonomic groupings in broad categories) was recorded at 0.5 m intervals, so 51 points were surveyed per transect (102 per site).
Locations and site characteristics
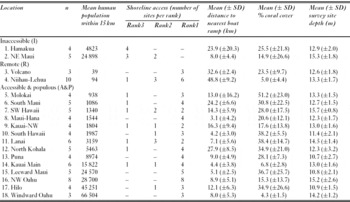
For the purposes of analysis, survey sites were grouped into ‘locations’ (Table 1, Fig. 1), which were intended to represent naturally meaningful spatial units broadly consistent with local human population density and shoreline structure. Sites were pooled by island where islands are relatively small, where the total level of replication at island-scale was insufficient to subdivide, or where there were no clearly distinct sub-areas in terms of human population density or shoreline accessibility among the surveyed sites. We considered shoreline accessibility to be important because: (1) in Hawaii, total take of coral reef fishes by recreational fishers is much greater than commercial take (for example, in 2004, the total estimated catch of ‘inshore species’ by recreational fishers was four times reported commercial catch; HDAR unpublished data 2007); and (2) shore-based fishing is a much larger part of total fishery take than boat-based fishing for nearly all targeted reef species (for example estimated take by shore-based fishers is 80–100% of total recreational catch for most such species; HDAR unpublished data 2007 from Hawaii Marine Recreational Fishing Survey programme, URL http://www.hawaii.gov/dlnr/dar/surveys/). The great majority of recreational take of reef fishes is by rod or spear, and the use of destructive fishing methods such as blast fishing is virtually unheard of in Hawaii.
Locations and their classification. n = number of survey sites within each location. Shoreline access scores: 1 = fishers able to readily access the shoreline; 2 = shoreline structure and lack of road access limits ready access to shoreline; and 3 = lack of access roads, and shoreline structure such that it would be very difficult or impossible for fishers to access the shoreline.

Location groupings were created so that nearshore marine habitat within those areas would fall within three broad categories: (1) ‘inaccessible’ (I), i.e. shoreline structure adjacent to survey sites was such that shore-based fishing pressure could reasonably be expected to be negligible; (2) ‘remote’ (R), being areas with very low local human population density (i.e. Niihau, which at the time of the 2000 census had a population of less than 1 person km−2, and the Volcano region of Hawaii Island, which is adjacent to a 930 km2 national park with very few permanent residents); and (3) ‘accessible and populous’ (A&P), i.e. all other areas (Table 1, Fig. 1).
In order to corroborate location classifications and to provide data on human population density for later analyses, we calculated a range of characteristics for each site using ArcGIS 9.0 (ESRI, Redland, CA, USA). Human population residing within 15 km of survey sites, presence of roads leading to the shoreline, and distance from sites to nearest boat ramp or harbour were derived from data from the Hawaii Statewide GIS programme (URL http://www.hawaii.gov/dbedt/gis/). We converted year 2000 census data, which included total human population per census block, to a raster grid and then to a point shapefile with each point representing a 1-ha cell. Population for each point was set to the mean number of people per hectare for that census block. A 15 km buffer was generated for all sites, and population point values within each zone were summed to generate total human population. A ‘shoreline accessibility score’ was derived for each site by creating 10 m and 20 m elevation contours from digital elevation models for each island. Shoreline accessibility was ranked on a 3 point-scale. If there was a road leading directly to the shoreline or if the 10 m contour was >50 m from the shoreline, then accessibility was ranked as ‘1’ (no difficulty accessing shoreline). If there was no road access, we ranked accessibility based on the shoreline topography 250 m to each side of the site. Where we believed shoreline structure would dramatically limit access (i.e. 10 m contour <10 m from shoreline, or 20 m contour <50 m from shoreline) shoreline access was ranked as ‘3’ (very difficult or impossible to fish from shore). Where the 10 m contour was <50 m from the shoreline we considered that access would be restricted, and ranked shoreline accessibility as ‘2’.
Data handling and analysis
In order to reduce environmentally-driven variability, we restricted analyses to surveys of hard-bottom reef habitat at depths of 8–18 m where estimated water visibility was ≥6 m. We excluded data from 24 of the 128 surveys: nine due to low visibility, seven because survey sites were predominantly sand (>50% cover), five from surveys of walls, one because the survey was too shallow, one because the survey was located at the site of a recent lava flow, and one because it was visited to survey the impact of a recent ship grounding and was therefore not a representative site. We also excluded data from the single survey of suitable hard-bottom habitat conducted at Molokini Islet, as that site did not naturally fit within any other location grouping, and one survey was clearly inadequate to characterize a distinct location by itself. Of the other 103 surveys, 14 conducted in 2006 were resurveys of sites that had been surveyed in 2005. For those sites, we averaged 2005 and 2006 data to produce site estimates. We ended up with data from 89 distinct sites.
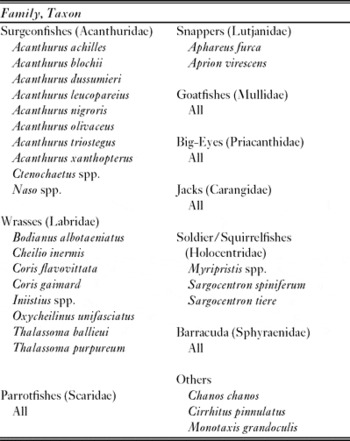
The majority of analyses were conducted using estimated biomass per unit area of fishes recorded on belt transects. Mass of individual fish was calculated from estimated lengths using size to weight conversion parameters from FishBase (Froese & Pauly Reference Froese and Pauly2000) or the Hawaii Co-operative Fishery Research Unit at the University of Hawaii. Fish survey data were pooled into a number of broad categories, including (1) all fish combined and (2) ‘target fish’, namely reef species targeted or otherwise regularly exploited by fishers throughout much of the MHI (Table 2; note that several families including Albulidae, Belonidae, Elopidae, Mugilidae, Scombridae, would normally be considered as ‘Target fish’ taxa, but were not recorded during the fish surveys we took data from). Kyphosidae are also taken by fishers in Hawaii, but were excluded from analyses due to extremely clumped distributions. In addition, we derived two variables to represent measures of important breeding individuals of target fish: (1) ‘prime spawner biomass’, being biomass of target fish >70% of the maximum length reported for the species (Froese & Pauly Reference Froese and Pauly2000; Randall Reference Randall2007), and (2) ‘prime spawner richness’, being the number of species of target fish for which large individuals (size >70% of maximum reported size) were observed on belt transects. We selected 70% of maximum size as the cut-off point to balance the desire to restrict analysis to notably large individuals, which are likely to be important breeding individuals (Birkeland & Dayton Reference Birkeland and Dayton2005), with the need to ensure that there were sufficient data for meaningful analysis. We developed target fish classifications prior to analysis in consultation with HDAR staff and the NOAA National Marine Fisheries Service Fisheries Extension Agent for Hawaii.
Target fish taxa used in analyses.

We also wished to make finer scale assessments of differences in fish assemblages among locations, to compare trends among moderately to heavily targeted taxa with those among lightly targeted taxa. Recognizing that few species were encountered frequently enough over a sufficiently wide range of sites for comparisons to be meaningful at the species level, we aggregated data into higher taxonomic and functional groupings. Six groups of fishes which we considered to be moderately to heavily targeted by fishers or vulnerable to overfishing were: (1) large parrotfishes (Chlorurus perspicillatus, Scarus rubroviolaceus and Calotomus carolinus); (2) large wrasses (Oxycheilinus unifasciatus, Bodianus albotaeniatus, Coris flavovittata and Thalassoma ballieui); (3) target surgeonfishes (all listed in Table 2); (4) redfishes (all soldierfish, bigeyes and squirrelfishes in Table 2); (5) goatfishes (all species); and (6) targeted apex predators (all apex predators other than the introduced grouper roi, Cephalopholis argus, which is lightly fished in the MHI due to concerns about ciguatera toxicity; Dierking Reference Dierking2007). We also aggregated data for six groups of lightly or negligibly fished taxa: (1) non-target wrasses (all wrasse species other than those listed in Table 2); (2) non-target surgeonfishes (Acanthurus nigrofuscus and A. nigricans); (3) hawkfishes (all species except the stocky hawkfish, Cirrhitus pinnulatus); (4) triggerfishes excluding planktivores (all species of triggerfish except Melichthys spp. and Xanthichthys spp., those taxa having too highly clumped distributions for meaningful analysis); (5) corallivorous butterflyfishes (Chaetodon multicinctus, C. ornatissimus, C. quadrimaculatus and C. unimaculatus); and (6) benthic damselfishes (all Plectroglyphidodon and Stegastes species).
We also calculated encounter rates for species of interest by pooling all fish data from each survey (belt transect and SPC quantitative data plus presence-absence data from all three divers) and then determining how frequently those species were observed during surveys within particular location classifications. Species of interest were those we believed to be vulnerable to overfishing, and which were sufficiently rare or skittish that they would be recorded infrequently on belt transects; this was all apex predators plus the bandit angelfish (Apolemichthys arcuatus), which is heavily targeted by the aquarium trade and has substantially declined in abundance within normal diving depths on heavily-collected reefs (HDAR, unpublished data 2007).
Our primary question of interest was whether there were any associations between the fish assemblage measures and local human population density among areas readily accessible to fishers (Table 1, accessible and populous or remote locations). Among those locations, trends in coral cover or fish population parameters along local human population gradients were analysed specifically using Spearman's rank correlation tests because we could not assume linear relationships between fish assemblage metrics and human population density, however transformed. In order to assess scope for relationships between fish metrics and human population density to be confounded by differences in habitat among locations, we used Pearson's correlations to determine strengths of association between human population density and the two habitat variables, coral cover and site depth. Human population density was natural log transformed, and coral cover was arcsine transformed prior to that analysis. A secondary question was whether there was evidence of differences in fish assemblages between locations that we assumed were relatively lightly fished (Table 1, remote or inaccessible) and those that were likely to be more heavily fished (Table 1, accessible and populous). Using data pooled by location, differences in coral cover, fish biomass and richness were compared using 1-way ANOVA. Prior to ANOVA, data were tested for homogeneity of variance using Levene's Test. All analyses were performed using JMP-IN 5.1 (SAS 2003).
RESULTS
Site/sub-area characteristics
Mean human population within 15 km of survey sites varied by a factor of >1000 among locations (Table 1). The two ‘remote’ locations (Volcano region of the Big Island and Niihau-Lehua) had means of 39 and 94 people resident within 15 km of survey sites, while human population at other locations ranged from 938 at Molokai, to 66 504 for sites on Windward Oahu (Table 1). The two ‘inaccessible’ locations, Hamakua and North-East Maui, had moderate to high mean population levels relative to other locations with, respectively, 4823 and 24 898 people resident within 15 km of surveyed sites (Table 1).
Similarly, locations varied substantially in terms of shoreline accessibility (Table 1). Shoreline access scores confirmed that Hamakua and North-East Maui sites were mostly inaccessible to shoreline fishers: accessibility of all four Hamakua sites was rated as ‘3’ (i.e. no road access, and shoreline structure sufficient to make it very difficult or impossible to access shoreline by foot); shoreline at three of five North-East Maui sites was rated as ‘3’, and the two others were rated as ‘2’ (shoreline structure may limit access by fishers). One other location, Lanai, had one site rated as a ‘3’, three sites as ‘2’, and 2 sites as ‘1’ (i.e. it contained several sites which were at least partially inaccessible). The majority of sites at all other locations were considered to be highly accessible, being rated as ‘1’ (Table 1).
Coral cover varied considerably among locations, from 4.3 ± 1.5% (mean ± SD) at Windward Oahu, to 51.2 ± 23.0% at Molokai (Table 1). ‘Remote’ or ‘inaccessible’ locations did not differ in coral cover from ‘accessible and populous’ locations (R/I: n = 4; mean ± SE = 17.2 ± 4.7%, A&P: n = 14; 28.3 ± 3.2%, ANOVA F[1,16] = 2.9, p = 0.11). Among accessible locations (Table 1, R or A&P) there were no trends in coral cover associated with local human population (n = 16, Rs = −0.07, p = 0.80).
Among accessible locations, correlations between human population density and habitat variables (coral cover and depth) were weak at best (n = 16, with depth: r = −0.11; p = 0.69, with coral cover: r = −0.10; p = 0.72).
Fish stocks general
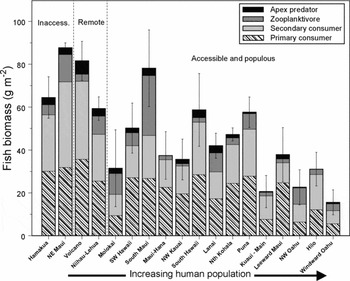
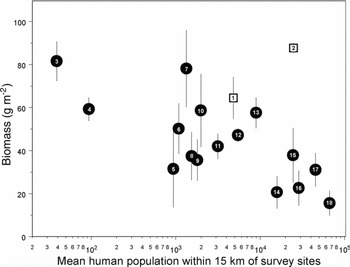
Total fish biomass among locations ranged from 15.6 ±10.1 g m−2 (mean ± SD) at Windward Oahu sites, to 87.7 ± 5.2 g m−2 at North-East Maui (Fig. 2). The dominant consumer groups by biomass were primary consumers (herbivores), which made up 29–65% of total fish biomass (mean = 45 ± 10%). Secondary consumers (invertebrate feeders, small predators) made up around 1/3rd of total fish biomass (mean = 38 ± 8%), and apex predators made up 0–8% of total fish biomass (mean = 4 ± 3%, Fig. 2). The grouper roi (Cephalopholis argus) made up the bulk of apex predator biomass at most locations, and >90% of total apex predator biomass at 10 of 18 locations.
Mean fish biomass by consumer group per location. ‘Inaccessible’, ‘remote’ and ‘accessible and populous’ locations are sorted in order of increasing local human population density (lowest left, highest right). Error bars represent SE of total fish biomass at survey sites within each location.

Trends in fish assemblage metrics at accessible locations
Among the 16 locations classified as accessible, total fish biomass was negatively correlated with human population resident within 15 km of survey sites (Rs = −0.68, p = 0.004; Fig. 3).

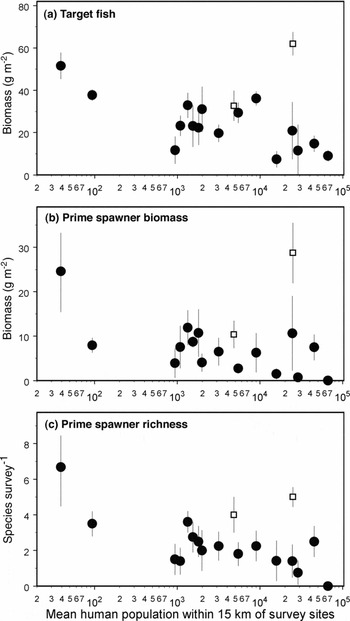
Target fish biomass declined as local human population density increased (Rs = −0.64, p = 0.008; Fig. 4). Prime spawner biomass and richness were both negatively correlated with local human population (n = 16, respectively, Rs = −0.58, p = 0.02 and Rs = −0.59, p = 0.02). Oahu locations had notably low values of prime spawner biomass and richness: large individuals of target fish species were only observed on belt transects during three of eight surveys at North-West Oahu sites, and none at all were seen during the three surveys at the most populous of all study locations, Windward Oahu.

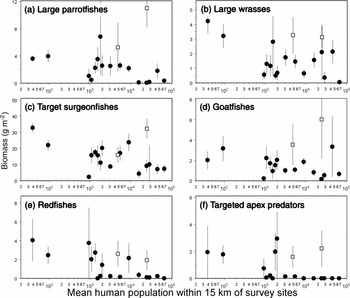
Biomass of large parrotfishes, redfishes and targeted apex predators were all negatively correlated with local human population (Rs = −0.60, p = 0.01; Rs = −0.73, p = 0.001; Rs = −0.71, p = 0.002, respectively; Fig. 5). Target surgeonfish biomass tended to decline as human population increased, but the association was marginally non-significant (Rs = −0.49, p = 0.06; Fig. 5) due in large part to very low surgeonfish biomass at three of four sites at one intermediate population location, Molokai. Large wrasse biomass was highest at the two remote locations, but there was no trend associated with increasing human population across the 18 accessible locations as a whole (Rs = −0.35, p = 0.18; Fig. 5). There was no rank correlation between goatfish biomass and human population, principally because of very high goatfish biomass at the second most populous location, Hilo (Rs = −0.34, p = 0.20; Fig. 5).
Trends in biomass of prime-target and/or vulnerable fish groupings. Data points, and error bars as for Figure 3.

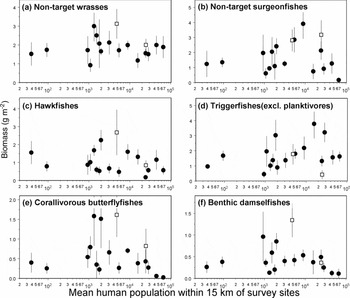
There were no correlations between human population density and biomass of any of the six lightly or negligibly fished groups (Fig. 6).
Trends in biomass of lightly-targeted fish groups. Data points, and error bars as for Figure 3.

Fish assemblage metrics at ‘inaccessible’ locations
In spite of relatively high local human population density, the two locations considered largely inaccessible to shoreline fishers had high biomass of most target and vulnerable fish groups (Figs 5–6). One of the inaccessible locations, Hamakua, also had relatively high biomass of several lightly- or negligibly-fished groups.
Comparison between remote/inaccessible and accessible and populous locations
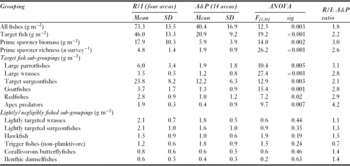
Mean fish biomass at locations classified as R/I locations was 1.8 times that at A&P locations (ANOVA F[1,16] = 12.5, p = 0.003; Table 3). Target fish biomass, prime spawner biomass and prime spawner richness were respectively 2.2, 3.0 and 2.6 times greater at R/I locations than in A&P locations (Table 3, p < 0.005).
Comparison of fish metrics between four remote/inaccessible (R/I) locations and accessible and populous (A&P) locations (Table 1). Target fish are those listed in Table 2. Prime spawner biomass is biomass of target fish >70% of maximum size, intended to represent key breeding fishes. Prime spawner richness is the number of species of target fishes for which at least one individual larger than >70% of maximum size was recorded on belt transects.

Mean biomass of the six heavily-targeted or vulnerable aggregated taxonomic groupings was 2.1 to 4.2 times higher at R/I locations compared to A&P locations, the differences significant for all six target groupings (Table 3, p < 0.05). There were no differences between R/I and A&P locations among the six lightly- or negligibly-fished taxonomic groupings. Relative to A&P locations, biomass of non-target groups was 0.7 to 1.5 times that at A&P locations (Table 3).
Oahu locations had notably low biomass and richness of several target groupings. Mean prime spawner biomass at R/I locations was 34.5 times that at all Oahu sites combined, prime spawner richness was 8.8 times, large parrotfish biomass was 26.6 times and large wrasse biomass 12.5 times mean values for Oahu.
Taxa of special interest
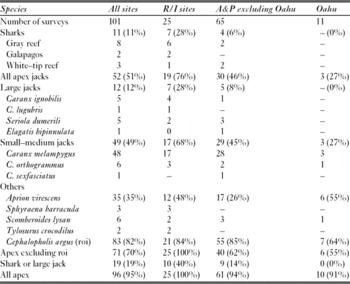
The most commonly encountered apex predator was the grouper Cephalopholis argus, which was observed during 83 of 101 surveys. All other apex predators combined were recorded during 71 of 101 surveys in total. Among apex predators vulnerable to fishery-depletion excluding C. argus, encounter rates were high at R/I locations (observed on 100% of survey dives) compared to A&P locations (Table 4, 55% of surveys excluding those at Oahu).
Apex predator encounter rates. A&P = accessible and populous, R/I = remote or inaccessible (Table 1).

Oahu sites were particularly depleted in terms of apex predators. Sharks and large jacks, which were seen during 40% of surveys at sites at R/I locations, were not observed at all during the 11 Oahu surveys. Other than C. argus, the only apex predators seen on Oahu reefs were the medium-sized jack Caranx melampygus (seen during three of 11 surveys), and the green jobfish (uku) Aprion virescens (seen during six of 11 surveys).
Bandit angelfish (A. arcuatus) were observed during 32 of 101 surveys, including 18 of 25 at R/I locations.
DISCUSSION
The 89 coral reef survey sites included in this study were widely distributed around the populated islands in the Hawaiian archipelago. Consequently, although our analysis was restricted to hard-bottom mid-depth habitats, there remained great variability among study areas in factors which influence fish assemblage composition, including structural and habitat complexity, number and size of shelter holes, benthic community composition and exposure to wave energy (Jennings et al. Reference Jennings, Boulle and Polunin1996; Friedlander et al. Reference Friedlander, Brown, Jokiel, Smith and Rodgers2003, Reference Friedlander, Brown and Monaco2007b; Wilson et al. Reference Wilson, Graham, Pratchett, Jones and Polunin2006). Despite those multiple sources of variability, which might be expected to obscure broad trends relating to single factors, we found clear and consistent negative associations between human population density and biomass of fishes in a range of functional and taxonomic groupings. Furthermore, the extent of the impact of increasing human population density on local fish populations was substantial: total fish biomass at the two ‘remote’ locations was nearly three times that at the two most populous locations.
Data on fishing pressure are not available for our study locations, and we have therefore used human population density as a proxy for fishing pressure. While we recognize that human population is an imperfect predictor of fishing pressure (Cinner & McClanahan Reference Cinner and McClanahan2006), and there are substantial cultural and social differences among various parts of the Hawaiian Islands, it seems likely that the sheer scale of differences in human population density among our study locations was such that the rank ordering of human population pressure we used in analyses sufficiently closely corresponded to fishing pressure for human population to be a meaningful proxy in this case. Certainly, there are a number of reasons for believing that declines in biomass of some fish groups and in prime spawner richness along human population gradients were primarily driven by fishing pressure, rather than by any decline in habitat or other environmental quality at more populous locations. The clearest such evidence was that negative associations between fish biomass and local human population were evident among most targeted or vulnerable groupings, but there were no comparable indications of human impact among lightly or negligibly targeted groups. It seems unlikely that habitat or other environmental degradation would selectively affect target groups only, particularly as both the target and non target groups we considered included a broad range of taxonomic groupings with widely differing habitat requirements.
Further evidence that fishing pressure was the prime factor driving fish trends comes from consideration of fish assemblages at locations with high human population but where shorelines were inaccessible to fishers. The two ‘inaccessible’ locations in our study had moderate to high local human populations, but both had relatively high biomass of fishes, including the target groups which were depleted at accessible and populous locations. For example, human population close to the North-East Maui sites was the third highest of the 18 locations in this study, yet total fish biomass, as well as biomass of several target groups, was the highest of all our study locations. In other words, it did not seem that proximity to high human population density was by itself associated with fish population declines, but rather that the crucial factor was proximity to human populations who were able to readily access, and therefore fish, nearshore waters.
While our study provides clear evidence of greater impacts of fishing on reef fish assemblages at locations with greater human population densities, the lack of any clear relationship between human population density and non-target fishes or with coral cover should not be interpreted as evidence that onshore development and urbanization have had no impact on coral reef habitat or environmental quality in the MHI. First, coral cover by itself is likely a weak indicator of the wide range of different forms of habitat or environmental degradation which could have occurred. In addition, anthropogenic degradation sufficient to impact fish assemblages could have been important at least at some of our sites but there would still be no relationship between human population and non-target fish biomass if, either: (1) habitat or environmental degradation did not scale to human population density (e.g. light development or de-vegetation of coastal areas prone to heavy sedimentation could lead to substantial degradation of adjacent reefs even where local human population density remains low (Jones et al. Reference Jones, McCormick, Srinivasan and Eagle2004)) or (2) degradation severe enough to cause declines in resident fish populations was largely limited to the most populated and urbanized parts of the state, and therefore, impacts were not detectable in a region-wide analysis. The second point may be particularly important because, as we describe above, survey cruises did not visit some of the most heavily impacted and well studied locations in Hawaii such as Kaneohe Bay and the south coast of Oahu, for which there is abundant evidence of habitat degradation in recent decades (Hunter & Evans Reference Hunter and Evans1995; Friedlander et al. Reference Friedlander, Brown, Jokiel, Smith and Rodgers2003; Williams et al. Reference Williams, Walsh, Miyasaka and Friedlander2006). However, while we recognize that habitat or other environmental degradation very likely has contributed to reef fish declines at some locations within the MHI (Williams et al. Reference Williams, Walsh, Miyasaka and Friedlander2006), and may also have been a factor at some of our study sites, it remains the case that it is not a plausible primary factor in the clear trends in target fish biomass we found along human population gradients. Instead, where significant habitat or environmental degradation occurs around heavily populated locations, its likely effects will be to exacerbate already severe impacts of intensive fishing, rather than being the main driver of any local declines in target fish stocks.
Although the relative remoteness or inaccessibility of some parts of the MHI appears to afford a degree of protection to coral reef fish stocks, our strong impression is that all the locations we classified as ‘remote’ or ‘inaccessible’ were fished to some extent. Even among ‘inaccessible’ locations, the average distance from survey sites to the nearest boat ramp was <25 km, and so, even though shore-based fishing was probably negligible, the relative availability of large prime-target fishes would likely make those areas sufficiently attractive to boat-based fishers for them to be visited at times when sea conditions allow. Given that even low levels of fishing can lead to substantial declines in target fish populations (Jennings et al. Reference Jennings, Grandcourt and Polunin1995; Dulvy et al. Reference Dulvy, Mitchell, Watson, Sweeting and Polunin2002), we have no reason to believe that fish biomass at R/I locations (59.3–87.7 g m−2) represents natural maxima which would occur if those areas were completely unfished. Corroborating evidence for that supposition comes from a recent study of Hawaii's Marine Life Conservation Districts (MLCDs), for which fish populations were surveyed in a range of habitat types using similar methods to ours (Friedlander et al. Reference Friedlander, Brown, Monaco and Clark2006, Reference Friedlander, Brown and Monaco2007b). Of the nine MLCDs which contained habitat comparable to that surveyed for our study, three were complete no-take reserves, but some forms of fishing were permitted within the other six. In the habitat type most comparable to that surveyed in our study (colonized hard-bottom), mean total fish biomass in five of six partial-closure MLCDs was within the range at the R/I locations (60–85 g m−2), but fish biomass at all three no-take reserves (105–170 g m−2) was substantially higher than at any of our study locations (Friedlander et al. Reference Friedlander, Brown, Monaco and Clark2006). At present, only 2.3% of nearshore waters in Hawaii are designated as MLCDs or other comparably protected reserves (HDAR unpublished data 2007), and so the lightly populated and naturally inaccessible areas which encompass around 15% of MHI nearshore waters (based on location boundaries in Fig. 1) may be quite important as partial refugia for target groups which are depleted around more populous locations, including sharks and other large apex predators. However, it is important to recognize that apex predator biomass in the isolated and virtually unfished North-western Hawaiian Islands (NWHI) is one to two orders of magnitude higher than in R/I locations (Friedlander & DeMartini Reference Friedlander and DeMartini2002), and even higher apex predator biomass has been recorded on extremely remote reefs of the northern Line Islands (Sandin et al. Reference Sandin, Smith, DeMartini, Dinsdale, Donner, Freidlander, Konotchick, Malay, Maragos, Obura, Pantos, Paulay, Richie, Rohwer, Schroeder, Walsh, Jackson, Knowlton and Sala2008). The species that make up the bulk of apex predator biomass on NWHI reefs, i.e. Caranx ignobilis, the green jobfish Aprion virescens and the grey reef and Galapagos sharks (Carcharhinus amblyrhynchos, C. galapagensis) are all highly mobile roving species (Lowe et al. Reference Lowe, Wetherbee and Meyer2004; Meyer et al. Reference Meyer, Holland and Papastamatiou2007a, Reference Meyer, Papastamatiou and Hollandb). Although the locations we classified as inaccessible are quite large (for example ‘Hamakua’ includes around 80 kilometres of coastline), clearly those areas do not afford sufficient protection to such wide-roving species for pristine apex predator populations to develop.
The broad comparisons between R/I and A&P locations mask the extent to which reef stocks were depleted around Oahu. Oahu constitutes 9.3% of the landmass of the Main Hawaiian Islands, but contains 71% of the population of the state (HBEDT [Hawaii Department of Business, Economic Development and Tourism] 2006). Aside from C. argus, no apex predators were recorded during Oahu belt transect surveys, and large apex predators such as sharks and the larger species of jacks were not even observed in the vicinity of sites during the 11 surveys there. Additionally, biomass of large parrotfishes on Oahu reefs was <4% of that at R/I locations. As large parrotfishes appear to be particularly important in preventing establishment of excessive macroalgae (Mumby et al. Reference Mumby, Dahlgren, Harborne, Kappel, Micheli, Brumbaugh, Holmes, Mendes, Broad, Sanchirico, Buch, Box, Stoffle and Gill2006), the paucity of those species may partly explain why many Oahu reefs have been overgrown by blooms of invasive algae in recent years (Smith et al. Reference Smith, Hunter and Smith2002). The dearth of large individuals of target fish on Oahu reefs was also striking: prime spawner biomass on Oahu reefs was <3% of the average at R/I locations, and those comprised only three species, all of which were mid-sized surgeonfishes. Fishes at the high end of their size range tend to be a disproportionately important component of total stock breeding potential due to greater fecundity of large individuals and higher survivorship of larvae produced by large fishes (Birkeland & Dayton Reference Birkeland and Dayton2005). The lack of large individuals of target species suggests that Oahu reefs have very low population fecundity of most prime target species.
CONCLUSION
The availability of a large research vessel to use as a platform for survey cruises made it possible to reach remote and inaccessible parts of Hawaii which have rarely if ever been surveyed until now, and therefore enabled the largest-scale assessment of MHI coral reef fish stocks to date. Our data set provides clear evidence that stocks of target and vulnerable taxa are severely depleted around accessible and populous locations in the MHI, and a number of lines of evidence indicate that fishing is the prime cause.
ACKNOWLEDGEMENTS
Data were made available by the Coral Reef Ecosystem Division of the National Oceanic and Atmospheric Administration (NOAA) National Marine Fisheries Service Pacific Islands Fisheries Science Center. Funding for surveys (as part of the Pacific Reef Assessment and Monitoring Program, RAMP) was provided by NOAA's Coral Reef Conservation Program. Greta Aeby, Bernardo Varga-Angel, Brian Zgliczynski, Craig Musburger, Darla White, Jeff Eble, Jason Leonard, Jill Zamzow, Steve Cotton, Paul Murakawa, and Tony Montgomery assisted with data gathering on cruises in 2005 and 2006 aboard NOAA ships Oscar Elton Sette and Hi'ialakai. Jeff Muir and Michael Lameier assisted with pooling of fish species into target and negligibly-fished groupings. Ivor Williams was supported by funding from the NOAA Center for Sponsored Coastal Ocean Science (award NOA06NOS4260200 to the University of Hawaii for the Hawaii Coral Reef Initiative).