Introduction
Developing robust and effective evidence-based policies for economic growth and food security should be the aim of all governments. However, data covering all aspects involved in policy initiatives and their implementation instruments are seldom available to policy makers. Over the past decade, the concept of using ecosystem services to measure the effectiveness of government socio-economic policies has attracted a lot of attention. Ecosystem services encompass both the economicReference Fisher, Turner, Zylstra, Brouwer, de Groot, Farber, Ferraro, Green, Hadley, Harlow, Jefferiss, Kirkby, Morling, Mowatt, Naidoo, Paavola, Strassburg, Yu and Balmford1 and non-economic benefits which ecosystems deliverReference Norgaard2. They are often defined as the benefits that humans obtain from ecosystems that support, directly or indirectly, human survival and quality of lifeReference Ehrlich and Mooney3–Reference Daily6. Some ecosystem system service benefits, such as crops, fish and freshwater (provisioning services), are tangible. Others such as pollination, erosion regulation, climate regulation (regulating services) and aesthetic and spiritual fulfillment (cultural services) are less tangible. The concept of ecosystem services has been adopted by many countries, but it is particularly important in developing countries which are experiencing accelerated degradation of ecosystem servicesReference Layke7.
In developing countries such as Malawi a dilemma facing policy makers and development workers is the need to strike a balance between improving the lives of the rural poor, without causing undue degradation of the ecosystem on which these people depend for their livelihoods. This is not an easy task, as demonstrated by the introduction of agricultural input subsidies in post-colonial Africa. An evaluation of policies in AfricaReference Dorward, Chirwa, Boughton, Crawford, Jayne, Slater, Kelly and Tsoka8 concluded that the main donors believed that agricultural input subsidies in the 1980s and 1990s had been ineffective and inefficient policy instruments. They argued that national agricultural input subsidies in Africa had contributed to government overspending and added to fiscal and macroeconomic problems. Agricultural input subsidies have also been criticized by environmentalists and others for causing environmental disasters in countries where subsidies were effective for agricultural production. The environmental impacts of the use of chemical inputs implicated in the Green Revolution (GR) technology package have caused serious soil and water degradationReference Dano9.
While we understand that subsidies, controversial as they may be, have been part of the development agenda in Malawi since the 1960s, there is a lack of information on how they influence provision of ecosystem services in the wider context. In this paper, we use the concept of ecosystem services to assess the link between ecosystems and human well-being in the Malawi context. As a case study, the influence of the Malawian government agricultural policy of fertilizer subsidy is examined and its ability to meet the ecosystem services' needs of the people is evaluated using the Millennium Ecosystem Service approach10, 11. Further, the effect of the subsidy programs on aspects of the wider environment and on the arable and forest land availability is investigated. Finally, the dynamics and the social-ecological temporal changes in the political, food security and economic status of the country under the different subsidy implementation phases are considered using the panarchy frameworkReference Gunderson and Holling12.
Data were obtained from the World resources Institute and FAOSTAT databases. Cereal requirements of the population, which mostly comprise maize, were computed from a calculated per capita cereal requirement of approximately 153 kg per annumReference Denning, Kabambe, Sanchez, Malik, Flor, Harawa, Nkhoma, Zamba, Banda, Magombo, Keating, Wangila and Sachs13. Data are presented on overall provisioning (food) services, gross domestic product (GDP) in US$ per capita and the total production per capita index.
Malawi Political Landscape and Food Production
Malawi is a small country in southern Africa with a population of approximately 13 million people. Overall, Malawi has one of the highest population densities in the world at 129 persons/km2. More than 40% of smallholders in Malawi are reported to cultivate less than 0.5 ha, with an average farm size of 0.28 ha.14 Areas with the smallest average farm size have the highest poverty, and poor households are much more likely to have farm sizes of less than 1 ha than households with income above the 40th percentile14.
The country has experienced significant changes in the political regimes since the 1960s. It was under British colonial rule from 1929 but became independent in 1964 and was governed as a one-party-state until 1994 when the first democratic government came to power.
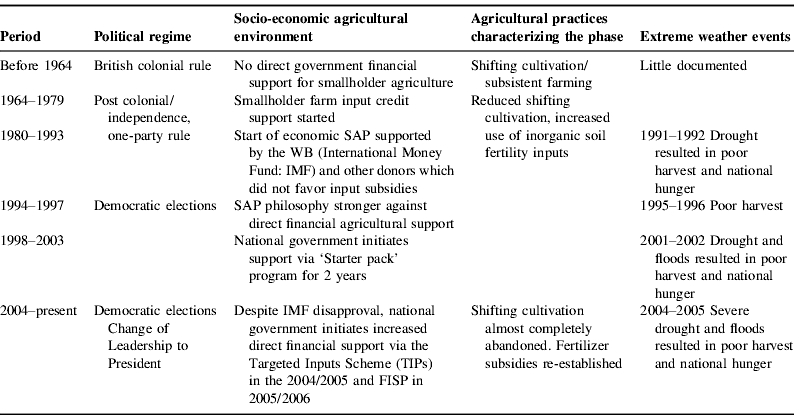
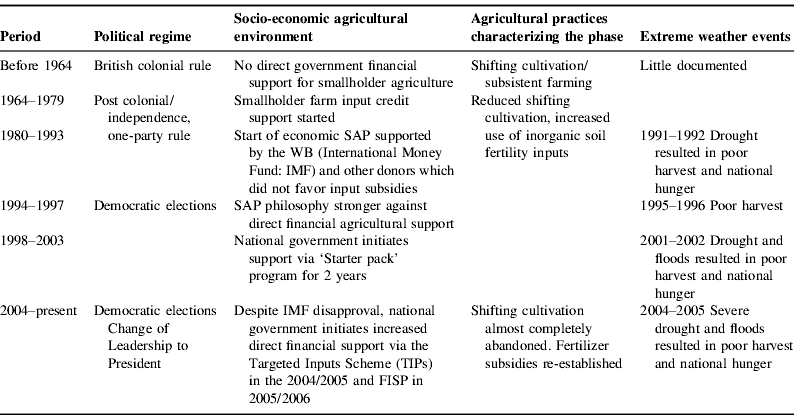
Malawi's economy is based on agriculture, which currently accounts for about 35% of Gross National Product and more than 80% of the country's export earnings15. At least 80% of agricultural produce comes from smallholder farmers on customary land. The rest is produced by commercial farmers on estates. The overall aim of successive Malawian governments has been to meet the subsistent food needs of the people and thereafter export agricultural products for cash generation. In order to achieve this objective, farmers in Malawi have been supported with various forms of input credit schemes to boost agricultural production since 1964 (Table 1).
Time line of factors associated with Malawian agriculture since the 1960s.
FISP, Farm Input Subsidies Program; SAP, Structural Adjustment Programs; WB, World Bank.
State Subsidies, Agricultural Productivity and Economic Growth
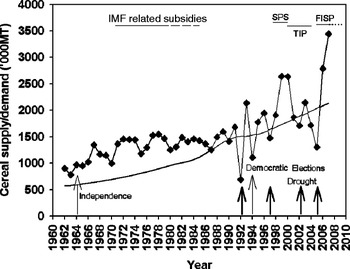
Malawi's agriculture has been characterized by small-scale farm-producers who have received varying degrees of input subsidy support over time. As stated above, conventional wisdom among policy analysts in the 1980s and 1990s was that subsidies had been ineffective and were inefficient policy instruments in AfricaReference Dorward, Chirwa, Boughton, Crawford, Jayne, Slater, Kelly and Tsoka8. It was commonly believed that they contributed to government over-spending as well as fiscal and macro-economic problemsReference Flora16. This thinking brought about structural adjustment programs (SAPs) instituted by the World Bank (WB) and the International Monetary Fund (IMF)Reference Fisher and Shively17. In response to these international pressures, Malawi has undertaken SAPs supported by the WB, the IMF and other donors since 198115. Owing to the erratic weather patterns and droughts in the 1992–1993, 1994–1995 growing seasons with subsequent poor crop harvests that seriously affected food production and persistent hunger, the Malawi government reintroduced government-funded subsidy programs on several occasions during the past two decades (Fig. 1). The Starter Pack Scheme (SPS) for example, ran basically from 1997 to 1999, and essentially distributed free packs of fertilizer and matching quantities of maize seed for 0.1 ha of land to farmers throughout the country. A similar scheme, the Targeted Inputs Scheme (TIPs) lasted from 2000 to 2004. In defiance of the international community and IMF disapproval of input subsidies, the current government reintroduced a large-scale input subsidy in the 2005/06 season referred to here as the Farm Input Subsidies Program (FISP) with the stated objectives of promoting access to and use of fertilizers in both maize and tobacco production. This was in response to another serious food shortage in 2004/2005 emanating from a serious drought that year (Fig. 1).
Cereals produced (square symbol) and cereal requirements (solid line) for Malawi (‘000 metric tons). Compiled from World Resources Institute (WRI) and Food and Agriculture Organization (FAO) data sources. Cereals include wheat, barley, maize, rye, oats, millet, sorghum, rice and buckwheat, for a complete definition please refer to the web page maintained by FAOSTAT at http://www.fao.org/waicent/faostat/agricult/prod-e.htm. Cereal requirements computed based on cereal production, population figures and the 2007 requirement of approximately 2 million tonsReference Denning, Kabambe, Sanchez, Malik, Flor, Harawa, Nkhoma, Zamba, Banda, Magombo, Keating, Wangila and Sachs13.

Input Subsidies and Cereal Production
Overall, it has been estimated that nationally maize production increased by 46% from 1.5 million tons in 1997/98 to around 2.2 million tons in 1999/2000. In the 2005–2006 season, which had good rains, the total maize production was more than double that of the 2004–2005 harvest, producing a surplus of 510,000 t above the national maize requirementReference Denning, Kabambe, Sanchez, Malik, Flor, Harawa, Nkhoma, Zamba, Banda, Magombo, Keating, Wangila and Sachs13. Incremental maize production attributed to the fertilizer subsidy was estimated at 300,000 to 400,000 t. The 2006–2007 harvest was estimated at 3.44 million t, an all-time national record for Malawi, generating a surplus of about 1.34 million t of maize grain above national requirementsReference Denning, Kabambe, Sanchez, Malik, Flor, Harawa, Nkhoma, Zamba, Banda, Magombo, Keating, Wangila and Sachs13.
Cereal production and estimated cereal demand by the population of Malawi is shown in Figure 1 (smooth curve for cereal demand). National cereal demand shows that generally Malawi had adequate supplies to meet the subsistent needs of the people from independence to 1986 (Fig. 1) but food deficits in the 1991–1992, 1993–1994, 1996–1997, 2000–2001, 2001–2002, 2003–2004 and 2004–2005 harvest years. These data signify how food insecure the country has been in the past 20 years.
Agriculture and the Economy
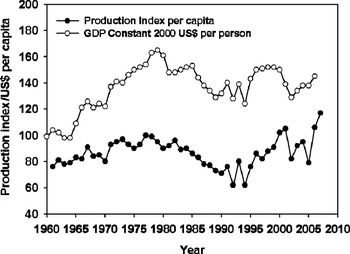
The importance of agricultural produce to the economy of Malawi can be illustrated using two common indices reported by the World Resource Institute: (1) GDP per capita and (2) the total production per capita index (Fig. 2). The data reveal that following independence in 1964 until around 1979 the country enjoyed some economic growth. This high economic growth rate was driven primarily by tobacco and tea exportsReference Chirwa18. The GDP growth for the first 15 years of independence averaged 6% every year, but both social and natural forces in the country (political power struggle and climatic extremes) resulted in a more erratic pattern of annual GDP thereafterReference Chirwa18. A critical policy reform on population and agriculture needs to be put in place in order to balance the land–population equation and to sustain the benefits from policies such as the FISP being implemented at present.
(○) GDP per capita, constant US$. Source: Compiled from World Resources Institute (WRI). GDP: a measure of the size of economies, reported here in million constant 2000 US$. GDP is the total market value of all final goods and services produced in a country in a given year, equal to total consumer, investment and government spending. In this case, it is shown in constant US$ to allow for the comparison of GDP across years without interference from the effects of inflation on prices. (•) The total production per capita index volume of the country's agricultural sector per person relative to the base period 1999–2001. The agricultural production index of WRI includes all crop and livestock products originating in the country. Intermediate agricultural products, including fodder crops, are not counted.

Land and Forestry Ecosystems
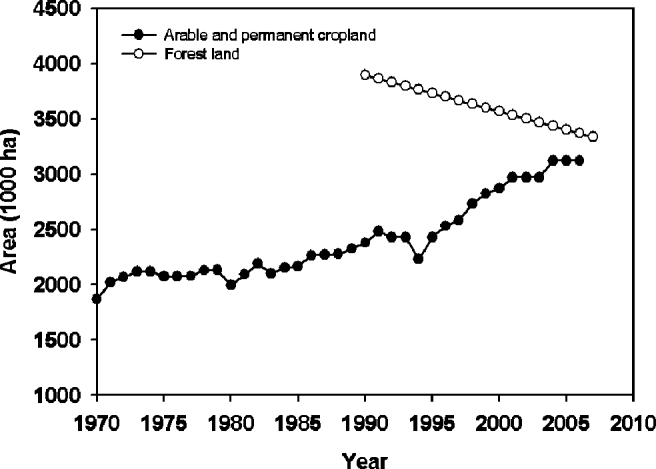
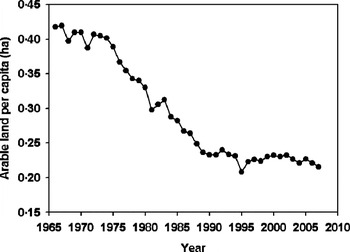
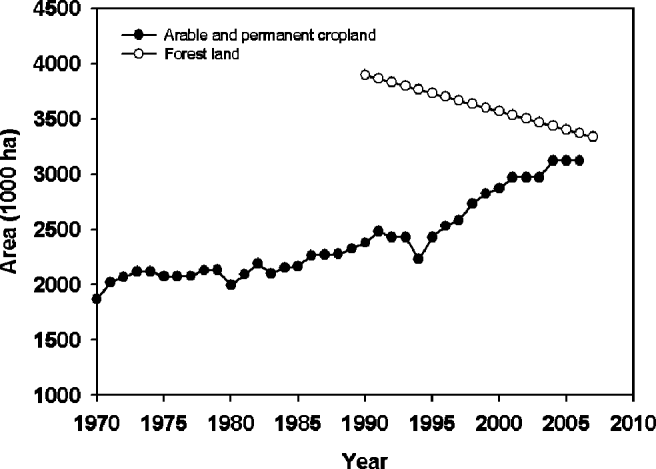
We evaluated the balance between forestry and arable land resources in the country (Fig. 3). The FAOSTAT database reports a steady decline in arable land per capita for Malawi since independence (Fig. 4). It is not possible from the data available to separate the two primary drivers of forest degradation, population increase and conversion of land for agriculture. However, population increase may be the more important driver as research has shown that households which were receiving a free packet of hybrid maize seed and chemical fertilizer had lower levels of commercial forest extraction than non-recipient householdsReference Fisher and Shively17. In addition, no measurable effect of starter pack receipt was found on forest clearing decisions. These results therefore suggested that the program raised agricultural output without encouraging agricultural land expansion. These findings indicated potential modest improvement in forest condition due to the SPSReference Fisher and Shively17. However, the starter pack was only exercised from 1997 to 1999 and is therefore deemed too short a period to make a full judgment of its effect on land-use changes. Long-term effects of such a practice may be different and are worth exploring.
FAOSTAT estimate of the forest and cropland in Malawi (cropland estimated manually, forest area estimated manually 2007 and a standard reduction factor applied in other years—see text for full explanation).
Arable land (ha) per capita for Malawi.

Fertilizer Subsidy and Delivery of Ecosystem Services
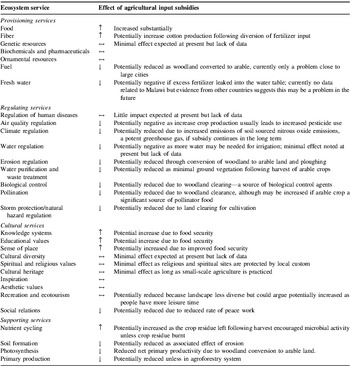
There is limited data on the influence of the fertilizer subsidy policies on ecosystem services within the wider society of Malawi other than food production. Data on ecosystem services such as water quality, fuel wood supply, cultural diversity, etc. are often not collected or, if collected nationally, are not accessible to national or international research communities. Similar observations on data availability were made on the global status of ecosystem services during the Millennium Ecosystem Assessment11. In this paper, we have estimated the expected change and direction of change associated with fertilizer subsidies on a suite of ecosystem services (Table 2). The direction of change is derived from personal observations by the main author and from suggestions provided by a wide range of scientific, grey and web-based publications, including the Millennium Ecosystem Assessment10, 11. In total, the influence of agricultural input subsidies was assessed for 29 ecosystem goods and services (Table 2). Although it is widely recognized, as detailed above, that the current fertilizer subsidy has had a positive influence on food production, its effect would be expected to have been negative for fuel wood production as people may become more prosperous and use more fuel, leading to the decline in forest. The Starter Pack Policy did not lead to increase in land clearance for cultivation in the southern region of MalawiReference Fisher and Shively17. However, evidence from land-use data (Fig. 3) suggests that there is potentially a negative long-term effect on the regulating services primarily through the actions of woodland clearance and increased soil disturbance. It is not clear whether fertilizer subsidy policies are directly increasing forest clearance rates or whether the driver is simply population pressure. It must be noted that the rate of forest clearance is probably subject to a larger uncertainty as it is modeled data. This highlights the need for governments to conduct studies for determining the effect that agricultural input subsidies have had on the forests and other ecosystem services.
Predicted effect of subsidies on Malawi ecosystem services based on Millennium Ecosystem Assessment definitions11.

We also anticipate that the potential of nitrogen leakage from agricultural fields into water courses would increase in the long term and it is possible that the provision of fresh water may also be compromised (Table 2) as has been reported by the Millennium Assessment in those areas with increased use of inorganic fertilizers11. Again, this is difficult to ascertain in the absence of reliable data.
Our observations suggest that as food security increases, the well-being of the population, level of education, social relations and sense of place delivered by an ecosystem would increase. We also believe that the increased level of fertilizer available to farmers through input subsidies has resulted in a greater number of the poorest farmers being able to support their families without the need to work on more wealthy farms. This may effectively reduce the employment of casual workers which may lead to reduced social relations in the community. The hypothesis here is that subsidies lead to improved food sufficiency for small farmers as evidenced by the data presented above and reduces their dependency as casual farm laborers on other commercial and large farmers. This would then reduce social interactions among the communities. Although in some places, e.g., large estates, the landscape has become more homogeneous, with cheap fertilizer, this may also bring about a negative effect on the recreation and ecotourism offered by these ecosystems due to declining forest resources. This was considered a small influence in Malawi to date as ecotourism is currently not fully developed as an ecosystem service and a direct link between subsidy and forest clearance has not been substantiated.
The supporting services are by definition a composite of many complex interactions and it is therefore more difficult to predict the influence of fertilizer policy changes on them. Nonetheless, it is estimated that more intensive agriculture will reduce soil formation, photosynthesis and water cycle especially when inorganic fertilizers from subsidies are used exclusive of organic amendments such as applying green manures from agroforestry. Our assessment suggests that overall around 50% of the ecosystem services considered in Table 2 may be negatively affected by agricultural input subsidies if Malawi embraces the use of inorganic fertilizer as seen in other countries around the world11. Most concern is centered on the regulating and supporting services with 88 and 75% of services, respectively, listed in Table 2 estimated to be potentially negatively influenced by agricultural input subsidies.
It is clear from this analysis that there are insufficient data to accurately determine the effect of agricultural input subsidies on a wide array of ecosystem services. This analysis is important to highlight the area on which the government should concentrate its efforts. As many of the services are directly related to land-use change, this would appear to be the most important area for government scrutiny.
A Social-ecological Systems' Perspective of Malawi's Agriculture and Input Subsidies
In order to obtain a clearer understanding of the interactions of the social-ecological system of Malawi and the influence of agricultural input subsidies we utilized the panarchy modelReference Gunderson and Holling12. Panarchy had its origins in Holling's meticulous observation of the ecology of forests. Holling noticed that healthy forests all have an adaptive cycle of growth, collapse, regeneration and growth again and that this cyclic phenomenon is applicable to social and economic facets of the world. According to the web-based encyclopedia Wikipedia (http://en.wikipedia.org/wiki/Panarchy; accessed 18 June 2010), the term panarchy has in fact been coined separately by scholars in international relations to describe the notion of global governance and by system theorists to describe non-hierarchical organizing theories. A panarchy here is a nested set of adaptive cycles operating at discrete scalesReference Gunderson and Holling12. The adaptive cycle embraces two opposites: growth and stability on the one hand, change and variety on the other. The adaptive cycle consists of four phases: (1) ‘exploitation’ (r); (2) ‘conservation’ (K); (3) ‘release’ (Ω) or ‘creative destruction’ and (4) ‘reorganization’ (α). The shape looks like a mobius strip, a distorted figure eight or infinity symbol floating in three-dimensional space with conductivity, potential and resilience as the three axesReference Gunderson and Holling12.
Discontinuities are thresholds between the dynamic levels, i.e., adaptive cycles, of a panarchyReference Gunderson and Holling12. Discontinuities are manifest in key cross-scale variables. Three distinct kinds of change are reported within panarchies: (1) incremental change in the r and K phases, which are smooth and fairly predictable; (2) abrupt change in the transitions from K through Ω and α; and (3) transformational learning, meaning change involving several panarchical levels and interaction between different sets of labile variablesReference Gotts19.
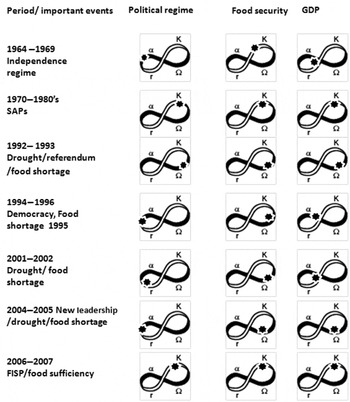
In order to get a clearer understanding of the impact of policy decisions on the food security of the Malawi nation, we use the panarchy model to examine the social ecological changes that have occurred in the course of the agricultural policies described in this paper. Figure 5 has been constructed to show a time course of Malawi agriculture in terms of its political landscape, food security status and GDP. The time course is based on periods of change in either political regime and/or incidences of extreme weather events which are considered to drive the adaptive cycles under discussion. These are tipping points in the panarchy. We interpret the adaptive scales for the political regime, GDP and food security using knowledge from the literature and data presented in Figures 1 and 2.
Series of adaptive cycles of the (i) politics regime, (ii) food security and (iii) economic growth (GDP) in Malawi at important time periods in the evolution of their agricultural policy following independence.

Panarchy Adaptive Cycles of Malawi Policies and Agriculture
The newly won independence of 1964 meant that the country was politically in its re-organization (α) phase of the panarchy following the collapse of the colonial rule which had in panarchy terms undergone a ‘creative destruction’ (Ω), i.e., tipping point in the civil governance of the country. Being an agro-based economy, the post-independence years (1964–1969) saw Malawi investing heavily in agriculture, which resulted in a growth of the food sector and the economy (GDP). Data on GDP (Fig. 2) and overall cereal production (Fig. 1) show a relatively steady period of growth, while the nation reorganized politically and experienced growth of the economy and increased food security (panachy phase r). This lasted between 1970 and 1980, when Malawi also enjoyed a period of fairly stable government. The withdrawal of agricultural input subsidies as a result of the SAPs weakened farmers' productivity towards the end of the 1980s, putting the country on the verge of food security collapse (Fig. 1, 1987 food deficit). This was associated with an obvious decline of the GDP from around 1982 (Fig. 2). Malawi also suffered a severe drought in 1992–1993 rainy seasons. With the phasing out of the SAPs and mounting political pressure for political reforms, the systems crashed in all the three parameters during this period. There was a referendum for change in 1993 calling for a democratic government and concurrently a serious food shortage and sharp decline in the GDP (Figs. 1 and 2). A new democratic government came into power in 1994 hence Malawi again went into a political reorganization phase (α). Food security and GDP crashed at this point. Similarly the drought of 2001–2002 caused serious food shortage and had a knock-on effect in terms of GDP. Politically, this experimental democracy is judged to be in the exploitation (r) phase of the adaptive cycle.
A new political leadership came into power in 2004 signaling yet another political reorganization phase (α). At the same time, there was a serious drought that led to a further sharp decline in food security and the GDP in 2005 leading to a release phase. The hard lessons learnt from the 2004–2005 hunger period caused the government to reorganize itself and reintroduce agricultural input subsidies (FISP) in a more extensive form than previously done. This has led to the current stable political regime with ensuing growth of the food and economic sector. Subsequently, Malawi has registered the highest growth in GDP of 9.7% for a decade in 200815.
This assessment using the panarchy model highlights the link between the three indicators of human well-being under discussion. Civil society within the country is not stable unless all three aspects are in the conservation phase (K) of their respective adaptive cycles, as indicated in Figure 5 for the time period 1970–1980s and 2006 to the present. The panarchy model is useful here as it can offer some insight into the future. The model predicts that the conservation phase has inherent low resilience and is therefore likely to crash. This can be avoided or minimized if the tipping points can be recognized and mitigated against early enough. An obvious tipping point in the recent past has been extreme weather events (droughts and floods) which are predicted to increase as a result of climate changeReference Shongwe, van Oldenborgh, van den Hurk, de Boer, Coelho and van Aalst20. This analysis would therefore support, as a matter of urgency, initiatives which aim at constructing flood defenses and irrigation systems and reforestation to mitigate drought. Such constructions may have significant effect on the delivery of other ecosystem goods and services, therefore a holistic approach considering the full suite of ecosystem services is recommended.
Conclusion and Recommendations
The analysis conducted in this paper highlights the need to consider all policy options and delivery mechanisms in a holistic manner. At its simplest level, a government might consider the production of agricultural products and the wealth of its citizens as a good indicator of effective governance. However, as suggested by the analysis of ecosystem goods and services conducted here, unless the regulating and supporting services are explicitly considered, the social and economic system will not be sustainable. The framework outlined in Table 2 highlights many different types of services which need to be considered and does not completely fail in data-deficient situations. It can also be used within a decision support system to highlight areas for future monitoring and research. The panarchy approach is useful in order to help understand such complex systems. The current global push for evidence-based policy formulation in democracies requires simple, easily implemented, robust tools and our analysis suggests that panarchy provides a suitable framework.