Statement of Research Significance
Research Question(s) or Topic(s): This study aimed to update the normative data of the Italian Stroop Color-Word Test (SWCT), not only addressing interference indices but also individual completion times and error counts across the three conditions, and to provide evidence for its construct validity. Main Findings: Older age and lower education were associated with poorer performance. Women showed faster reaction times in color naming. Word reading and color naming were associated with processing speed, whereas interference performance was associated with inhibitory control, working memory, and set-shifting/cognitive flexibility. These findings support the notion that the SCWT and its interference indices being valid executive function measure. Study Contributions: The present study provides updated normative data and empirical evidence supporting the construct validity of the short form of the SCWT. The availability of condition-specific norms will help users discriminate between processing-speed deficits, selective interference difficulties, and more generalized executive dysfunction.
Introduction
The Stroop Color-Word Test (SCWT) is one of the most widely used performance-based instruments for the assessment of processing speed and executive functioning (EF) (Scarpina & Tagini, Reference Scarpina and Tagini2017). The SCWT typically includes three conditions: (1) word reading (W), in which examinees are asked to read aloud color words printed in black as quickly as possible; (2) color naming (C), in which examinees are required to name, as quickly as possible, the color of a series of uniformly colored patches; and (3) color-word interference (CW), in which color words printed in incongruent ink colors are presented and examinees are instructed to name the ink color rather than read the word. In terms of both accuracy and response time, performance typically deteriorates in the CW condition compared with the W and C conditions, reflecting the need to inhibit the automatic reading response in favor of task-relevant color naming (MacLeod & MacDonald, Reference MacLeod and Dunbar1988; Stroop, Reference Stroop1935).
Accordingly, the SCWT is thought to assess both processing speed-primarily indexed by performance in the word-reading and color-naming conditions-and executive functioning (EF) components such as interference control, response inhibition, and cognitive flexibility, which are most prominently engaged during the color-word interference condition (Jensen & Rohwer, Reference Jensen and Rohwer1966; Stroop, Reference Stroop1935). This interpretation is supported by neuroimaging evidence indicating that SCWT performance depends on the integrity of prefrontal networks implicated in processing speed and EF, including the inferior and dorsolateral prefrontal cortices as well as the anterior cingulate cortex (Egner & Hirsch, Reference Egner and Hirsch2005; Harrison et al., Reference Harrison, Shaw, Yücel, Purcell, Brewer, Strother, Olver, Nathan and Pantelis2005).
Consistent with its sensitivity to executive dysfunction, impaired performance on the SCWT has been systematically reported across a wide range of neurological and psychiatric conditions characterized by dysfunction of prefrontal networks. These include Alzheimer’s disease (Amieva et al., Reference Amieva, Phillips, Della Sala and Henry2004), Parkinson’s disease (Fera et al., Reference Fera, Nicoletti, Cerasa, Romeo, Gallo, Gioia, Arabia and Quattrone2007), frontotemporal degeneration (Dopper et al., Reference Dopper, Rombouts, Jiskoot, den Heijer, de Graaf, de Koning, Seelaar and van Swieten2014), dementia with Lewy bodies (Johns et al., Reference Johns, Phillips, Belleville, Goupil, Babins, Kelner and Chertkow2009), vascular cognitive impairment (Kramer et al., Reference Kramer, Reed, Mungas, Weiner and Chui2002), multiple sclerosis (Denney & Lynch, Reference Denney and Lynch2009), major depression (Epp et al., Reference Epp, Dobson, Dozois and Frewen2012), and schizophrenia (Westerhausen et al., Reference Westerhausen, Kompus and Hugdahl2011).
In Italy, normative studies have been conducted for several versions of the SCWT (Scarpina & Tagini, Reference Scarpina and Tagini2017), including a version closely aligned with the original paradigm proposed by Stroop (Reference Stroop1935), which comprises five colors and 100 items per condition (Amato et al., Reference Amato, Portaccio, Goretti, Zipoli, Ricchiuti, De Caro and Siracusa2006; Barbarotto et al., Reference Barbarotto, Laiacona, Frosio, Vecchio, Farinato and Capitani1998; Valgimigli et al., Reference Valgimigli, Padovani, Budriesi, Leone, Lugli and Nichelli2010). For this version, relatively recent normative data have been provided by Brugnolo et al. (Reference Brugnolo, De Carli, Accardo, Amore, Bosia, Bruzzaniti, Serveta, Girtler and De Leo2015).
Interestingly, in order to improve the degree of feasibility of the SCWT in populations with severe cognitive impairment and significant fatigability, as well as within time-restricted settings, a short form (SCWT-SF) of the Italian version of the test has also been proposed by Caffarra et al. (Reference Caffarra, Vezzadini, Dieci, Zonato and Venneri2002), consisting of 30 items (10 per condition) and three colors. Despite its widespread use (Vaccaro et al., Reference Vaccaro, Lorenzini, Giaquinto, Matascioli, Carnevale, Sciancalepore, Morone, Canevelli, Salvi, Di Pucchio and Bacigalupo2024), norms for the Italian SCWT-SF date back 23 years and have never been updated since. Given the major socio-demographic changes that occurred in Italy over the last two decades, such as the increased life expectancy and the rise of baseline educational attainment levels, updating cognitive test norms is pivotal for them to validly reflect the characteristics of the present-day Italian population (Gasparini et al., Reference Gasparini, Scandola, Salati, Margiotta, Barbetti, Diana, Righetti, Bertagnoli, Gambina and Moro2025; Siciliano et al., Reference Siciliano, Chiorri, Battini, Sant’Elia, Altieri, Trojano and Santangelo2019). Such an updating process has been, in fact, undertaken by the Italian scientific community for several cognitive tests of widespread use over the last years (Aiello et al., Reference Aiello, Esposito, Gramegna, Gazzaniga, Zago, Difonzo, Appollonio and Bolognini2022a, Reference Aiello, Gramegna, Esposito, Gazzaniga, Zago, Difonzo, Appollonio and Bolognini2022b; Facchin et al., Reference Facchin, Pegoraro, Rigoli, Rizzi, Strina, Barera, Daini and Guarnerio2024; Gasparini et al., Reference Gasparini, Scandola, Amato, Salati, Facci, Gobbetto, Gambina and Moro2024, Reference Gasparini, Scandola, Salati, Margiotta, Barbetti, Diana, Righetti, Bertagnoli, Gambina and Moro2025; Ricci et al., Reference Ricci, Ruggeri, Gnisci, Pizzoni, Gerace and Blundo2022; Siciliano et al., Reference Siciliano, Chiorri, Battini, Sant’Elia, Altieri, Trojano and Santangelo2019). More recently, Luzzi et al. (Reference Luzzi, Cherubini, Rosettani, Baldinelli, Fiori, Silvestrini and Scandola2026) provided updated normative data for an alternative short version of the SCWT characterized by a greater number of stimuli (50 vs. 30), an additional reverse Stroop-like condition compared to the version proposed by Caffarra et al. (Reference Caffarra, Vezzadini, Dieci, Zonato and Venneri2002).
Moreover, the original work by Caffarra et al. (Reference Caffarra, Vezzadini, Dieci, Zonato and Venneri2002) focused on providing norms for only two interference indices: the Time Interference Effect (TIE), computed as CWTime−[(CTime+WTime)/2], and the Error Interference Effect (EIE), computed as CWErrors−[(CErrors+WErrors)/2]. Hence, normative data for “raw”, individual completion times and errors across the three conditions/sections of the SCWT-SF (W, C, CW) are currently lacking in our Country – even though these data would allow users to exploit the full potential of this test (Scarpina & Tagini, Reference Scarpina and Tagini2017). In its current form, Caffarra et al.’s (Reference Caffarra, Vezzadini, Dieci, Zonato and Venneri2002) SCWT-SF can primarily be regarded as a measure of EF; however, it does not provide information on examinees’ “pure” processing speed abilities, which would instead be captured by time- and accuracy-based indices derived from the W and C conditions.
Finally, Caffarra et al. (Reference Caffarra, Vezzadini, Dieci, Zonato and Venneri2002) did not assess the validity of their newly developed SCWT format, despite the central role of this psychometric property in determining an instrument’s suitability for clinical use (Aiello et al., Reference Aiello, Rimoldi, Bolognini, Appollonio and Arcara2022c). Given these premises, the present study aimed to: (1) provide updated regression-based normative data for the SCWT-SF in an Italian population sample, taking into account not only the EIT and EIE but also individual time- and accuracy-related measures across the three test conditions; and (2) evaluate its construct validity, with specific reference to convergent validity.
Methods
Participants
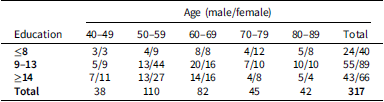
Three-hundred and fifty-three healthy volunteers were recruited between December 2021 and August 2025 from different Italian regions (Sicily, Lazio, Lombardy, and Trentino-Alto Adige) in accordance with a non-probability, snowball sampling approach (i.e., via Authors’ personal acquaintances). Each participant was a native Italian speaker with normal or corrected-to- vision and hearing abilities. The following exclusion criteria were considered: (1) uncorrected vision and/or hearing deficits; (2) documented neurological or psychiatric disorders; (3) severe and/or uncompensated metabolic or internal conditions; (4) ongoing treatment with psychotropic medications. In addition, participants were screened for sub-clinical, undetected cognitive dysfunctions, and subsequently excluded, if they obtained a demographically adjusted score below the established cutoff on any of the following tests: (1) Phonemic Verbal Fluency, Letter “F” (Conca et al., Reference Conca, Esposito, Rundo, Quaranta, Muscio, Manenti, Caruso, Lucca, Galbussera, Di Tella, Baglio, L’Abbate, Canu, Catania, Filippi, Mattavelli, Poletti, Silani, Lodi and Cappa2022); (2) Semantic Verbal Fluency, “Animals” (Conca et al., Reference Conca, Esposito, Rundo, Quaranta, Muscio, Manenti, Caruso, Lucca, Galbussera, Di Tella, Baglio, L’Abbate, Canu, Catania, Filippi, Mattavelli, Poletti, Silani, Lodi and Cappa2022); (3) Backward Digit Span (Pasotti et al., Reference Pasotti, De Luca, Aiello, Gramegna, Di Gangi, Foderaro, Gallucci, Biglia and Bottini2022). As a result, 36 participants were excluded and the final sample included 317 individuals, whose demographic stratification based on sex, age and education, following Boccardi et al.’s (Reference Boccardi, Monsch, Ferrari, Altomare, Berwig, Bosch, Clement, Dalla Barba, Dubois, Feliciano, Ferreira, Giorgi, Gjerstad, Grimmer, Jelic, Lleo, Lucero, Marsh, Martins and Winblad2022) guidelines, is reported in Table 1.
Sample stratification for age, education and sex

Table 1. Long description
A table titled ‘Age (male/female)’ with 5 columns and 5 rows, including a total row. The columns are labeled with age ranges: 40-49, 50-59, 60-69, 70-79, 80-89, and Total. The rows are labeled with education levels: ≤8, 9-13, ≥14, and Total. The table presents the number of male and female participants in each age and education category. Row 1: Education ≤8, 40-49: 3/3, 50-59: 4/9, 60-69: 8/8, 70-79: 4/12, 80-89: 5/8, Total: 24/40. Row 2: Education 9-13, 40-49: 5/9, 50-59: 13/44, 60-69: 20/16, 70-79: 7/10, 80-89: 10/10, Total: 55/89. Row 3: Education ≥14, 40-49: 7/11, 50-59: 13/27, 60-69: 14/16, 70-79: 4/8, 80-89: 5/4, Total: 43/66. Row 4: Total, 40-49: 38, 50-59: 110, 60-69: 82, 70-79: 45, 80-89: 42, Total: 317. The table shows the distribution of participants across different age groups, education levels, and sex.
Notes: Each cell shows the male/female ratio for each age-education class. The stratification followed Boccardi et al.’s (Reference Boccardi, Monsch, Ferrari, Altomare, Berwig, Bosch, Clement, Dalla Barba, Dubois, Feliciano, Ferreira, Giorgi, Gjerstad, Grimmer, Jelic, Lleo, Lucero, Marsh, Martins and Winblad2022) guidelines.
The study was approved by the Ethics Committee of IRCCS Istituto Auxologico Italiano (I.D.: 25C122). All participants provided written informed consent before taking part in the study. The present research was completed in accordance with the Helsinki Declaration.
Materials
Data collection was performed by trained examiners, including supervised trainees and graduate students specifically trained for the present study. After the abovementioned screening, participants completed the following battery of tests (in the following, fixed order of administration):
-
1. The Psychomotor Speed Test (PMST; Montanucci et al., Reference Montanucci, Chipi, Salvadori, Rinaldi, Eusebi and Parnetti2021) as a measure of processing speed: this test requires the examinee to write the entire alphabet as quickly as possible. If an error occurred, the examinee is instructed to write the numbers from 1 to 26 instead. The outcome measure addressed for the PMST was execution time. Similar tasks have shown satisfactory convergent validity with established measures of processing speed and attention, particularly the Trail-Making Test (Tolle et al., Reference Tolle, Spencer, Montgomery and Bieliauskas2019);
-
2. The Saccade and Antisaccade Test (SAST; Currie et al., Reference Currie, Ramsden, McArthur and Maruff1991) as a measure of inhibitory control: within this task, the examiner, positioned in front of the examinee, places both hands equidistant from the midline in the left and right visual fields and moves one finger at a time. In the saccadic condition, which served as a practice session, examinees were instructed to fixate on the examiner’s nose and shift their gaze to the finger that moved. By contrast, in the actual testing session, namely the anti-saccadic condition, participants were required to look in the direction opposite to the moving finger. After each trial within both conditions, participants were asked to return their gaze to the fixation point. The saccadic and anti-saccadic conditions included 5 and 20 trials, respectively. The outcome for the SAST consisted of the number of correctly performed anti-saccadic trials (range = 0–20). Similar antisaccade paradigms have shown good convergent validity with laboratory eye-tracking measures (Turner et al., Reference Turner, Renfroe, Duppstadt-Delambo and Hinson2017), adequate reliability (Klein & Fischer, Reference Klein and Fischer2005), and sensitivity to inhibitory and frontal-executive dysfunctions (Hellmuth et al., Reference Hellmuth, Mirsky, Heuer, Matlin, Jafari, Garbutt, Widmeyer, Berhel, Sinha, Miller, Kramer and Boxer2012), particularly in Alzheimer’s disease, mild cognitive impairment, Parkinson’s disease, and other neurodegenerative conditions (Currie et al., Reference Currie, Ramsden, McArthur and Maruff1991; Ferreira et al., Reference Ferreira, Pereira, Parreira, Sousa, Figueiredo, Cerqueira and Macedo2018; Riek et al., Reference Riek, Brien, Coe, Huang, Perkins, Yep and Munoz2023; Turner et al., Reference Turner, Renfroe, Duppstadt-Delambo and Hinson2017);
-
3. The Digit Ordering Test (DOT; Pasotti et al., Reference Pasotti, De Luca, Aiello, Gramegna, Di Gangi, Foderaro, Gallucci, Biglia and Bottini2022) as a measure of working memory: the DOT requires the examinee to recall, in ascending order, a list of digits that is read aloud by the examiner in a random order. It includes six sections, each enclosing two lists of the same length (from 3 to 8 digits); the test was interrupted whenever examinees consecutively failed two trials of the same length. The outcome herewith addressed for the DOT was the length of the longest list recalled (range = 0–8). The DOT primarily assesses phonological working memory and has shown satisfactory psychometric and clinical properties, including adequate reliability indices, associations with executive-function measures, and sensitivity to executive dysfunction in patients with Parkinson’s disease and other neurological conditions (Hoppe et al., Reference Hoppe, Müller, Werheid, Thöne and von Cramon2000);
-
4. The Trail-Making Test (TMT; Reitan & Wolfson, Reference Reitan and Wolfson1985): in this version of the test, examinees were first required to connect a series of encircle numbers (from 1 to 18) randomly positioned on an A4 sheet (Part A; TMT-A) and, subsequently, to alternate between encircled numbers (1–7) and letters (A–F) by following both the number and the alphabetical orders. Errors were corrected without stopping the timing. For both sections, the outcome was completion time. The TMT-A is widely considered a measure of sustained attention and processing speed, whereas the TMT-B more specifically captures executive processes such as set-shifting abilities and working memory (Arbuthnott et al., Reference Arbuthnott and Frank2000; Crowe, Reference Crowe1998; Sánchez-Cubillo et al., Reference Sánchez-Cubillo, Periáñez, Adrover-Roig, Rodríguez-Sánchez, Ríos-Lago, Tirapu and Barceló2009). Previous studies consistently support the strong clinimetric properties and high feasibility of the TMT for detecting attentional-executive and broader cognitive impairments across several clinical populations, including neurodegenerative disorders (Ashendorf et al., Reference Ashendorf, Jefferson, O’Connor, Chaisson, Green and Stern2008; De Frias et al., Reference De Frias, Dixon, Fisher and Camicioli2007);
-
5. The Stroop Color-Word Test – Short Form (SCWT-SF; Caffarra et al., Reference Caffarra, Vezzadini, Dieci, Zonato and Venneri2002): this version of the SCWT includes three conditions, each with 30 stimuli arranged in columns. The three conditions were administered sequentially: (1) Word Reading (W), requiring examinees to read color words printed in black ink; (2) Color Naming (C), requiring examinees to name the ink of colored patches; (3) color-word interference (CW), requiring examinees to name the incongruent ink color of printed color words. Participants were instructed to perform each task as quickly and accurately as possible. The examiner recorded the total time required to complete each condition and the number of errors made. Auto-corrections were recorded as errors. Besides Caffarra et al.’s (2002) original EIT and EIE measures, individual time- and accuracy-related scores were recorded for each section in order to obtain measures of processing speed and inhibitory control.
The PMST, SAST, DOT, and TMT were administered to test the construct validity of the SCWT-SF (see section Construct validity testing).
The record form and stimuli of the current SCWT-SF are available upon request to the Corresponding Author.
Statistical analyses
Sample size estimation
The sample size was established in accordance with previous normative studies (Aiello et al., Reference Aiello, Esposito, Gramegna, Gazzaniga, Zago, Difonzo, Appollonio and Bolognini2022a; Brugnolo et al., Reference Brugnolo, De Carli, Accardo, Amore, Bosia, Bruzzaniti, Serveta, Girtler and De Leo2015; Tremolizzo et al., Reference Tremolizzo, Lizio, Santangelo, Diamanti, Lunetta, Gerardi, Messina, La Foresta, Riva, Falzone, Filippi, Woolley, Sansone, Siciliano and Ferrarese2020) via the pwr package in R version 3.6.3 (Champely, Reference Champely2020). The a priori power analysis revealed that at least 287 participants were required to achieve, within a multiple linear regression analysis addressing three predictors (i.e., sex, age, and education), a power of 90% with a type-I error level of 5% and a small-to-medium effect size (f 2 = .05) (Rothstein et al., Reference Rothstein, Borenstein, Cohen and Pollack1990).
Norm derivation
Normative data were derived for each SCWT-SF measure by means of the Equivalent Score (ES) method (Aiello & Depaoli, Reference Aiello and Depaoli2022; Capitani & Laiacona, Reference Capitani and Laiacona2017). This is a regression-based norming technique relying on four fundamental steps. First, the effects of demographic confounders are initially tested separately in order to identify those significantly predicting raw cognitive scores. More specifically, the effect of sex is first assessed via an independent-sample t-test, whereas age and education are separately tested through a series of simple linear regression models applying different transformations (e.g., logarithmic, cubic, reciprocal). For each predictor, the transformation yielding the highest explained variance (R 2) is retained. Second, the best-fitting transformations for age and education, together with sex whenever significant, were included in a stepwise multiple regression procedure to derive the final adjustment equation. Non-significant predictors were progressively removed until only significant demographic variables remained, thus allowing adjustment equation to level out inter-individual discrepancies in raw test scores that depend on these confounders Third, outer and inner tolerance limits (oTL; iTL) were identified from ranked adjusted scores in order to provide a non-parametric, interval estimate of the cut-off. The oTL is the highest ascending-order-ranked adjusted scores yielding a safety level p ≥ 0.95 that no more than 5% of the population performs below it. In contrast, the iTL is the lowest observation yielding a safety level p ≥ 0.95, which means that at most 95% of the population performs above it. Adjusted scores lower than/equal to the oTL are classified as impaired (i.e., ES = 0), while those higher than the oTL and equal to/lower than the iTL are judged as falling under a “grey area” where no inference on their “normality” or “defectiveness” can be drawn. Finally, adjusted scores higher than the oTL and lower than/equal to the median are further classified into the following ability levels according to a z-score-based subdivision: ES = 1 → “borderline”; ES = 2 → “low-end normal”; ES = 3 → “normal”; ES = 4 (i.e., ASs equal to/higher than the median) → “high-end normal”.
Construct validity testing
Cognitive measures were checked for Normality both by assessing skewness values (judged as indexing a violation of this assumption if >|1|) (Kim, Reference Kim2013) and by inspecting histograms and quantile-quantile plots for visual abnormalities. Given that most cognitive scores did not follow a normal distribution, Spearman’s coefficients were computed to test construct validity. More specifically, two sets of correlations were run. The first one was aimed at testing the construct validity of time and error scores from the SCWT-SF-W and the SCWT-SF-C; given that these two conditions are thought to reflect processing speed, related measures were correlated against the TMT-A and the PMST. The second set addressed time and error scores from the SCWT-SF-CW and interference indices (i.e., the TIE and the EIE). The construct validity of these measures was tested against the SAS, the TMT-B, and the DOT, to capture their association with inhibitory control, set-shifting, and working memory (i.e., the three key facets of EF in accordance with Miyake’s model, 2000). Within each of these correlational sets, Bonferroni’s correction was applied in order to prevent from incurring in an inflation of type-I error rates. The magnitude of correlation coefficients was interpreted according to Cohen’s (Reference Cohen1992) benchmarks – i.e., r s ≤ 0.30 → small; 0.30 < r s ≤ 0.50 → medium; r s ≥ 0.50 → large.
Analyses were performed via R 4.4 (https://cran.r-project.org) (R Core Team, 2024) and jamovi 2.6 (https://www.jamovi.org) (The Jamovi Project, 2024).
Results
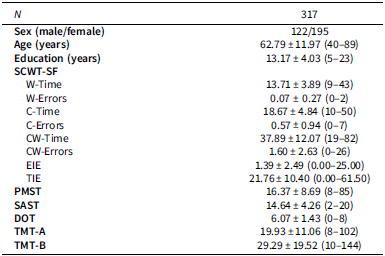
Participants’ demographic and cognitive data are summarized in Table 2.
Demographic and cognitive data

Table 2. Long description
The table presents demographic and cognitive data for 317 participants. It includes columns for sex, age, education, and various cognitive test results. The table has 11 rows and 12 columns. Row 1: N, 317. Row 2: Sex (male/female), 122/195. Row 3: Age (years), 62.79 ± 11.97 (40–89). Row 4: Education (years), 13.17 ± 4.03 (5–23). Row 5: SCWT-SF W-Time, 13.71 ± 3.89 (9–43). Row 6: SCWT-SF W-Errors, 0.07 ± 0.27 (0–2). Row 7: SCWT-SF C-Time, 18.67 ± 4.84 (10–50). Row 8: SCWT-SF C-Errors, 0.57 ± 0.94 (0–7). Row 9: SCWT-SF CW-Time, 37.89 ± 12.07 (19–82). Row 10: SCWT-SF CW-Errors, 1.60 ± 2.63 (0–26). Row 11: SCWT-SF EIE, 1.39 ± 2.49 (0.00–25.00). Row 12: SCWT-SF TIE, 21.76 ± 10.40 (0.00–61.50). Row 13: PMST, 16.37 ± 8.69 (8–85). Row 14: SAST, 14.64 ± 4.26 (2–20). Row 15: DOT, 6.07 ± 1.43 (0–8). Row 16: TMT-A, 19.93 ± 11.06 (8–102). Row 17: TMT-B, 29.29 ± 19.52 (10–144).
Notes: SCWT-SF = Stroop Color-Word Test – Short Form; W = Word Reading; C = Color Naming; CW = Color–Word Interference; EIE = Error Interference Effect; TIE = Time Interference Effect; PMST = Psychomotor Speed Test; SAST = Saccade and Antisaccade Test; DOT = Digit Ordering Test; TMT-A = Trail-Making Test – Part A; TMT-B=Trail-Making Test – Part B. Continuous measures are shown as M ± SD (range), while categorical ones as frequencies.
Norm derivation
Table 3 reports the adjustment equations built based on the results from the stepwise linear regression procedure, which, overall, showed expected predictive relationships (i.e., older age and lower education negatively affecting participants’ performances). More specifically, these analyses revealed that age and education significantly predicted completion times for both W (natural logarithm of 100 minus age: b = −1.63, p = 0.004; reciprocal education: b = 26.36, p < 0.001) and CW (cubic age: b = 0.00004, p < 0.001; reciprocal education: b = 112.67, p < 0.001) conditions of the SCWT-SF. Completion times for the SCWT-SF-C task were additionally influenced by sex (base-10 logarithm of 100 minus age: b = −11.91, p < 0.001; reciprocal education: b = 36.89, p < 0.001; sex: b = −1.28, p = 0.006), with females outperforming males. Regarding error scores, age significantly predicted errors in both C (cubic age: b = 0.000002, p < 0.001) and CW (natural logarithm of 100 minus age: b = −2.29, p < 0.001) conditions. In contrast, education additionally predicted only those on the CW condition (base-10 logarithm of education: b = −4.89, p < 0.001). No demographic variables were found to predict errors in the W condition. Finally, considering the interference indices, age and education significantly predicted both the EIE (natural logarithm of 100 minus age: b = −1.98, p < 0.001; base-10 logarithm of education: b = −4.41, p < 0.001) and TIE (cubic age: b = 0.00003, p < 0.001; base-10 logarithm of education: b = −19.03, p < 0.001).
Adjustment equations for raw SCWT-SF scores

Table 3. Long description
A table with adjustment equations for raw SCWT-SF scores. The table has 8 rows and 2 columns. The first column lists different conditions and the second column provides the corresponding adjustment equations. Row 1: W-Time, AS = RS + 1.627668*(ln(100-age)-3.552152)-26.35962*((1/education)-0.085712). Row 2: W-Errors, NA. Row 3: C-Time, AS = RS + 11.90677*(log10(100-age)-1.54268)-36.88766*((1/education)-0.085712) + 1.283697*(sex-0.5). Row 4: C-Errors, AS = RS-0.000002*((age^3)-275,124.618297). Row 5: CW-Time, AS = RS-0.000038*((age^3)-275,124.6)-112.6675*((1/education)-0.085712). Row 6: CW-Errors, AS = RS + 2.28968*(ln(100-age)-3.552152) + 4.894067*(log10(education)-1.096). Row 7: EIE, AS = RS + 1.979336*(ln(100-age)-3.552152) + 4.40516*(log10(education)-1.096). Row 8: TIE, AS = RS-0.000029*((age^3)-275,124.6) + 19.0319*(log10(education)-1.096).
Notes: AS = adjusted score; RS = raw score; SCWT-SF = Stroop Color-Word Test – Short Form; W = Word Reading; C = Color Naming; CW = Color–Word Interference; EIE = Error Interference Effect; TIE = Time Interference Effect; NA = not applicable;
* Within this equation, sex has to be coded as 0 = male and 1 = female.
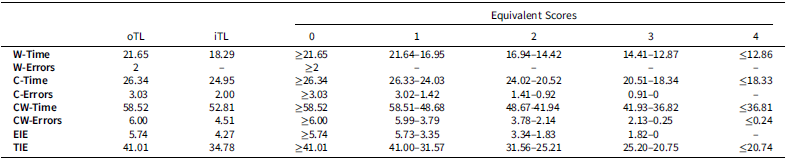
Tolerance limits and ES thresholds for adjusted scores are reported in Table 4. A spreadsheet for the automated computation of adjusted scores and ESs is provided within Supplementary Material 1. For the SCWT-SF-W errors, only the oTL could be derived given the extremely low variability of participants’ scores on this measure.
Tolerance limits and equivalent scores for adjusted SCWT-SF measures

Table 4. Long description
A table comparing tolerance limits and equivalent scores for adjusted SCWT-SF measures. The table has 8 rows and 10 columns. The columns are labeled as oTL, iTL, 0, 1, 2, 3, and 4. The rows are labeled as W-Time, W-Errors, C-Time, C-Errors, CW-Time, CW-Errors, EIE, and TIE. Row 1: oTL, 21.65; iTL, 18.29; 0, ≥21.65; 1, 21.64-16.95; 2, 16.94-14.42; 3, 14.41-12.87; 4, ≤12.86. Row 2: W-Errors, no values provided. Row 3: oTL, 26.34; iTL, 24.95; 0, ≥26.34; 1, 26.33-24.03; 2, 24.02-20.52; 3, 20.51-18.34; 4, ≤18.33. Row 4: oTL, 3.03; iTL, 2.00; 0, ≥3.03; 1, 3.02-1.42; 2, 1.41-0.92; 3, 0.91-0; 4, no values provided. Row 5: oTL, 58.52; iTL, 52.81; 0, ≥58.52; 1, 58.51-48.68; 2, 48.67-41.94; 3, 41.93-36.82; 4, ≤36.81. Row 6: oTL, 6.00; iTL, 4.51; 0, ≥6.00; 1, 5.99-3.79; 2, 3.78-2.14; 3, 2.13-0.25; 4, ≤0.24. Row 7: oTL, 5.74; iTL, 4.27; 0, ≥5.74; 1, 5.73-3.35; 2, 3.34-1.83; 3, 1.82-0; 4, no values provided. Row 8: oTL, 41.01; iTL, 34.78; 0, ≥41.01; 1, 41.00-31.57; 2, 31.56-25.21; 3, 25.20-20.75; 4, ≤20.74.
Notes: oTL = outer tolerance limit; iTL = inner tolerance limit; SCWT-SF = Stroop Color-Word Test – Short Form; W = Word Reading; C = Color Naming; CW = Color–Word Interference; EIE = Error Interference Effect; TIE = Time Interference Effect.
Construct validity testing
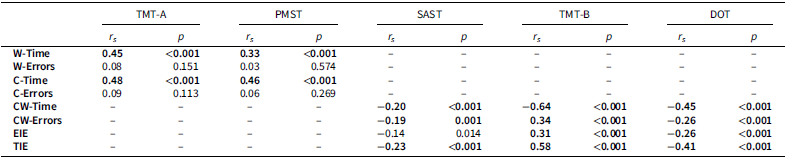
The results of construct validity testing are reported in Table 5. As for the first correlational set addressing processing speed measures, time scores in both C and W conditions showed moderate associations with both TMT-A and PMST scores. By contrast, error scores for these two SCWT-SF conditions did not show significant correlations with either the TMT-A or the PMST. Regarding the second set of correlations, which considered measures of the CW condition and interference indices (i.e., TIE and EIE), medium-to-large associations were detected between both time and error measures in the CW condition and both the TMT-B and the DOT. At variance, the association between CW measures and the SAST, although significant, was of small magnitude. The same pattern emerged for interference indices, with stronger associations observed for measures of set-shifting and working memory (TMT-B and DOT), and weaker, although still significant, associations with the SAST.
Results of construct validity analyses

Table 5. Long description
A table with five columns and six rows, comparing construct validity analyses across different tests and conditions. The columns are labeled TMT-A, PMST, SAST, TMT-B, and DOT. Each column has two sub-columns labeled r_s and p. The rows are labeled W-Time, W-Errors, C-Time, C-Errors, CW-Time, CW-Errors, EIE, and TIE. Row 1: W-Time, TMT-A r_s 0.45, p <0.001, PMST r_s 0.33, p <0.001. Row 2: W-Errors, TMT-A r_s 0.08, p 0.151, PMST r_s 0.03, p 0.574. Row 3: C-Time, TMT-A r_s 0.48, p <0.001, PMST r_s 0.46, p <0.001. Row 4: C-Errors, TMT-A r_s 0.09, p 0.113, PMST r_s 0.06, p 0.269. Row 5: CW-Time, SAST r_s -0.20, p <0.001, TMT-B r_s -0.64, p <0.001, DOT r_s -0.45, p <0.001. Row 6: CW-Errors, SAST r_s -0.19, p 0.001, TMT-B r_s 0.34, p <0.001, DOT r_s -0.26, p <0.001. Row 7: EIE, SAST r_s -0.14, p 0.014, TMT-B r_s 0.31, p <0.001, DOT r_s -0.26, p <0.001. Row 8: TIE, SAST r_s -0.23, p <0.001, TMT-B r_s 0.58, p <0.001, DOT r_s -0.41, p <0.001.
Notes: SCWT-SF = Stroop Color-Word Test – Short Form; W = Word Reading; C = Color Naming; CW = Color–Word Interference; EIE = Error Interference Effect; TIE = Time Interference Effect; PMST = Psychomotor Speed Test; SAST = Saccade and Antisaccade Test; DOT = Digit Ordering Test; TMT-A = Trail-Making Test – Part A; TMT-B = Trail-Making Test – Part B. Significant coefficients and p-values at the Bonferroni-adjusted threshold (W and C measures: αadjusted = 0.05/8 = 0.006; CW measures and interference indices: αadjusted = 0.05/12 = 0.004) are shown in bold.
Discussion
The present study provides updated normative data for the Italian population and empirical evidence supporting the construct validity of the short form of the SCWT developed by Caffarra et al. (Reference Caffarra, Vezzadini, Dieci, Zonato and Venneri2002), a widely adopted second-level instrument for assessing processing speed and executive functions in Italy. This work adds a significant contribution to the Italian neuropsychological community for several reasons, as well as providing new insights to the international community. First, we provide updated normative data, which are expected to better capture the demographic shifts occurred in Italy (Gasparini et al., Reference Gasparini, Scandola, Salati, Margiotta, Barbetti, Diana, Righetti, Bertagnoli, Gambina and Moro2025), than the existing norms established over two decades ago (Caffarra et al., Reference Caffarra, Vezzadini, Dieci, Zonato and Venneri2002). Second, updated normative values were computed not only for interference indices, the focus of the original study by Caffarra et al. (Reference Caffarra, Vezzadini, Dieci, Zonato and Venneri2002), but also for condition-specific time- and error-related measures across the three test conditions (C, W, and CW). Such features allow users to exploit the full potential of the SCWT-SF, such as a measure of EF, with this set of processes being indexed by CW measures and interference indices (i.e., the TIE and EIE), and as a tool to assess processing speed, which is captured by accuracy- and time-related measures on the C and W conditions. In practical terms, the availability of condition-specific norms for the SCWT-SF will help users discriminate between processing-speed deficits, selective interference difficulties, and more generalized executive dysfunction. In addition, the present normative sample exceeds in size that of Caffarra et al. (Reference Caffarra, Vezzadini, Dieci, Zonato and Venneri2002) − i.e., N = 317 vs. N = 248 − possibly granting a higher degree of generalizability to the norms herewith derived, especially considering the use of an updated sample that better reflect the characteristics of the current population. Recently, Luzzi et al. (Reference Luzzi, Cherubini, Rosettani, Baldinelli, Fiori, Silvestrini and Scandola2026) also provided updated Italian norms for an alternative short SCWT version, which includes a larger sample (i.e., 452 vs 317 participants) and offers greater generalizability across younger adults (≥20 years old), without providing effective differential diagnostic performance, showing good discrimination between mild and moderate Alzheimer’s disease only in terms of execution time. Compared to Luzzi and colleagues (2026), the shorter version adopted here provides several practical advantages, including reduced administration time (fewer stimuli and three condition rather than four), simpler scoring procedures, and greater acceptability among Italian practitioners. Moreover, the present study expands the clinical interpretability of the SCWT-SF by providing normative data not only for interference indices, but also for condition-specific completion times and error scores, together with evidence supporting its construct validity.
As far as the demographic determinants of SCWT-SF scores, our results substantially align with those by Caffarra et al. (Reference Caffarra, Vezzadini, Dieci, Zonato and Venneri2002) and with the international literature on the SCWT (Scarpina & Tagini, Reference Scarpina and Tagini2017) by showing that both older age and lower education have a negative effect on both accuracy and completion time in all three SCWT-SF conditions. Exceptions to this included accuracy-related scores in the W condition, which were neither predicted by age nor by education, and in the C ones, the last being predicted by age only. These findings likely reflect the extremely low variability in examinees’ error counts in word-reading and color-naming tasks, which are, in fact, usually relatively easy for healthy individuals to perform accurately. A further element worth noting is that female sex was predictive of lower completion times on the SCWT-SF-C, in line with previous reports indicating that females outperform males on the SCWT (Baroun & Alansari, Reference Baroun and Alansari2006; Shen, Reference Shen2005).
From a normative perspective, our findings indicate that the cut-off values for the TIE and EIE are slightly higher, and consequently less conservative, than those established by Caffarra et al. (Reference Caffarra, Vezzadini, Dieci, Zonato and Venneri2002), suggesting a modest shift in impairment thresholds (TIE: 4.23 vs. 5.73; EIE: 36.91 vs. 41.00). The in-depth explanation of these findings, which might be framed within the “negative Flynn Effect” (Dutton et al., Reference Dutton, van der Linden and Lynn2016), is beyond of the scope of this work, but it is interesting to note that the discrepancy between the previous normality thresholds and those derived in this work highlights the importance of providing up-to-date norms that reflect the current characteristics of a given population. However, it’s important to note that such cut-off comparisons should be interpreted cautiously, as they were derived from two different normative samples collected across different timespans.
Moreover, this work provides evidence supporting the construct validity of the Italian SCWT-SF by considering both individual completion times and error counts, as well as interference indices. In fact, time-related measures in both the W and C conditions proved to be associated with measures of processing speed abilities (i.e., the PMST and the TMT-A), consistent with the idea that performance in these SCWT-SF conditions predominantly reflect processing speed and attentional efficiency, as they involve rapid visual recognition and verbal output without requiring the suppression of competing responses. Moreover, the lack of association between accuracy-related measures of these same two conditions might be accounted for by the abovementioned, low variability in healthy individuals’ error counts on word-reading and color-naming tasks, rather than by the absence of validity of these outcomes. Finally, accuracy- and time-related scores on CW condition, as well as the interference indices TIE and EIE, were found to be associated with a range of tests assessing the EF identified by Miyake et al. (Reference Miyake, Friedman, Emerson, Witzki, Howerter and Wager2000), namely those assessing inhibitory control (i.e., SAST), working memory (DOT), and set-shifting (TMT-B). These findings support the notion of both the CW condition of the SCWT-SF and its interference indices being valid EF measures. Interestingly, associations between SCWT-SF interference measures and the SAST were smaller in magnitude compared to those observed with the TMT-B and the DOT. This finding may reflect partial differences between the inhibitory processes captured by these tasks, with the SCWT-SF relying more strongly on cognitive-verbal interference control processes (Parris et al., Reference Parris, Hasshim, Wadsley, Augustinova and Ferrand2022) and the SAST more specifically assessing reflexive oculomotor inhibition (Coe & Munoz, Reference Coe and Munoz2017). Such a pattern supports the view of inhibition as a multidimensional rather than unitary executive function construct (López-Ramón et al., Reference López-Ramón, Richard’s, Musso, Aydmune and Bario2026).
This work, however, is not free of limitations. First, some age-education classes (i.e., young individuals with low levels of educational attainment and older participants with higher levels of education) were less represented than others within the normative sample, and no participant older than 89 years was included. This may, to some extent, limit the generalizability of our normative data to examinees with such demographic characteristics. Second, exclusion criteria based on multiple cognitive measures, rather than on a global cognitive screening test, represented a more conservative approach to exclude participants with possible subtle cognitive impairment. However, this strategy may also have introduced a selection bias, thereby limiting the generalizability of the findings. Third, while we did assess the test convergent validity of the SCWT-SF, this report does not provide information on other key forms of validity, including divergent and criterion validity. A similar argument applies to reliability. Accordingly, future research should further investigate these aspects in order to better define the diagnostic accuracy, clinimetric soundness, and clinical utility of the SCWT-SF across different clinical populations. Finally, although the present study adopted the classical Equivalent Scores framework in line with previous Italian neuropsychological normative studies, future work may consider both integrating percentile ranks alongside ESs in order to facilitate comparability with international normative systems (Guilmette et al., Reference Guilmette, Sweet, Hebben, Koltai, Mahone, Spiegler, Stucky and Westerveld2020) and exploring more recent regression-model approaches for derivation of normative data (e.g., Arcara, Reference Arcara2024).
From a clinical standpoint, the present findings further strengthen the utility of the SCWT-SF in routine neuropsychological practice. Specifically, the availability of updated demographic adjustments and condition-specific normative data for both completion times and error rates may facilitate a more accurate characterization of cognitive profiles. Furthermore, the reduced administration time, ease of scoring, and low task complexity enhance the feasibility and practical applicability of the SCWT-SF in everyday clinical settings.
In conclusion, this work provides updated, regression-based norms for the Italian SCWT-SF, encompassing individual scores across its three tasks and the original interference indices, and offers evidence supporting its convergent validity with measures of processing speed and executive functions.
Supplementary material
The supplementary material for this article can be found at https://doi.org/10.1017/S1355617726102148
Data availability statement
Datasets associated with the present study cannot be made publicly available as including sensitive information but can be made available upon reasonable request of interested researchers to the Corresponding Author, who will forward a data transfer agreement request to the relevant Ethical Committees.
Acknowledgments
We are grateful to the participants.
Funding statement
This study did not receive any specific funding.
Competing interests
The authors report there are no competing interests to declare.
Ethical standards
This study was conducted in accordance with the Declaration of Helsinki and was approved by the Ethics Committee of IRCCS Istituto Auxologico Italiano (I.D.: 25C122).
Informed consent
Participants provided written informed consent.