

For the past six US presidential elections we have produced forecasts of the national vote during the summer of each election year. Our forecast in 1996 used growth in the Conference Board’s Index of Leading Economic Indicators (LEI) together with presidential approval, which allowed us to tap economic and noneconomic aspects of referendum judgments (Wlezien and Erikson Reference Wlezien and Erikson1996). The LEI provided early indication—by April of the election year—of economic growth and approval trends leading up to Election Day. In 2004, we substituted vote intention polls for approval (Wlezien and Erikson Reference Wlezien and Erikson2004) and have used this model in every election since and to good effect, keeping in mind that we forecast the popular vote, not the Electoral College.
The use of LEI is the distinguishing feature of the model. Our measure taps growth over the presidential term, giving greater weight to quarters closer to Election Day. By Quarter 13—the first quarter of the election year—the growth in LEI both summarizes economic trends up to that point and forecasts the expected economy for the remainder of the election year. Trial-heat polls increasingly incorporate these economic conditions as the election year unfolds, though they also reflect noneconomic forces (Erikson and Wlezien Reference Erikson and Wlezien2012).
Let’s see what our model augurs for 2020.
LEI AND THE POLLS AND THE VOTE
Our objective is to forecast the incumbent party share of the two-party vote using cumulative LEI growth through Quarter 13 of the election cycle and the incumbent party share of polls pitting the two major-party candidates. The first variable represents the weighted average of quarterly growth in LEI, where each quarterly reading is weighted 0.80 times the one for the following quarter. This approach maximizes the correlation with the presidential vote, which peaks in Quarter 13, which is the first quarter—through the end of March—of the election year. (For more details relating to leading economic indicators and the construction of our measure, see the online appendix.) As discussed, it both summarizes growth through the first 13 quarters of the election cycle and offers information about where the economy is heading thereafter. The second variable is the incumbent party candidate’s share of the two-party vote in trial-heat polls, which can be measured at any time during the election year. Per our previous practice, we only use live interviewer polls. Polls are included to pick up other, mostly noneconomic factors relating to judgments of the incumbent performance and the electoral choice (see the online appendix).
Table 1 presents the results of equations predicting the incumbent party vote from our two variables for the 17 elections between 1952 through 2016. Four models are presented, one for each quarter of the election year. Cumulative LEI growth is fixed at its value for Quarter 13 in all models, and so all that varies across quarters are the polls. All data and code necessary to reproduce these regression results and those in the following tables can be found in Erikson and Wlezien (Reference Erikson and Wlezien2020). Table 1 shows that cumulative LEI growth and trial-heat polls are statistically significant predictors of the vote in all quarters. Predictably, the influence of the polls grows while that of LEI growth recedes during the election year. When polls are measured in Quarters 13 or 14, cumulative LEI growth through March tells more about the vote in November than do contemporary trial-heat polls. By Quarter 15, the polls overtake cumulative LEI growth; still, the measure of cumulative LEI growth from Quarter 13 adds some predictive power. The same is not true of certain noneconomic variables, which more quickly become absorbed into voter preferences (see the online appendix).
Predicting the Presidential Vote during the Election Year, 1952–2016

Note: Numbers in parentheses are standard errors. The dependent variable is the incumbent presidential party’s percent of the two-party vote. Cumulative LEI growth = summed weighted growth in leading economic indicators through Quarter 13 of the election cycle, with each quarter weighted 0.80 times the following quarter. Trial-heat poll results are for the quarter indicated and are missing in the first quarter of 1952, leaving 16 cases for analysis in Quarter 13.
* p < .05; ** p < .01.
PREDICTING 2020 USING LEADING INDICATORS PLUS EARLY POLLS
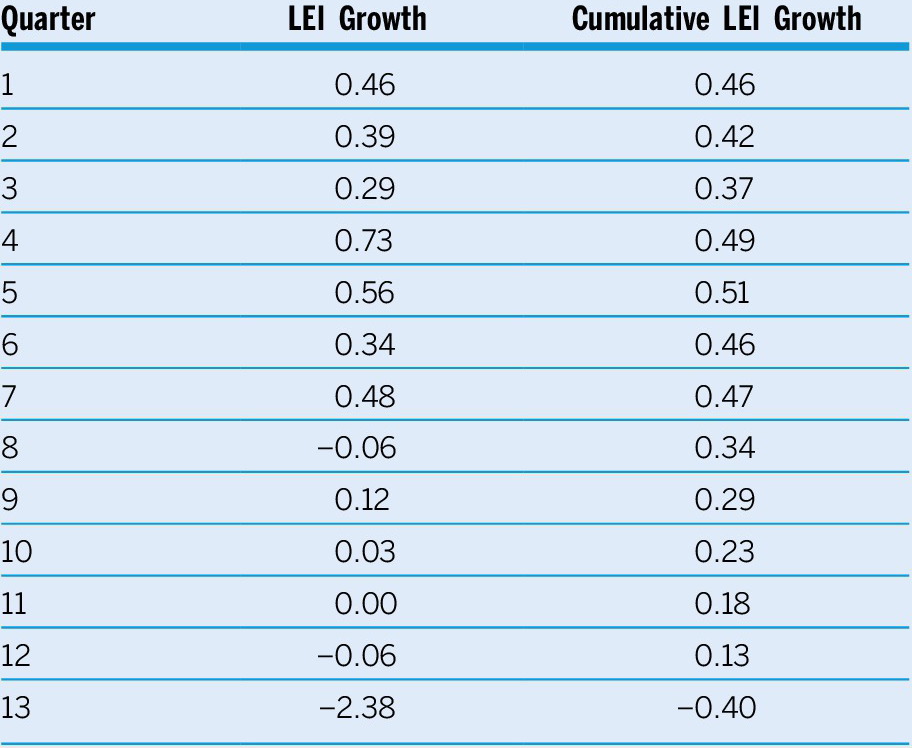
Entering 2020, cumulative LEI growth through Quarter 12 was 0.13, slightly below the 0.21 average, ranking only 13th best of the 18 election cycles since 1952. With Trump also trailing in trial-heat polls versus most Democratic candidates, the stage was set for a rocky road to reelection. Then COVID-19 hit late in Quarter 13, and the LEI index spiraled downward, with the largest plunge ever recorded by month (March) and quarter (see table 2). With the Quarter 13 numbers factored in, the cumulative growth in LEI was −0.40, the third worst since 1952—and only slightly better than 1980 (−0.44) and 2008 (−0.49).
Growth in Leading Economic Indicators (LEI), by Quarter, 2017–2020

Note: LEI growth = the quarterly percentage change in leading economic indicators during the election cycle; Cumulative LEI growth = summed weighted change in leading economic indicators. Note that the cumulative measure is divided by the sum of the quarterly weights used to produce each estimate, which makes them directly comparable across quarters.
As mentioned, the polls were not promising for Trump even before the pandemic struck. Using data for live interviewer polls from RealClearPolitics.com, in Quarter 13 Trump averaged 47.1% versus Biden. When plugging this number into the first equation of table 1 together with cumulative LEI growth, the early prediction for November based on Quarter 13 data is a 43.2% share for Trump. We can see the impact on the forecast by substituting the measure of cumulative LEI growth truncated to end in Quarter 12, at the end of 2019. Using that pre-COVID-19 number, the model would predict a substantially larger share (49.0%) for Trump, but still less than 50%. The shock to LEI thus reduced Trump’s expected vote based on our model by just about six percentage points.
For Quarter 14, Trump’s poll share fell to 45.8% as the impact of COVID-19 was being realized. The prediction for November 2020 using cumulative LEI through Quarter 13 and Quarter 14 polls is 44.3% for Trump. Given the standard forecast error, our Quarter 14 estimate implies a 9% chance of a Trump popular vote victory. This is a preliminary forecast, because it was made before the party conventions, which are known to be consequential for both the polls and the vote (see Erikson and Wlezien Reference Erikson and Wlezien2012).
FORECASTING BEFORE AND AFTER THE CONVENTIONS
Table 3 shows equations using pre- and post-convention polls.Footnote 1 As indicated by the R-squareds, predictability increases using post-convention polls: before the conventions, cumulative LEI growth is the strongest predictor; afterward, polls dominate. The conventions help clarify for the voters the fundamentals of the election.
Predicting the Incumbent-Party Presidential Vote before and after the Conventions, 1952–2016

Note: N = 17. Numbers in parentheses are standard errors. Cumulative LEI growth = summed weighted growth in LEI through Quarter 13 of the election cycle, with each quarter weighted 0.80 times the following quarter. Trial-heat polls are for the week before the first party convention and for two weeks after the second convention.
** p < .01.
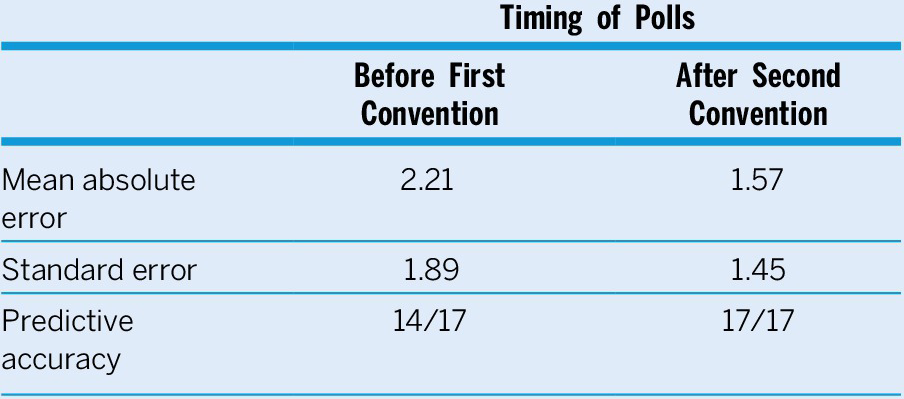
Table 4 summarizes out-of-sample forecasts from the equations. Here we can see that the model performs well before the conventions, predicting the correct popular vote winner in 14 of 17 cases, which is slightly better than what we obtain using raw polls (12 of 17). The post-convention model works better still, correctly predicting the popular vote winner in all 17 elections since 1952.
Summary Statistics for Out-of-Sample Forecasts Using Pre- and Post-Convention Polls, 1952–2016

Note: For each of the pre- and post-convention periods, the out-of-sample forecast for each election year represents the vote predicted from a model that excludes the particular year. Predictive accuracy is the number of elections in which the equation correctly “forecasts” the popular vote winner.
What about 2020? The pre-convention trial-heat reading from RealClearPolitics.com, again using live interviewer polls, is 45.4% of the two-party vote for Trump. Plugging the number into our pre-convention equation in table 3 predicts 45.0% for Trump, with a probability of winning the popular vote of .13. This is slightly larger than what we forecasted in Quarter 14.
Now, ideally we would have a variety of live interviewer polls between September 8–14, fully two weeks after the Republican convention ended, but this is not the case: there is only one poll, from Fox. Given this, we use the mean of the RealClearPolitics and 538 averages of polls as of September 14, which is 46.2% for Trump. Inserting this number into our post-convention equation in table 4 predicts a vote share of 45% for Trump (55% for Biden), with a probability of victory of .04. The vote estimate is exactly the same as the one before the conventions, implying that electoral expectations have stabilized. That said, our confidence in a Biden victory has increased, because later polls are more informative about the vote based on electoral history.
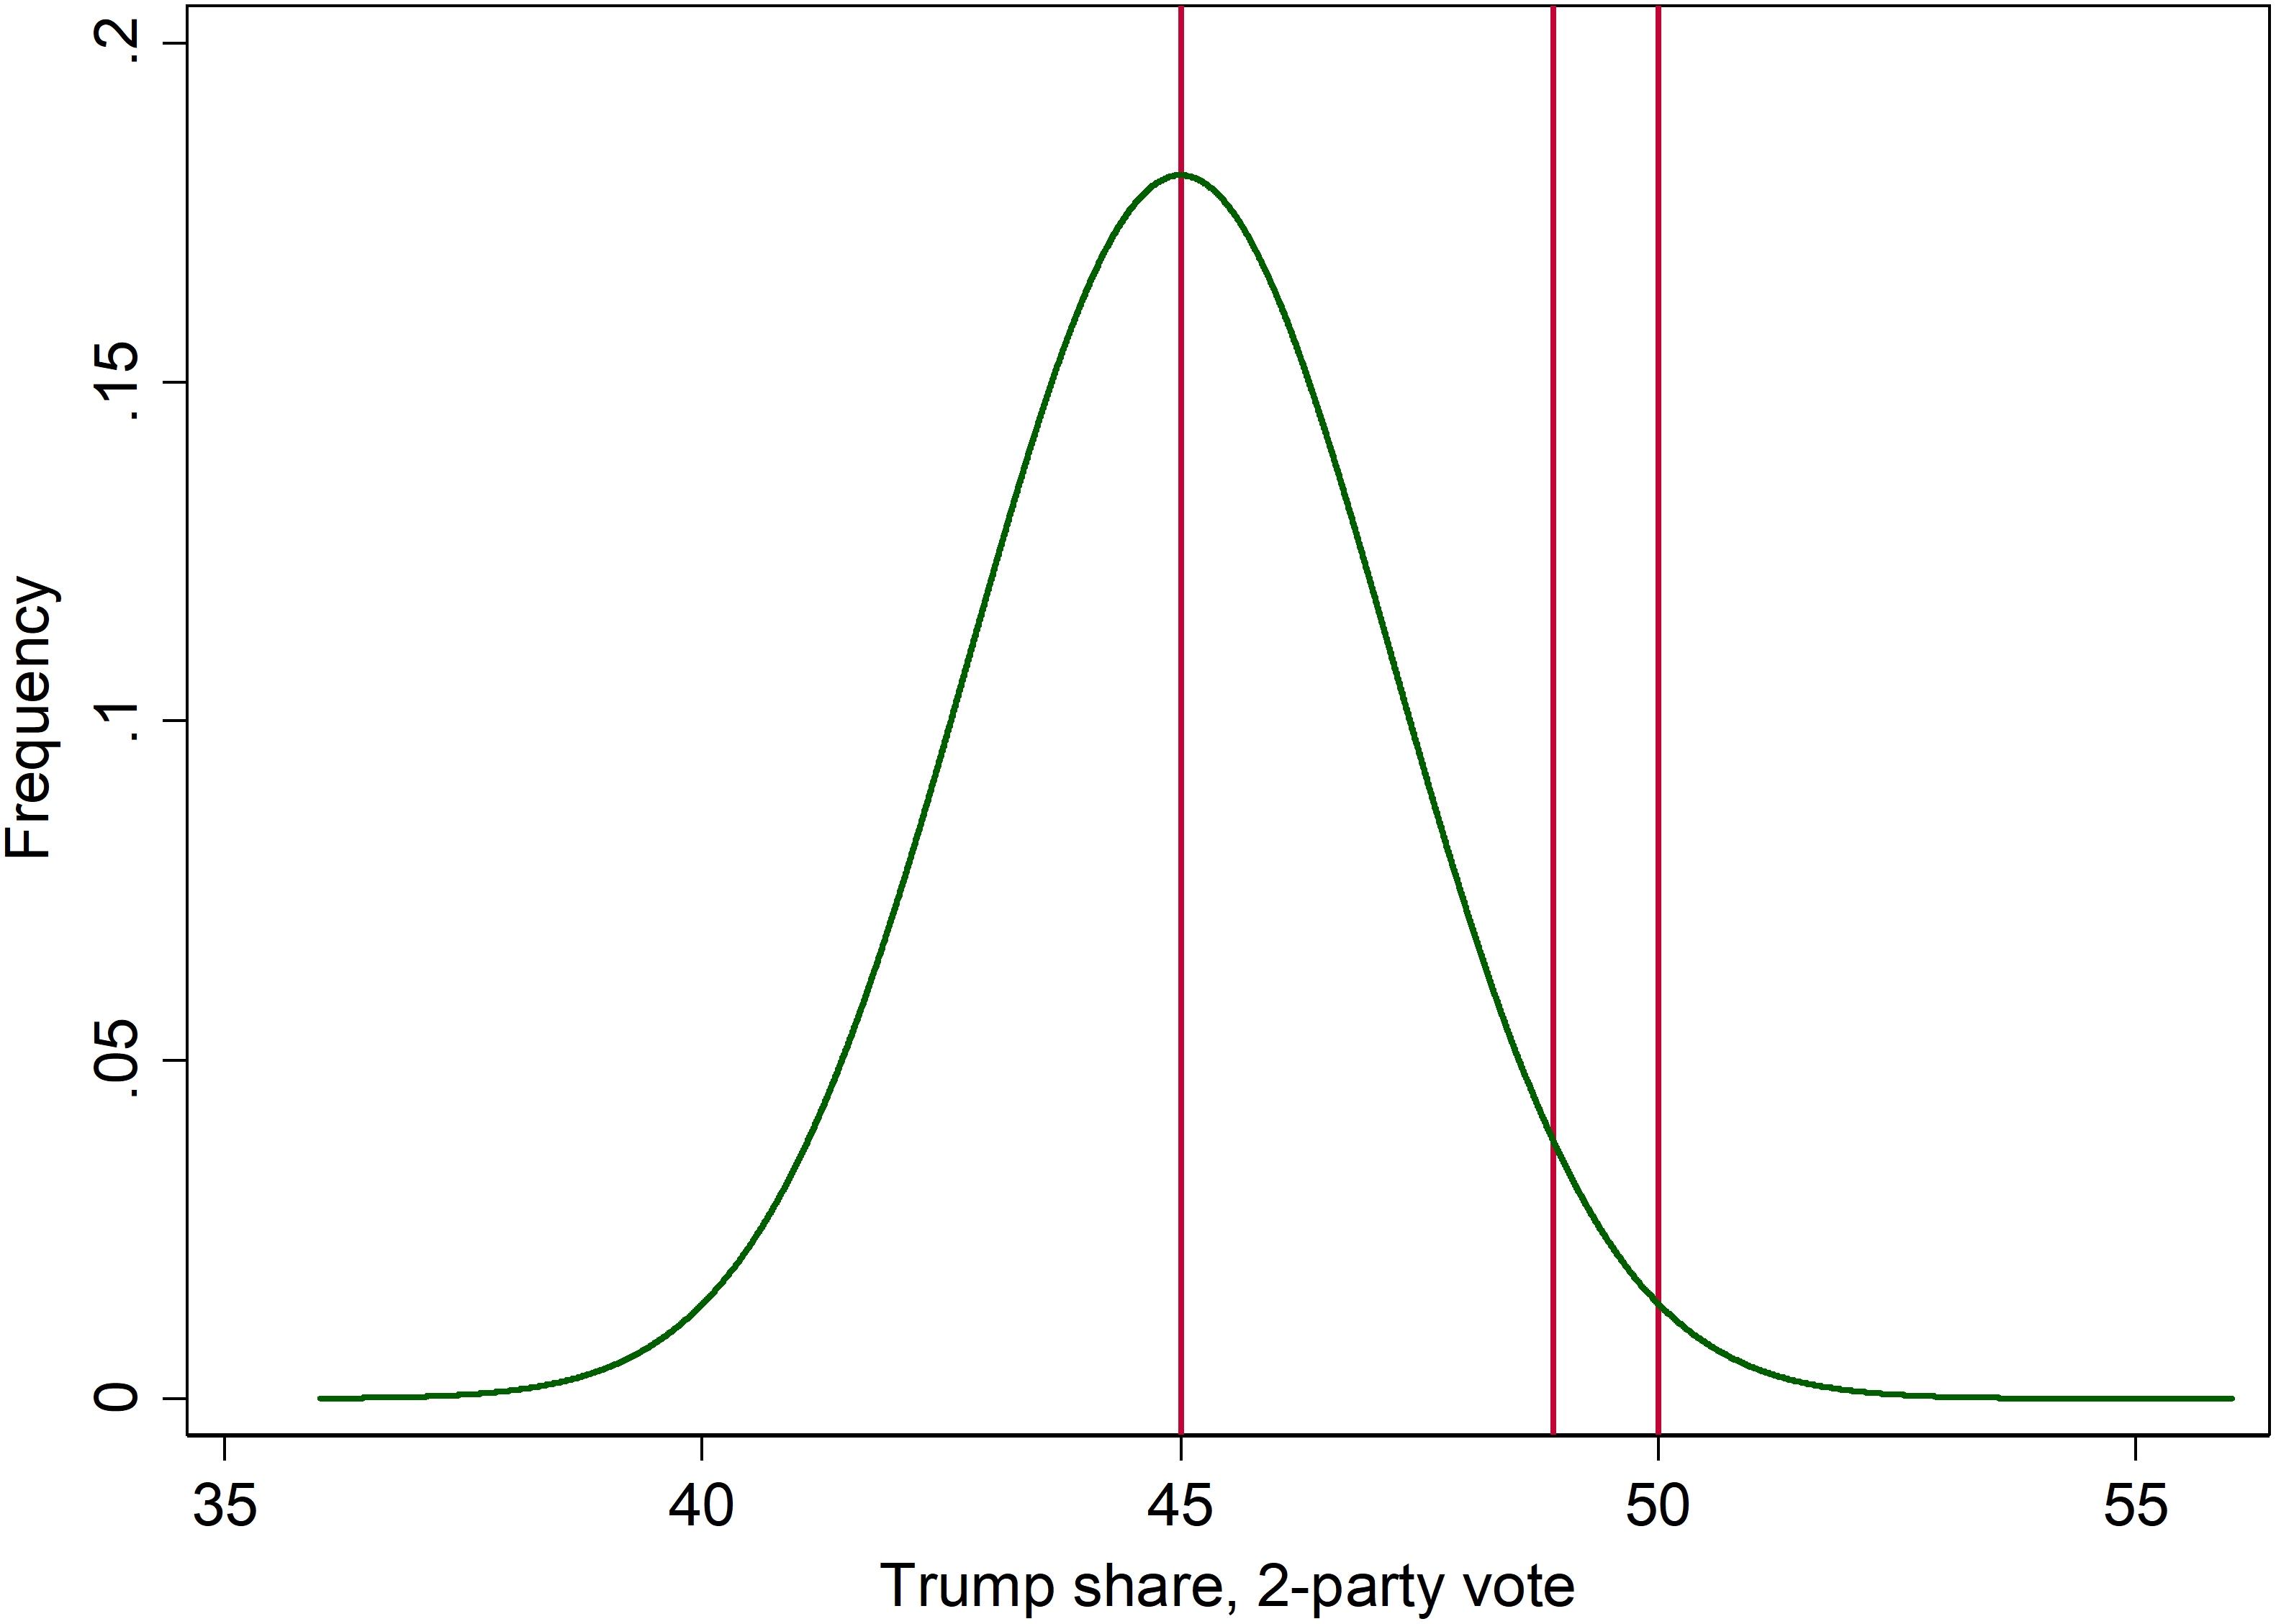
We really forecast a distribution of outcomes. This is clear from the fact that we provide not only a predicted vote share but also the probability of victory. Based on the forecasted vote share and standard error, we can produce a probability distribution associated with different vote outcomes, shown in figure 1.Footnote 2 Here we can see that, although our forecast (45.0) is most likely, it is far from certain, and a range of outcomes are possible, including a Trump popular vote win; that is, if we ran the election 100 times from this point (mid-September) forward, we would expect Trump to win the vote 4 times. It is a small number but keep in mind that since 1952, no candidate who has been trailing in the polls after the conventions has won the popular vote, and Biden’s lead is not trivial. Even if Biden wins the popular vote, there is a chance, of course, that he will not carry the Electoral College. One potentially important cut-point is the Trump (two-party) margin from 2016, which was 48.9%, indicated by the middle vertical line in figure 1. Based on the distribution of forecasts, Biden’s chances of winning by that amount or more are 90%. This is just a hypothetical baseline, and he might need a larger margin to win the Electoral College—yet he could win it with a smaller share, possibly even if he were to lose the popular vote.
Probability of a 2020 Trump Victory Based on Our Post-Convention Popular Vote Forecast
Note: The figure shows three vertical lines at 45.0% (our mean popular vote forecast), 48.9% (Trump’s vote in 2016), and 50%.

CONCLUSIONS
Our model based on trial-heat polls and cumulative growth in LEI forecasts a popular victory for Joe Biden over Donald Trump, and by an ample margin to avoid worries of an Electoral College upset. This is true whether polls are averaged for the second quarter of the election year or when measured after (and before) the national conventions. A Biden advantage was evident even when using polls from the first quarter of the election year, before the impact of COVID-19. Already in Quarter 13, an effect of COVID-19 was felt on LEI, and this shifted our forecast substantially, turning a slight Biden advantage into a large one. Trump’s poll share declined much as we would expect. That evolving economic conditions were in part precipitated by an exogenous shock might mitigate its impact on voters. Political polarization might too.
We close by returning to the point that presidential elections are not only about the economy, and 2020 is no exception (see the online appendix). Consider that the direct effects of COVID-19—and the government response to it—may matter as much or more than the economic troubles it unleashed. There are yet other influences, the mix of which may be apparent from Gallup’s June survey of most important problems, which showed a virtual tie between four factors: government leadership (21%), COVID-19 (20%), race relations (19%), and the economy (19%).Footnote 3 Whatever is driving voters in 2020, polls reveal their effects leading up to Election Day, if imperfectly. But, they cannot anticipate how changes in the conduct of elections will affect turnout and vote counting itself. This adds to the uncertainty surrounding our forecast.
ACKNOWLEDGMENTS
This article was presented at the 2020 Annual Meeting of the American Political Science Association, Virtual. We thank Ataman Ozyildirum of the Conference Board for assistance with LEI and input on changes in the construction of the index over the years. We also thank the editors Ruth Dassonneville and Charles Tien, and the anonymous reviewers for their helpful comments.
DATA AVAILABILITY STATEMENT
Replication materials are available on Dataverse at https://doi.org/10.7910/DVN/UQ2BCG.
SUPPLEMENTARY MATERIALS
To view supplementary material for this article, please visit http://dx.doi.org/10.1017/S1049096520001481.