INTRODUCTION
The transfer of carbon across trophic levels in food webs is a central process in ecosystem dynamics. In aquatic ecosystems, crustacean zooplankton provides the main link between primary production and organisms at higher trophic positions, such as pelagic fish. Copepods often dominate the crustacean zooplankton communities comprising as much as 80% of the total zooplankton biomass (Longhurst, Reference Longhurst1985), and they form the dietary basis for many commercially important pelagic fish in coastal productive areas (Cushing, Reference Cushing1989). It has long been known that the quality of the ingested food, in addition to other factors such as temperature or prey selection, constitute essential components in growth requirement, reproduction, and together with natural mortality, they play an important role influencing the population dynamic of marine copepods (e.g. Jónasdóttir et al., Reference Jónasdóttir, Fields and Pantoja1995; Kleppel & Hazzard, Reference Kleppel and Hazzard2000; Hirst & Kiørboe, Reference Hirst and Kiørboe2002; Jones et al., Reference Jones, Flynn and Anderson2002). In productive coastal areas, most copepods encounter a rapidly changing environment, an ‘organic soup’ with a complex mix of potential food particles, including not only phytoplankton, but also heterotrophic and mixotrophic protists (Verity & Paffenhöfer, Reference Verity and Paffenhöfer1996; Vargas & González, Reference Vargas and González2004). Under such conditions, food quality and food concentration can drastically influence their gross growth efficiency, with important implications for trophic transfer in coastal food webs (Jones et al., Reference Jones, Flynn and Anderson2002). When food quantity and/or food quality limit copepod growth, carbon might be converted at lower rates into zooplankton biomass, and a substantial amount of biogenic carbon can accumulate at the primary producer level or be exported to the sediments, instead of being transferred up through the pelagic food web (Turner, Reference Turner2002). When food conditions are optimal for copepods they are able to grow fast and build up a large population biomass, which in turn makes the zooplankton more resilient to exploitation by higher trophic levels (i.e. pelagic fisheries; Vargas et al., Reference Vargas, Martínez, Cuevas, Pavez, Cartes, González, Escribano and Daneri2007).
In the last decades, most experimental and field studies on zooplankton have focused on quantitative aspects of feeding, and the effects of food quantity and quality on reproduction (e.g. Guisande et al., Reference Guisande, Riveiro and Maneiro2000; Jónasdóttir et al., Reference Jónasdóttir, Gudfinnsson, Gislason and Astthorsson2002; Vargas et al., Reference Vargas, Escribano and Poulet2006). Several hypotheses state the effect of ‘nutritional deficiencies’ (e.g. Pond et al., Reference Pond, Harris, Head and Harbour1996; Jónasdóttir et al., Reference Jónasdóttir, Gudfinnsson, Gislason and Astthorsson2002) and ‘toxic diatom’ effects (e.g. Miralto et al., Reference Miralto, Barone, Romano, Poulet, Ianora, Russo, Buttino, Mazzarella, Laabir, Cabrini and Giacobbe1999; Ianora et al., Reference Ianora, Miralto, Poulet, Carotenuto, Buttino, Romano, Casotti, Pohnert, Wichard, Colucci D' Amato, Terrazzano and Smetacek2004) on copepod reproduction and development failures. Contradicting laboratory and field studies have reached opposing conclusions on the effects of copepod diet on reproduction and recruitment success (e.g. Irigoien et al., Reference Irigoien, Harris, Verheye, Joly, Runge, Starr, Pond, Campbell, Shreeve, Ward, Smith, Dam, Peterson, Tirelli, Koski, Smith, Harbour and Davidson2002; Ianora et al., Reference Ianora, Miralto, Poulet, Carotenuto, Buttino, Romano, Casotti, Pohnert, Wichard, Colucci D' Amato, Terrazzano and Smetacek2004; Poulet et al., Reference Poulet, Wichard, Ledoux, Lebreton, Marchetti, Dancie, Bonnet, Cueff, Morin and Pohnert2006). However, not only is reproduction one of the key processes involved in copepod recruitment, but the qualitative aspects of food affecting their growth rates may also be relevant. Both food quantity and quality parameters have been shown to be important regulators of marine copepod growth as found by laboratory experiments and modelling (e.g. Touratier et al., Reference Touratier, Legendre and Vezina1999; Jones et al., Reference Jones, Flynn and Anderson2002), and several studies have shown how those variables exhibit a high variability in nature (Jónasdóttir et al., Reference Jónasdóttir, Fields and Pantoja1995; Guisande et al., Reference Guisande, Riveiro and Maneiro2000; Kleppel & Hazzard, Reference Kleppel and Hazzard2000). Temperature has also long been recognized as modulating copepod growth in nature (Huntley & Lopez, Reference Huntley and Lopez1992), but because of its strong correlation with food it has been difficult to assess its relative importance and it may still be a matter of controversy (e.g. Richardson & Verheye, Reference Richardson and Verheye1998).
The role of nutrition on copepod production has focused at different levels, including: (a) elemental composition of diet (e.g. Elser & Hassett, Reference Elser and Hassett1994); (b) the role of fatty acids (e.g. Jónasdóttir, Reference Jónasdóttir1994; Vargas et al., Reference Vargas, Escribano and Poulet2006); (c) amino acids (e.g. Kleppel et al., Reference Kleppel, Burkart and Houchin1998); and (d), to a lesser extent, cholesterol (Hassett, Reference Hassett2004). Thus, there is a need to quantify accurately the selective feeding of different copepod species, the nutritional quality of the selected size-fraction/prey, and their direct implications in their growth rates. To assess whether changes in the diversity of functional groups (i.e. phytoplankton versus protozoan), prey selectivity, and nutritional value of the selected prey (i.e. fatty acid composition) might regulate copepod growth rates in the field, we performed a seasonal field survey, including 8 experiments on feeding and growth rates. Our objectives were: to assess how copepod ingestion rates, prey biomass, and its quality characterized by nutritional value fatty acid composition, vary throughout the year; and then to examine the relative influence of these factors upon copepods maximal growth rates.
MATERIALS AND METHODS
Collection of animals
Experiments were conducted successively from 28 to 29 July, 9 to 10 and 29 to 30 November 2004, 28 to 29 February and 6 to 7 June 2005. Copepodites were sampled at one coastal station located in Coliumo Bay (36°5′S 73°20′W). Copepodites of the numerically dominant species (Vargas et al., Reference Vargas, Escribano and Poulet2006, Reference Vargas, Martínez, Cuevas, Pavez, Cartes, González, Escribano and Daneri2007) Acartia tonsa and Paracalanus indicus were collected with slow vertical hauls in the upper 25 m using a WP-2 net (mesh size 200 µm) with a large non-filtering cod end (~40–60 l). Immediately after collection the contents of the cod end were transferred to a thermobox and brought to the coastal laboratory. Within 1 hour after collection, undamaged copepodites were sorted using a wide-mouthed dropper under stereomicroscope (Olympus SZ-51) and transferred to 200 ml beakers and stored at in situ temperature until setting up the experiment. In situ temperature was measured during each field campaign through vertical profiles recorded from near the bottom to the surface using a SeaBird SBE-19 plus CTD equipped with an YSI-calibrated Beckman oxygen sensor and a Wetstar fluorometer.
Growth rate estimations
Growth rate (GR) of copepodites was estimated from the moulting ratio (MR) method (Peterson et al., Reference Peterson, Tiselius and Kiørboe1991). Most experiments were conducted with copepodites CIII and CIV. Potential errors in the MR method may occur at the CV stage because the following stage (CVI) does not moult (Hirst et al., Reference Hirst, Peterson and Rothery2005); we therefore assumed that potential error in our estimations of juvenile growth were not considerable in our younger copepodites. To estimate the moulting rate of copepodites, at least 10–20 individuals of a given stage were all together incubated in 100 ml glass crystallizing dishes. Copepodites were concentrated from a bucket using a sieve and washed into a Petri dish. Specimens were selected using a wide-mouthed dropper under a dissecting microscope and separated by species and stage (i.e. mostly CIII and CIV). No anaesthesia was used during this process. All copepodites were fed with natural food assemblages (NFA) <200 µm collected at the same sampling site at the depth of chlorophyll-a maxima (i.e. range between 5 and 10 m depth). Crystallizing dishes were incubated in a cold room at in situ temperature (~12–13°C) and 12 light:12 dark light cycle. After 24 hours the contents of the dishes were poured through a 45 µm mesh, washed into a Petri dish, and the numbers of moulted and non-moulted individuals to the next stage were counted (MR). Simultaneously, living copepodites were sorted individually in a small Petri dish, rinsed quickly about three times with <0.45 µm filtered seawater and finally transferred to a small cryovial. The copepods were dried at 50°C for 6–10 hours and kept frozen, at about −20°C, until analysis in a Flash EA Elemental CHN analyser (Thermo Quest Italia, Milan, Italy). Stage duration (T) and MR were calculated according with the method of Peterson et al. (Reference Peterson, Tiselius and Kiørboe1991). From MR values, and individual carbon contents, the daily carbon-specific growth rate (SGR) was calculated as follows:

where Ci = average carbon content (μgC cop−1) of an individual in stage i, Ci+1 = average carbon content (μgC cop−1) of an individual in stage i+1, Ni = the number of individuals in stage i at the end of the experiment, Ni+1 = the number of individuals in stage i+1 at the end of the experiment, and t = the duration (h) of the incubation experiment. Carbon content (Ci and Ci+1) was assessed on copepod collected directly from the field (i.e. Coliumo Bay).
Feeding experiments
Procedures used to estimate daily ingestion rate (IR) were based on size-fractioned chlorophyll-a (Chl a) and cell counts (Vargas & González, Reference Vargas and González2004; Vargas et al., Reference Vargas, Martínez, González and Silva2008). Copepodites stages were fed with NFA occurring in the field at the same time as the experiments. Water for incubation was collected from ~5 m (i.e. the same depth as that used for growth rate experiments) with clean Teflon-coated Niskin bottles GO-FLO (5 l; General Oceanic, Miami, Florida, USA) and subsequently carefully screened through a 200 µm net to remove most grazers. The animals were pipetted into 500-ml acid-washed borosilicate bottles with ambient water and filled to avoid air bubbles. Three control bottles without animals and three bottles with 5–6 animals each were placed on a plankton rotating wheel (0.2 rpm) in 12L:12D light cycle and in situ temperature in a cold room for approximately 20–24 hours. In all experiments, 60 ml subsamples from the control bottles were immediately preserved with 2% acid, Lugol's solution, for cell counts. At the end of the incubation, 60-ml subsamples from all bottles were taken and preserved in acid Lugol's solution to determine cell concentration. Same cell counting methods were used for both the NFA and feeding experiments. In addition, a subsample (100 ml) for determination of size-fractioned Chl a (<5 µm; 5–20 µm and >20 µm) was also filtered and dark extracted in acetone 95% before measurement on a TD 700 Turner fluorometer (Strickland & Parsons, Reference Strickland and Parsons1972).
Bacteria and cyanobacteria abundance were estimated by flow cytometry according to Marie et al. (Reference Marie, Partensky, Jacquet and Vaulot1997). Small nanoflagellates were counted from 20 ml subsamples filtered at 0.8 µm and stained with proflavine (0.033% W/V in distilled water) according to Haas (Reference Haas1982) until subsequent analysis with an epifluroescence microscope Zeiss Axioscope 2 Plus. Autotrophic cells were also distinguished through the use of autofluorescence. Diatoms, dinoflagellates, and ciliates were counted under an inverted microscope (Nikon Eclipse TE-2000-S). Cells were identified, counted, and measured after 24 hours of settling in 50 ml chambers using inverted microscopy at 200 × magnifications (Utermöhl, Reference Utermöhl1958). For plasma volume estimations a minimum of 50 cells species−1 were counted. Carbon to plasma volume ratios were extrapolated from the literature (e.g. Edler, Reference Edler1979; Ohman & Snyder, Reference Ohman and Snyder1991). Subsamples of 150 ml were also taken from each bottle to quantify size-fractioned Chl a using dark extraction of the fractions in 95% acetone (Strickland & Parsons, Reference Strickland and Parsons1972), and measured on a Turner Designs model 700 fluorometer. Clearance and ingestion rates, measured as size-fractioned Chl a depletion and cell removal, were calculated according to Frost (Reference Frost1972), modified by Marín et al. (Reference Marín, Huntley and Frost1986).
One of the potential biases in using incubation methods is that the prey suspension contains several trophic levels. In order to cope with this source of bias, a three-component equation template was used to evaluate the interactions among three grazers in differently structured three-component food chains (Tang et al., Reference Tang, Jakobsen and Visser2001). Corrections concerned the flagellates–ciliates–copepod and flagellates–dinoflagellates–copepod interactions. Values for protozoan grazing used in this equation template were estimated by size-scaling (Hansen et al., Reference Hansen, Bjørnsen and Hansen1997).
Prey biomass and quality analysis
A detailed analysis of the composition of the natural food at each sampling and feeding/growth experiment date was conducted. Water samples for size-fractioned Chl a, particulate organic carbon (POC), bacteria, cyanobacteria, nanoflagellates, dinoflagellates, ciliates, and diatom biomass estimates were sampled at the same station where copepods were collected. Seawater samples were taken from 5 and 20 m depth with 30 l Niskin bottles, and cell biomass was integrated for the upper 35 m depth to characterize the food variability in the mean depth of the euphotic zone. Cell counts were conducted with the same protocol as for feeding experiments. Size-fractioned Chl a and fatty acid composition analyses were achieved in seawater samples collected at 5 m depth, corresponding to the maximum Chl a layer, and the same depth where grazing and growth rate experiments were conducted. Size-fractioned fatty acid (FA) composition was used as a measurement of food quality in different size-fractions of NFA, especially the availability of polyunsaturated (PUFA) and highly unsaturated fatty acids (HUFA), which are recognized as indicators of food quality for reproduction and growth in copepods (Jónasdóttir, Reference Jónasdóttir1994; Pond et al., Reference Pond, Harris, Head and Harbour1996; Klein Breteler et al., Reference Klein Breteler, Schogt, Baas, Schouten and Kraay1999). Here, we consider PUFA as all those FA with more than double bond, and HUFA as a subsample of PUFA with twenty or more C atoms (Brett & Müller-Navarra, Reference Brett and Müller-Navarra1997). Seawater samples were fractioned into three size-fractions: <2, 2–20 and >20 µm, representing pico-, nano-, and microplankton, respectively (Sieburth et al., Reference Sieburth, Smetacek and Lentz1978). For POC and FA analyses, each size-fraction was filtered directly onto pre-combusted (450°C) glass-fibre filters (Whatman GF/C). Size-fractioned POC was determined with a Flash EA Elemental CHN analyser (ThermoQuest Italia, Milán, Italy). Size-fractioned FA samples were analysed after extraction and methylation (Kattner & Fricke, Reference Kattner and Fricke1986) with a gas chromatograph Perkin-Elmer Sigma 300, equipped with a programmable temperature vaporizer–injector, a fused Omegawax 53 capillary column and a flame ionization detector.
Statistical analysis
We used simple and multiple regression models to evaluate the relative importance of three main factors influencing SGR of copepods: food quality (i.e. size fractionated HUFA and PUFA per their respective biomass, as POC), prey biomass (i.e. nanoflagellates, ciliates, dinoflagellates and diatoms), and ingestion rates (i.e. on different Chl a size fractions and on different prey). Since copepod species may exhibit different swimming and feeding behaviour (Tiselius, Reference Tiselius1992; Vargas & González, Reference Vargas and González2004), we analysed available data of A. tonsa and P. indicus separately. First, within each factor, the relationship between variations in SGR of copepod species and the subset of variables representing surrogates of, for instance, food quality was estimated as the coefficient of determination (r2) using simple linear regression. In the next step, among variables within each factor, the independent contribution of each surrogate variable to the SGR of copepods was assessed using the squared semi-partial correlation (sr 2) using type II square sum error in a multiple regression model (Tabachnick & Fidel, Reference Tabachnick and Fidel1989). This correlation characterizes the pure effect of each variable on SGR by taking into account all the other variables included in the model (Freckleton, Reference Freckleton2002). We selected variables showing significant and/or highest sr 2 for further model selection. Using these selected variables we evaluated the among-factors relative influence over variations in SGR of copepods. This analysis also considers the estimation of sr 2 and model selection, as described above (i.e. see Lagos et al., Reference Lagos, Castilla and Broitman2008). Finally, temperature was also included as a fourth factor to represent the environmental variability during the study period. All independent variables were log-transformed and all the analyses were implemented using PROC GLM in SAS software (SAS Institute, 1996).
RESULTS
Size fractioned chlorophyll, POC and fatty acid biomass
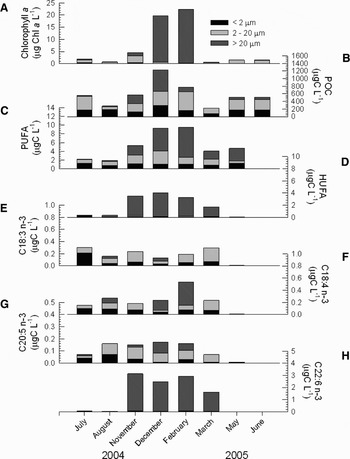
A dominant feature during our sampling period was the occurrence of the highest surface (5 m depth) Chl a concentration during December 2004 and February 2005, which ranged between 20 and 23 µg Chl a l−1. In summer, Chl a in the >20 µm microphytoplankton size fraction accounted for more than 80% of total Chl a, whereas nanophytoplankton (i.e. 2–20 µm Chl a fraction) dominated during the rest of the year (Figure 1A). The contribution of picoplankton to total Chl a was permanently <5–10% of total Chl a (Figure 1A). This pattern was highly consistent with the temporal distribution of size-fractioned POC, as POC >20 µm clearly dominated in October and December, when Chl a >20 µm was the most important size fraction (Figure 1B).
Seasonal variation of size-fractioned ambient parameters evaluated at 5 m depth in a coastal site off Coliumo Bay, Central Chile (36°S). (A) Chlorophyll-a concentration; (B) particulate organic carbon (POC) concentration; (C) concentration of polyunsaturated fatty acids (PUFA); (D) highly polyunsaturated fatty acids (HUFA); (E) linoleic acid (C18:3 n-3); (F) linolenic acid (C18:4 n-3); (G) eicosapentanoic acid (EPA, C20:5 n-3); (H) docosahexanoic fatty acid (DHA, C22:6 n-3). Colour legend is similar to in plot (A).

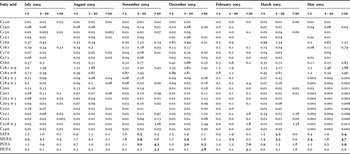
Similar temporal patterns showed the PUFA and HUFA availability for copepods (Figure 1C, D). Size-fractioned fatty acid concentration in NFA showed that PUFA, in particular HUFA concentrations, were highest during the spring/summer season, and mostly associated to the largest size-fraction of NFA (>20 µm microphytoplankton fraction) (Figure 1C, D). The major fatty acid groups of saturated (SAFA), monounsaturated (MUFA), polyunsaturated (PUFA) and highly unsaturated (HUFA; carbon chain length >20) are shown in detail for each field campaign in Table 1. Palmitic (C16:0), palmitoleic (C16:1), and oleic acid (C18:1 n-9) were abundant during winter (Table 2), and they contributed significantly to total SAFA and MUFA concentration mainly associated to the pico- and -nanoplankton size fractions (Table 2). Linoleic acid (C18:3 n-3) is also mostly associated with those small size fractions (Table 2), without significant changes throughout the year (Figure 1E). In winter, both PUFA and HUFA concentration were relatively low in all size fractions (<1 µg l−1). Nevertheless, during spring/summer months total PUFA and HUFA concentration increased sharply (Table 2; Figure 1C, D), mostly due to the contribution of eicosapentanoic (EPA, C20:5 n-3) and docosahexanoic (DHA, C22:6 n-3) fatty acid in the >20 µm microphytoplankton fraction (Table 2; Figure 1G, H). However, EPA concentration in the nanoplankton fraction is also significant, especially during late winter and early spring (Figure 1G).
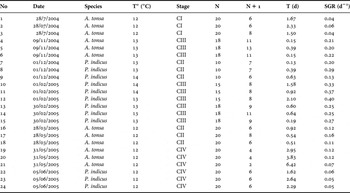
Growth rate experiments conducted with different copepod species. Incubation temperature, copepod stage, number of incubated copepods (N), and number of moulted copepods (N+1) are shown for each experiment. Specific growth rate and stage duration (T) was estimated according to Peterson et al. (Reference Peterson, Tiselius and Kiørboe1991).

A. tonsa, Acartia tonsa; P. indicus, Paracalanus indicus.
Size-fractioned fatty-acid concentration (μg l−1) for the pico- (<2 µm), nano- (2–20 µm), and microplankton (>20 µm) size fraction during each sampling campaign. Total saturated (SAFA), monounsaturated (MUFA), polyunsaturated (PUFA), and highly unsaturated fatty acids (HUFA) are also included. Values in bold correspond to maximum concentrations >2 µg l−1 observed during each campaign.

Ingestion and growth rate of copepods and the effect of food quantity and quality
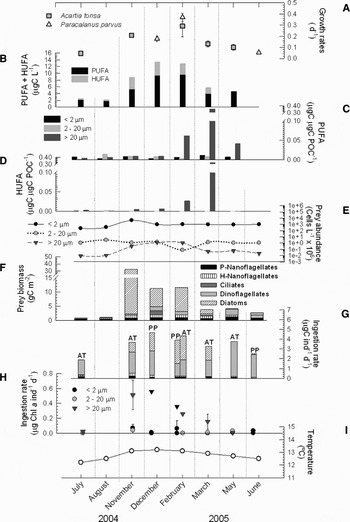
A total of 24 growth rate measurements were conducted during the present study. Stage duration in A. tonsa ranged between 0.4 and 3.8 days for the different copepodite stages, whereas in P. indicus it ranged from 0.2–2.1, depending on the different stage, sampling period and environmental conditions (Table 1). The specific growth rates for A. tonsa and P. indicus ranged from 0.04–0.22 d−1 and from 0.1–0.4 d−1 (Table 1). Both copepod species showed a seasonal trend in growth rates, with a significant increment in growth during austral spring/summer months and a decrease during autumn (Figure 2A). As described in the previous section, a similar trend was observed for the PUFA and HUFA concentration, with highest values during the spring/summer season (Figures 1C, D & 2B). However, when fatty acid concentration is standarized in terms of POC available at the same depth, we found that highest availability of PUFA and HUFA per biomass occurred during autumn in March, and this suggested that the potential highest quality in the >20 µm food particles occurred after the fallout of diatom blooms in autumn (Figure 2C, D). A detailed analysis of prey abundance and biomass composition showed that the abundance of small cells <20 µm did not experience large changes throughout the year. However, large microplankton cells >20 µm increased sharply between November and February (Figure 2E). A detailed analysis of integrated prey biomass in the upper 35 m depth also confirms this temporal pattern. During this spring/summer season the large biomass of >20 µm food size-fraction corresponded mostly to large chain-forming diatoms (Figure 1F). At that time, and especially during November, the diatom population in the >20 µm size-fraction was dominated by dense blooms of the diatoms Thalassiosira spp. and Skeletonema japonicum. Throughout the rest of the year, diatom biomass was very low and copepod food availability was based on the diminished standing stocks of dinoflagellates and phototrophic/heterotrophic nanoflagellate protozoan (Figure 2F). In consequence, the high biomass of large diatoms (>20 µm) during spring–summer could have accounted for a significant fraction of the high DHA fatty acid concentration in this microplankton size fraction (Figure 1H). However, the >20 µm HUFA concentration in terms of POC in the same size fraction (Figure 2D), suggested a low HUFA concentration per cell during that period.
Seasonal variation of different environmental variables and physiological rates evaluated at a coastal site off Coliumo Bay, Central Chile (36°S). (A) Mean copepod growth rate; (B) concentration of total polyunsaturated (PUFA) and highly unsaturated fatty acid (HUFA); (C) concentration of size-fractioned PUFA standardized to POC concentration; (D) concentration of size-fractioned HUFA standardized to POC concentration; (E) size-fractioned prey abundance; (F) upper 35-m depth integrated biomass of autotrophic and heterotrophic prey; (G) mean daily carbon ingestion rate of Acartia tonsa (AT), Paracalanus indicus (PP) copepodites; (H) copepod ingestion rate based in size-fractioned Chl a clearance for both copepod species; (I) mean surface temperature. Size-fractions in (B) and (C) correspond to pico- (<2 µm), nano- (from 2–20 µm) and microplankton (>20 µm) from natural food assemblages (NFA). Colour legend is similar in plots (C) and (D), and (F) and (G).

Mean carbon ingestion rate of A. tonsa and P. indicus showed a very low variation throughout the year, comprising between 2 to ~4 µgC ind−1 d−1 (Figure 1E). However, the contribution of the different food items to copepod diet reflected a clear seasonal change in the contribution of protozoan versus diatoms to carbon ingestion in agreement with their abundance in the field (Figure 1F). During winter, copepods were feeding mostly on dinoflagellates and some few nanoflagellates, whereas during spring and summer diatoms (i.e. mostly Thalassiosira sp. and S. japonicum) contributed significantly to copepod diet (~30–40% of carbon ingestion). Subsequently, after the decrease of diatom blooms in autumn, copepods again switched their diet and became omnivorous, feeding almost exclusively on dinoflagellates. Ingestion rate based on size-fractioned Chl a confirm those results (Figure 2H), with highest removal of Chl a >20 µm during spring–summer diatom blooms, whereas for the rest of the year, Chl a ingestion was very low, as copepod diet was based mostly on mixotrophic or heterotrophic dinoflagellates (Figure 2G).
This seasonal pattern clearly showed that during the spring–summer months of highest diatom abundance, high diatom ingestion by copepods, and high HUFA concentration, especially DHA, in large food size-fraction were observed. Finally, the influence of the upwelling of cold water during spring–summer seems to buffer the warming-up effect of solar radiation in the upper water column during these months. Therefore, the most remarkable changes in seawater temperature during our study period were around 1°C (Figure 1I).
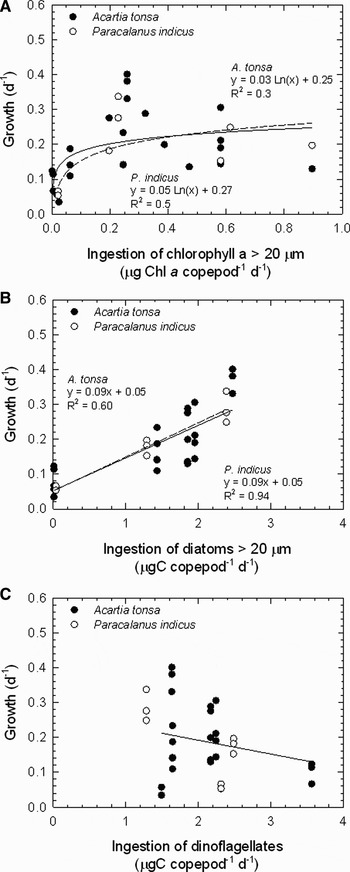
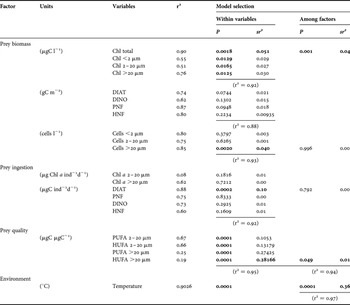
Simple regression analysis (r 2) and estimation of the pure influence (sr 2) of each variable on growth rates of A. tonsa (Table 3) showed that different variables used to represent prey biomass showed a significant influence on this copepod species. However, total Chl a concentration (sr 2= 0.051) overrides the rest of the variables. In terms of prey selectivity, the ingestion of diatoms showed the highest influence over A. tonsa growth (sr 2 = 0.1). In fact, a simple regression analysis of the whole experimental data showed that the growth rates were positively and significantly correlated with ingestion of Chl a >20 µm (r2 = 0.3–0.5) and specially diatom ingestion (r2 = 0.6–0.9) for both copepods species (i.e. logarithmic and linear fitted curve, respectively; Figure 3A, B). No significant correlation was found between the ingestion of dinoflagellates and copepod growth rate (Figure 3C). Finally, in terms of food quality (i.e. size fractioned fatty acid per their respective biomass), the large size fraction of HUFA (>20 um) showed the highest and significant influence on A. tonsa growth rates (sr 2 = 0.28). In all within variables analysis the sum of individual sr 2 values was lower than the r2 of the multiple regression models suggesting that such different variables may have a synergistic effect on copepods growth rates. In the model selection of variables among factors, total Chl a (sr 2 = 0.04) and HUFA >20 µm (sr 2 = 0.01) showed the largest and significant influence on A. tonsa growth. Finally, when temperature is included in a three parameter model, including total Chl a and HUFA >20 µm fraction, this environmental variable showed the highest pure effects over copepods growth (sr 2 = 0.36) (Table 3), and total Chl a and HUFA >20 doubled its pure effects (sr 2 = 0.07 and 0.02, results not included in Table 3).
Relationship between (A) ingestion rates of chlorophyll-a >20 µm, (B) ingestion of diatoms, and (C) ingestion of dinoflagellates and specific growth rates of the copepods Acartia tonsa and Paracalanus indicus.

Relationship between surrogate variables representing food quality, food quantity and feeding behaviour with specific growth rates (SGR) of the copepod Acartia tonsa; r2 is the coefficient of determination for the corresponding simple regression model (N = 23); sr2 is type II semi-partial squared correlation estimated among variables within factors and among factor of selected variables. Below line is showed the r2 for the multiple regression models. Variables showing significant P values (in bold) and the highest sr2 estimation (in bold) were selected for model selection among factors.

Chl a, chlorophyll-a; size fractions: <2 µm = smallest, 2–20 µm = mid-size, and >20 µm = largest size fraction; DIAT, diatoms; PNF, phototrophic nanoflagellate; HNF, heterotrophic nanoflagellate; DINO, dinoflagellate.
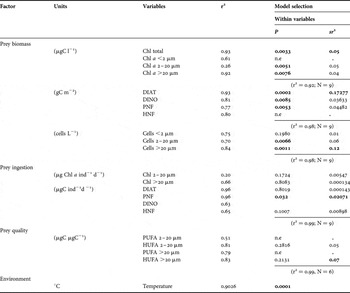
A similar result was found for P. indicus growth (Table 4). Total Chl a (sr 2 = 0.05), diatom biomass and abundance of largest cells (>20 μm) showed the more significant and highest pure effects as characterized by sr 2 (Table 4). Nevertheless, the ingestion of phototrophic nanoflagellates (PNF) showed the highest influence on P. indicus growth (sr 2 = 0.1). In terms of food quality, the largest size fraction of standardized HUFA (>20 μm) also showed the highest and significant influence (sr 2 = 0.07) on copepodite growth. In all within variables analysis the sum of individual sr 2 values was lower than the r2 of the multiple regression models. These results may thus suggest that all these different variables may have a synergistic effect on copepodite growth rates. However, in the model selection of variables among factors none of the variables showed significant influence on P. indicus growth rates (Table 4), although this lack of fit may have resulted from the low number of data available for this species.
Relationship between surrogate variables representing food quality, food quantity and feeding behaviour with specific growth rates (SGR) of the copepod Paracalanus indicus; r2 is the coefficient of determination for the corresponding simple regression model. sr2 is type II semi-partial squared correlation estimated among variables within factors and among factor of selected variables. Below line is showed the r2 for the multiple regression models. Variables showing significant P values (in bold) and the highest sr2 estimation (in bold) were selected for model selection among factors but no significant result was found in these analyses. n.e., non estimable because the variable may represent a linear combination of the rest of variables (redundant).

Abbreviations: see Table 3.
DISCUSSION
The idea that nutritional constraints can be an important regulating mechanism for the flux of organic matter and nutrients in food webs was mentioned in the early 20th Century by Lotka (Reference Lotka1925). However, nowadays field studies that might define and parameterize the key ecological factors regulating the energy transfer from phytoplankton to marine copepods are scarce, or mostly based on correlation analyses between the forcing factors and their effects on marine copepod population dynamics. Our results evidence that the trophic transfer of carbon and energy across the phytoplankton–zooplankton interface in coastal planktonic systems will on average be most efficient when a synergic effect of different variables can occur, such as: (1) a high diatom abundance (food quantity); (2) diatoms are preferentially ingested by copepods (copepod feeding behaviour); and (3) a relative high concentration of HUFA per large cell biomass occurs in the field (food quality). In consequence, our results suggest that food quantity and food quality, as well as, the specific copepod feeding behaviour constitute, all together, important factors controlling their growth rate in productive coastal areas. Furthermore, for some copepod species, such as A. tonsa, small changes in temperature recorded in our study (~1–1.5°C) may additionally enhance conditions for copepodite growth.
Recently, sterols and amino acids have been recognized to play an important role in copepod production (Kleppel et al., Reference Kleppel, Burkart and Houchin1998; Hassett, Reference Hassett2004), but it is also recognized that PUFA and HUFA concentrations in copepod diets are determinant indicators of food quality for reproduction and growth (Jónasdóttir, Reference Jónasdóttir1994; Pond et al., Reference Pond, Harris, Head and Harbour1996; Klein Breteler et al., Reference Klein Breteler, Schogt, Baas, Schouten and Kraay1999). They are essential for the formation of cell membrane in planktonic crustaceans. Moreover, they are almost exclusively synthesized by autotrophs, and copepods are not able to synthesize them de novo (Fraser et al., Reference Fraser, Sargent, Gamble and Seaton1989). Copepods might synthesize SAFA and MUFA de novo, but they are not able to synthesize PUFA de novo (Moreno et al., Reference Moreno, Moreno and Brenner1979). However, although many organisms might be able to elongate linolenic acid (C18:2 n-3) to eicosapentanoic (EPA: C20:5 n-3) or docosahexanoic fatty acid (DHA: C22:6 n-3), this conversion seems to be inefficient and in consequence, they will grow better when fed with direct sources of EPA and DHA (Brett & Müller-Navarra, Reference Brett and Müller-Navarra1997).
The present study constitutes one of the few attempts to explore the fatty acid composition in three different size fractions of natural food assemblages. When analysing such complex natural assemblages of phytoplankton and protozoan, the variability in composition is not only related to the different species of diatoms, dinoflagellates, and/or ciliates, but also to their physiological state (e.g. Kattner et al., Reference Kattner, Cercken and Eberlein1983). However, our results are in agreement with different studies on fatty acid composition in phytoplankton cells. For instance, similar to that found by Mayzaud et al. (Reference Mayzaud, Chanut and Ackman1989) in the Bedford Basin, and Lavaniegos & López-Cortés (Reference Lavaniegos and López-Córtez1997) in the Gulf of California, during periods of minimum growth of large phytoplankton and dominance of small nanoflagellate cells, fatty acid composition was dominated by SAFA and MUFA, such as, C16:0, C18:1 n-9 and C22:1, particularly in the pico- and nanoplankton size fractions. In contrast, during summer and upon bloom decay in early autumn HUFA concentration per unit of biomass increased. Typically, higher HUFA concentration was associated to the >20 µm microplankton fraction. This size fraction was clearly dominated during spring and summer by long chain-forming diatoms (Figure 2B, F). Diatoms usually offer high availability of EPA and DHA for copepod growth (Berge et al., Reference Berge, Gouygou, Dubacq and Durand1995). For instance, Renaud et al. (Reference Renaud, Van Thinh and Parry1999) showed high concentration of EPA and DHA in Skeletonema spp. and Chaetoceros sp., both species which usually are dominant during diatom blooms in our study area (Vargas et al., Reference Vargas, Escribano and Poulet2006). Similarly, Ying et al. (Reference Ying, Kang-sen and Shi-chun2000) also reported high values for EPA in the pennate diatoms Nitzchia and Navicula species. Therefore, diatom blooms during the spring–summer upwelling may offer higher standing-stocks of DHA and EPA for planktonic grazers, which may favour high copepod growth rates if they are selected. In fact, Brett & Müller-Navarra (Reference Brett and Müller-Navarra1997) have previously suggested that in coastal upwelling areas the highly different HUFA content between diatoms and cyanobacteria might be responsible for the great ability of these ecosystems to support high zooplankton production. Nevertheless, we are aware that some dinoflagellate and ciliate species may also exhibit high PUFA and HUFA content (e.g. Klein Breteler et al., Reference Klein Breteler, Schogt, Baas, Schouten and Kraay1999; Sul et al., Reference Sul, Kaneshiro, Jayasimhulu and Erwin2000). Indeed, high PUFA and HUFA content per POC biomass during March and May can be explained by a combination of diatom and dinoflagellate species. Since diatoms species were in low abundance in those months they had less chance of being preyed and that is why they could not contribute with much DHA and EPA for copepod growth during March.
We are aware that feeding estimations could be affected by the effects of fixatives in the numerical abundance of fragile protozoans, such as, dinoflagellates and ciliates. Although no single fixation method is ideal for all purposes, the use of acid Lugol as in the present study, usually results in significantly higher cell counts than fixing with formaldehyde (Stoecker et al., Reference Stoecker, Gifford and Putt1994).
Our growth rate estimations (0.1–0.4 d−1) were in the range of reported values in other coastal areas for A. tonsa (e.g. Miller et al., Reference Miller, Johnson and Heinle1977; Bergreen et al., Reference Bergreen, Hansen and Kiørboe1988) and P. indicus (Kimmerer & McKinnon, Reference Kimmerer and McKinnon1989). These estimates were obtained with the classical MR method, which has lately been questioned because of potential errors when estimating the mid-stage time (Hirst et al., Reference Hirst, Peterson and Rothery2005). These errors may arise because of differences in stage duration and growth rate between successive stages, and this tends to occur mainly in the late CV stage. We thus used stages earlier than CV to minimize such potential errors. Also, these sources of errors may not greatly affect our estimates of MR since our target species comprise copepods from coastal temperate regions. In theses areas, copepods, such as Acartia spp., are known to exhibit continuous growth and development and thus more uniform stage durations (Miller et al., Reference Miller, Johnson and Heinle1977; Hidalgo & Escribano, Reference Hidalgo and Escribano2007).
Since in coastal upwelling areas the temperature of the surface layer during spring–summer is still relatively low because of cooling upon the upwelling of cold waters (Vargas et al., Reference Vargas, Martínez, Cuevas, Pavez, Cartes, González, Escribano and Daneri2007), we did not consider temperature as an important variable in determining the seasonal variation in growth. Surprisingly, despite this relatively small fluctuation in temperature throughout the year (<2°C), this parameter showed an indirect influence on A. tonsa growth, perhaps due to its covariation with other environmental factors (e.g. light availability for photosynthesis). Thus, diatom ingestion, HUFA concentration in large cells, and finally temperature could be responsible for the regulation of the seasonal variation of specific growth rates in copepods inhabiting coastal ecosystems. The increase of growth rates related to diatom food intake implies a carbon-rich diet, because of their high content of lipids. Most of these essential and non-essential lipids can be thereafter used for egg production (e.g. Kainz et al., Reference Kainz, Arts and Mazumder2004). Furthermore, Vargas et al. (Reference Vargas, Escribano and Poulet2006) reported high egg production rates in A. tonsa and P. indicus when fed on large diatoms cells and high HUFA concentration was available in the field. Thus, if such ingested carbon is mostly used for reproduction, then it can be said that food quantity and specially diatom ingestion constitute key factors controlling the dynamics of somatic growth in zooplankton in coastal areas. The use of alternate heterotrophic diets during the non-upwelling season may mainly serve as complementary resources and for individual maintenance, perhaps at high individual growth rates, as suggested for coastal upwelling systems (Escribano & McLaren, Reference Escribano and McLaren1999), but necessary ingestion of carbon for somatic growth clearly takes place during the spring diatom-rich situation.
ACKNOWLEDGEMENTS
We wish to thank Andrea Belgrano for helpful comments on an early version of this manuscript. We are also grateful for the assistance of the captains and crew of the RV ‘Kay Kay’ (Universidad de Concepción, Chile) and the many undergraduate and graduate students who participated in our cruises (V. Aguilera, A. Araneda and C. Cartes). This study was fully financed by the Fondecyt Project No. 1060709 and 3040034 to C.A.V. and R.E.