I. INTRODUCTION
Double-stranded DNA, one of the most important biopolymers in living organisms, has many functions, such as the intercalation of planar-structure containing compounds, Reference Saenger1,Reference Waring2 the groove binding of cancer drugs, Reference Saenger1,Reference Waring2 the complementary interaction between nucleic acid bases, Reference Liu, Yamada, Matsunaga and Nishi3,Reference Liu, Diao and Nishi4 and the selective binding of metal ions. Reference Saenger1–Reference Liu, Diao and Nishi4 Therefore, double-stranded DNA has been used as a functional material, such as the accumulations of harmful compounds, Reference Yamada, Kato, Shindo, Nomizu, Haruki, Sakairi, Ohkawa, Yamamoto and Nishi5,Reference Yamada, Kato, Nomizu, Ohkawa, Yamamoto and Nishi6 electric devices, Reference Okahata, Kobayashi, Tanaka and Shimomura7,Reference Nakayama, Ohno and Okahata8 optical materials, Reference Wang, Yoshida, Ogata, Sasaki and Kajiyama9–Reference Long, Zou, Li and Chen11 ion conducting materials, Reference Yamada and Goto12,Reference Lee, Won and Hwang13 bio- and medical materials, Reference Yamada, Hara, Yamada, Katagiri, Hozumi and Nomizu14,Reference Goukassian, Helms, Steeg, Oostrom, Bhawan and Gilchrest15 nanomaterials, Reference Seeman16–Reference Maeda, Zinchenko, Lopatina, Sergeyev and Murata19 and environmental materials. Reference Liu, Yamada, Matsunaga and Nishi3,Reference Liu, Diao and Nishi4,Reference Okahata, Kobayashi, Tanaka and Shimomura7,Reference Nakayama, Ohno and Okahata8 Recently, we reported the preparation of the DNA–inorganic hybrid film Reference Yamada and Aono20 and DNA-immobilized glass beads Reference Yamada and Hamai21 by mixing the double-stranded DNA and silane coupling reagents. These DNA materials could selectively accumulate harmful compounds, such as dioxin derivatives, polychlorinated biphenyl derivatives, benzo[a]pyrene, and heavy metal ions. Reference Yamada and Aono20–Reference Yamada and Abe22 Additionally, these harmful compound-accumulated DNA materials could be reused by washing with ethanol or chelating reagents. However, it is difficult to collect these DNA materials, such as the DNA–inorganic hybrid film and DNA-immobilized glass beads, from an aqueous solution. Therefore, for utilization of the DNA as an environmental material, the development of effective and simple collection methods of DNA material from an aqueous solution is very important.
Metal oxide particles have many functions, such as optical properties, Reference Smolensky, Peterson, Weitz, Lewandowski and Pierre23,Reference Wang, Zhuang, Peng and Li24 catalytic activities, Reference Arai, Sato, Kanoh, Kaneko, Oguma and Yanagisawa25 antimicrobial activities, Reference Nguyen, Ishihara, Kinoda, Hattori, Nakamura, Ono, Miyahira and Matsui26 and the absorption properties. Reference Li, Bi, Liu, Dong and Wang27 Therefore, the metal oxide particles have been used as engineering materials, catalysts, absorbents, and biomedical materials. Reference Gai, Li, Yang and Lin28 Additionally, composite materials consisting of a polymer and metal oxide particles have been reported as novel functional materials with the characteristic of metal oxide particles. Reference Yu, Zhang and Huang29–Reference Willard, Kurihara, Carpenter, Calvin and Harris32 In this study, we were interested in the iron(II) diiron(III) oxide (Fe3O4) particles, which are metal oxide particles. Since Fe3O4 is a paramagnetic material, Reference Cotton, Wilkinson and Gauss33 the composite material consisting of double-stranded DNA and Fe3O4 particles can be simply collected by a magnet from an aqueous solution. Reference Smolensky, Peterson, Weitz, Lewandowski and Pierre23 Therefore, we demonstrated the accumulation of heavy and rare-earth metal ions by the DNA–Fe3O4 composite material and proposed the collection of metal ion-accumulated composite materials by a magnet. The utilization of the double-stranded DNA-immobilized Fe3O4 particles as an environmental material has not been reported to the best of our knowledge.
In this study, we prepared the DNA-immobilized Fe3O4 particles (DNA–Fe-particles) by mixing the double-stranded DNA, magnetic Fe3O4 particles, and the silane coupling reagent, bis[3-(trimethoxysilyl)propyl]amine (SiNSi). These DNA–Fe-particles were stable in water and could be collected from an aqueous solution by a magnet. Additionally, the DNA–Fe-particles could selectively accumulate heavy and rare-earth metal ions. Furthermore, the metal ion-accumulated DNA–Fe-particles could be recycled by washing them with an aqueous ethylenediaminetetraacetic acid (EDTA) solution.
II. EXPERIMENTAL SECTION
A. Material
Double-stranded DNA (sodium salt from a salmon milt, molecular weight > 5 × 10⁶) was obtained from Biochem Ltd., Kawagoe, Japan. The silane coupling reagent, SiNSi, was purchased from Tokyo Kasei Industries Ltd., Tokyo, Japan. Scheme 1(a) shows the molecular structure of SiNSi. Iron(III) chloride hexahydrate, anhydrous sodium acetate, glycol, and iron(II) diiron(III) oxide powder was obtained from Wako Pure Chemical Industries, Ltd., Osaka, Japan. Copper(II) chloride, zinc(II) chloride, cadmium(II) chloride, yttrium(III) chloride, terbium(III) chloride, indium(III) chloride, calcium chloride, magnesium chloride, xylenol orange (XO), 4-(2-pyridylazo)resorcinol (PAR), methylthymol blue (MTB), and ethylenediamine-N,N,N′,N′-tetraacetic acid disodium salt dihydrate (EDTA) were obtained from Wako Pure Chemical Industries Ltd., Kanto Chemical Co., Inc., Tokyo, Japan, or Dojindo Co., Kumamoto, Japan. Analytical grade solvents were used in all of the experiments described. Ultra-pure water (Merck KGaA, Darmstadt, Germany) was used in this experiment.
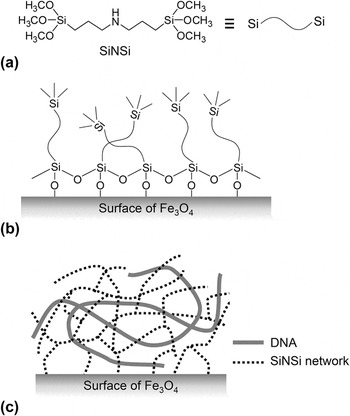
(a) Molecular structure of bis(trimethoxysilylpropyl)amine (SiNSi) (left). Schematic diagram of SiNSi molecule (right). (b) Condensation reaction of SiNSi on the surface of Fe3O4 particle. (c) Structural model of DNA–Fe-particles. The solid line and dotted line showed the double-stranded DNA and the three-dimensional network of SiNSi, respectively.

B. Preparation of DNA-immobilized Fe3O4 particles
Fe3O4 particles were prepared as follows Reference Yu, Zhang and Huang29 : 2.7 g of iron(III) chloride hexahydrate was added to 80 mL of glycol and magnetically stirred. After the addition of 7.2 g of anhydrous sodium acetate, the mixed solution was transferred to a perfluorinated autoclave and heated at 200 °C for 16 h. The products were separated using a neodymium magnet (500 mT, ϕ 30 mm × t 15 mm) and washed with ultrapure water (50 mL × 5 times) and ethanol (10 mL × 5 times). The products were dried at 50 °C under vacuum for 24 h and obtained the Fe3O4 particles (0.79 g, 25%).
DNA–Fe-particles were prepared as follows: an aqueous DNA solution (10 mg/mL, 500 μL), 200 mg of synthesized Fe3O4 particles, and SiNSi solution (1.5 μL) were added to a microtube and immediately mixed by a vortex mixer. This mixed solution was then freeze-dried overnight. The obtained products were washed with ultrapure water (3 mL × 5 times) to remove the water-soluble DNA and then freeze-dried overnight.
The immobilized amount of DNA on the Fe3O4 particles was determined by the following procedure: the DNA–Fe-particles were hydrolyzed with 0.1 M NaOH at 100 °C for 1 h, then the amount of DNA in an aqueous solution was determined from the absorbance at 260 nm using a Hitachi photodiode array bio-spectrophotometer U-0080D (Hitachi Ltd., Tokyo, Japan).
C. Measurements
The scanning electron microscopy (SEM) images of the synthesized Fe3O4 particles and the DNA–Fe-particles were observed by LEO EM-922 (Carl Zeiss Co., Baden-Württemberg, Oberkochen, Germany) with an acceleration voltage of 5 kV. The size distribution of particles (n = ∼2000) was measured from the SEM image. In the analysis of size distribution, we used Image J 1.49v software (National Institutes of Health, Bethesda, Maryland).
The x-ray diffraction (XRD) power patterns were measured on a Rigaku RAD-2B diffractometer (Rigaku Corporation, Tokyo, Japan) in the Bragg–Brentano geometry arrangement using Cu Kα radiation (λ =1.54 Å) with a graphite monochrometor.
The thermal stabilities of the synthesized Fe3O4 particles, the DNA–Fe-particles, and double-stranded DNA were analyzed by thermogravimetric—differential thermal analysis (TG-DTA) (DTG-60, Shimadzu Corp., Kyoto, Japan). The TG-DTA measurement was carried out at a heating rate of 10 °C/min under a dry-nitrogen flow. Sample weights of TG-DTA measurements were normalized at 1 mg.
The infrared (IR) absorption spectra of synthesized Fe3O4 particles, the DNA–Fe-particles, and double-stranded DNA were measured by the attenuated total reflection (ATR) method with diamond prism using a FT-IR 8400 Fourier transform IR spectrometer (Shimadzu Corp.). The IR spectrum was measured with the resolution of 4 cm−1.
D. Accumulation of metal ions by DNA–Fe-particles
Copper(II) chloride, zinc(II) chloride, cadmium(II) chloride, yttrium(III) chloride, terbium(III) chloride, indium(III) chloride, calcium chloride, and magnesium chloride were dissolved in pure water. The concentrations of the aqueous metal ion solutions were 0–400 ppm. The accumulation of metal ions by the DNA–Fe-particles was demonstrated as follows: 10 mg of the DNA–Fe-particles was added to a metal ion-containing aqueous solution (1 mL), stirred at room temperature by a magnetic stirrer without the stirring bar, then the DNA–Fe-particles were separated from an aqueous solution by a neodymium magnet. The accumulated amount of metal ions by the DNA–Fe-particles was determined by the absorbance of an aqueous solution in the absence or presence of the DNA–Fe-particles. The concentration of the aqueous metal ion solution was estimated from the calibration curve with the metal indicators XO, PAR, and MTB. Reference Yamada and Abe22,Reference Otomo34
The IR samples of metal ion-accumulated DNA–Fe-particles were prepared by the following procedure: the DNA–Fe-particles (100 mg) were incubated in 5 mL of aqueous Cu(II) ion solution with various concentrations (500 or 1000 ppm) for 24 h. These Cu(II) ion-accumulated DNA–Fe-particles were washed by pure water (10 mL × 3 times) and freeze-dried overnight. These samples were analyzed by the ATR method with diamond prism using an IR spectrometer.
E. Reuse of metal ion-accumulated DNA–Fe-particles
The procedure for the reuse of the metal ion-accumulated DNA–Fe-particles was as follows: the Cu(II) or Tb(III) ions-accumulated DNA–Fe-particles were washed with an aqueous EDTA solution (1 mM, 4 mL × 3 times) and ultrapure water (4 mL × 3 times). The separation of the DNA–Fe-particles from the solution was performed by a neodymium magnet. The washed DNA–Fe particles were dried in a vacuum for 3 h and re-added to the metal ion-containing aqueous solution. The concentration of the Cu(II) and Tb(III) ions was 20 ppm. This cycle was repeated five times.
III. RESULTS AND DISCUSSION
A. Preparation of DNA–Fe-particles
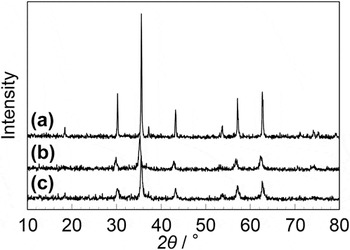
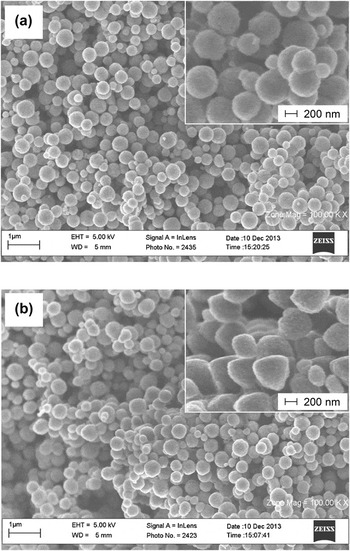
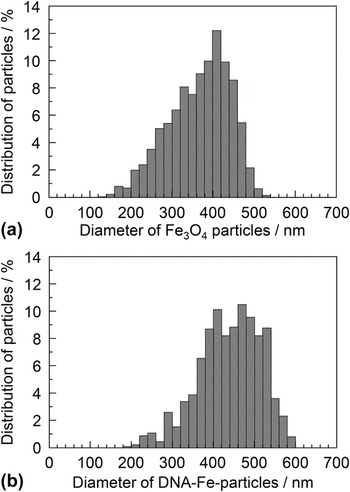
Fe3O4 particles were prepared by the reaction of iron chloride and anhydrous sodium acetate in glycol at 200 °C for 16 h. Reference Yu, Zhang and Huang29 The obtained Fe3O4 particles were washed by ultrapure water and ethanol, and then collected by a magnet. Figures 1(a) and 1(b) show the XRD patterns of the standard iron(II) diiron(III) oxide powder and the synthesized Fe3O4 particles, respectively. In the XRD pattern of the iron(II) diiron(III) oxide, the peaks of (220), (311), (400), (422), (511), and (440) at 30.25, 35.60, 43.25, 53.65, 57.10, and 62.70°, respectively, related to the cubic phase Fe3O4 with a face-centered-cubic (fcc) structure, Reference Yu, Zhang and Huang29 appeared. A similar XRD pattern was obtained for the synthesized Fe3O4 particles. These results suggested that the synthesized product is Fe3O4. Figure 2(a) shows the SEM image of the synthesized Fe3O4 particles. Additionally, Fig. 2(a) insert shows the magnified SEM image. The synthesized Fe3O4 powder showed a spherical form and these spherical forms were uniform. Furthermore, these SEM images were obtained at all of the parts. Figure 3(a) shows the size distribution of synthesized Fe3O4 particles, which was measured from the SEM images. As a result, the diameters of synthesized Fe3O4 particles were 200–500 nm and the average diameter was approximately 380 nm. These particle sizes coincided with the reported material. Reference Yu, Zhang and Huang29
XRD patterns of (a) the standard iron(II) diiron(III) oxide powder, (b) the synthesized Fe3O4 particles, and (c) the DNA–Fe-particles.

SEM images of (a) the synthesized Fe3O4 particles without the immobilization of DNA and (b) the DNA–Fe-particles. The insets show SEM images at higher magnification. These SEM images were obtained at all of the parts.

The size distribution of (a) the synthesized Fe3O4 particles and (b) the DNA–Fe-particles. The diameter of particles (n = ∼ 2000) was measured from SEM images.

The DNA–Fe-particles were prepared by mixing double-stranded DNA, synthesized Fe3O4 particles, and silane coupling reagents SiNSi. Figure 1(c) shows the XRD pattern of the DNA–Fe-particles. The peaks of the XRD pattern coincided with the iron(II) diiron(III) oxide and synthesized Fe3O4 particles, and the structural dislocation of fcc structure by the immobilization of DNA onto the Fe3O4 particles did not occur. Figure 2(b) shows the SEM image of the DNA–Fe-particles. These SEM images were obtained at all of the parts. Additionally, Fig. 2(b) insert shows the magnified SEM image. Although the DNA–Fe-particles showed a spherical form, the particle form was slightly distorted in comparison to the Fe3O4 particles without the immobilization of DNA. Figure 3(b) shows the size distribution of DNA–Fe-particles, which was measured from the SEM images. As a result, the diameters of DNA–Fe-particles were 200–600 nm and the average diameter was approximately 450 nm. The average diameter was larger than that of synthesized Fe3O4 particles without the immobilization of DNA. These phenomena are due to the immobilization of the DNA–SiNSi hybrid material onto the Fe3O4 surface. On the other hand, although we demonstrated the SEM measurements under the wide scale, the aggregation of the DNA–Fe-particles by the immobilization of DNA had not been observed. These results suggested that the DNA–SiNSi hybrid has been uniformly immobilized onto the Fe3O4 particles surface.
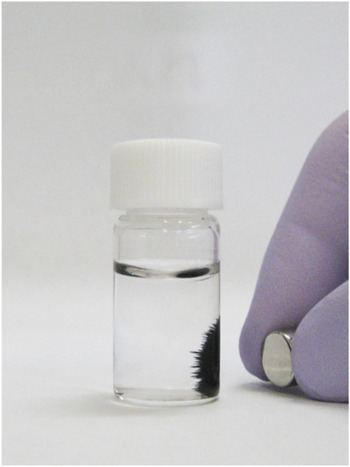
The DNA–Fe-particles were stable in water. Additionally, the DNA–Fe-particles could be simply collected by the neodymium magnet. Figure 4 shows a photograph of the collected DNA–Fe-particles by the magnet. The collection of the DNA–Fe-particles was demonstrated in an aqueous solution. The DNA–Fe-particles-containing solution could be separated into a solid substrate and liquid component by the magnet. On the other hand, since the DNA–SiNSi hybrid material can be dissolved by the hydrolysis with 0.1 M NaOH at 100 °C for 1 h, the amount of immobilized-DNA onto the Fe3O4 particles was estimated from the absorbance at 260 nm. As a result, the amount of the immobilized-DNA onto the Fe3O4 particles was 17.5 mg/g of the Fe3O4 particles. For this procedure, the mixing ratio of DNA and SiNSi was 23 wt%. Therefore, we performed the preparation of DNA–Fe-particles by the different mixing ratios. However, the amount of the immobilized-DNA onto the particles was almost constant (data not shown). These results suggested that the mixing ratio of 23 wt% was the most effective value for the immobilization of DNA onto the Fe3O4 particles. A similar value, such as 23 wt%, has been reported for other DNA–SiNSi hybrid materials. Reference Yamada and Aono20,Reference Yamada and Hamai21
Photograph of the collected DNA–Fe-particles by a neodymium magnet. The collection of the DNA–Fe-particles was demonstrated in an aqueous solution.

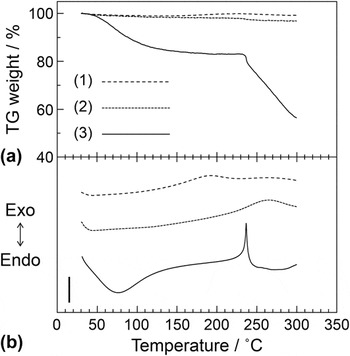
Figures 5(a) and 5(b), respectively, show the TG analysis and DTA curves of (i) synthesized Fe3O4 particles without the immobilization of DNA (ii) DNA–Fe-particles, and (iii) DNA material without composite of inorganic components at the heating rate of 10 °C/min up to 300 °C under a dry-nitrogen flow. The Fe3O4 particles without the immobilization of DNA did not show the endothermic and exothermic peaks at <300 °C. Additionally, the TG weight loss of Fe3O4 particles did not appear at <300 °C. In contrast, the DNA material without composite of inorganic components had a TG weight loss of approximately 15% at 150 °C. This TG weight loss is due to the evaporation of water from the DNA material. The DTA analysis of the DNA material showed an exothermic peak at 229.7 °C due to the pyrolysis of DNA. Similar results, such as thermal decomposition at approximately 200 °C, have been reported from differential scanning calorimetry measurements. Reference Wang, Yoshida, Ogata, Sasaki and Kajiyama9 In DNA–Fe-particles, the exothermic peak at approximately 230 °C, which was related to the pyrolysis of DNA, broadened by the composite with the Fe3O4 particles. The broadening of exothermic peak by the composite with the inorganic components has been reported by other composite materials. Reference Yamada and Aono20 These results suggested that DNA–Fe-particles had been possessed the thermal stability.
TG (a) and DTA (b) curves of (1) synthesized Fe3O4 particles without the immobilization of DNA (2) DNA–Fe-particles, and (3) DNA material without composite of inorganic components materials at the heating rate of 10 °C/min to 300 °C under a dry-nitrogen flow. A scale bar shows 10 μV. Triplicate experiments gave similar results.

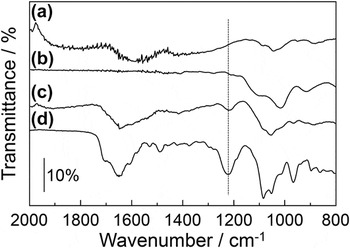
Figures 6(a)–6(d) show the IR spectra of synthesized Fe3O4 particles without the immobilization of DNA, dried SiNSi material, DNA–Fe-particles, and DNA material without composite of inorganic components, respectively. In the spectra of DNA material, the absorption bands at 1300–1700 cm−1, attributed to the stretching vibration of the nucleic acid base, Reference Yamada and Aono20,Reference Yamada and Abe22,Reference Tajmir-Riahi, Naoui and Ahimad35,Reference Banyay and Sarkaräslund36 appeared. The similar absorption band was obtained at the spectrum of DNA–Fe-particles. Additionally, in the spectrum of DNA material, the absorption band at 1222 cm−1, related to the antisymmetric vibration of the phosphate group of DNA, Reference Yamada and Aono20,Reference Yamada and Abe22,Reference Tajmir-Riahi, Naoui and Ahimad35,Reference Banyay and Sarkaräslund36 appeared. This absorption band was shifted to a lower wavenumber, approximately 10 cm−1, by hybridization with SiNSi. This phenomenon is due to the hybridization by the electrostatic interaction through the phosphate group. In fact, the similar phenomena, such as the shift to a lower wavenumber of phosphate group by the electrostatic interaction, have been reported at various hybrid materials with the electrostatic interaction. Reference Yamada and Goto12,Reference Yamada, Hara, Yamada, Katagiri, Hozumi and Nomizu14,Reference Yamada and Aono20 In contrast, the dried SiNSi material showed the absorption band at 1000–1200 cm−1, Reference Yamada and Aono20,Reference Plueddemann37,Reference Vince, Orel, Vilčnik, Fir, Vuk, Jovanovski and Simončič38 related to the stretching vibration of the Si–O–Si group. The similar absorption band appeared in DNA–Fe-particles. These results suggested that the silane coupling reagent SiNSi formed the three-dimensional network consisting of siloxane, such as Si–O–Si, through the sol–gel reaction. Similar results have been reported for various organic–inorganic hybrid materials with the silane coupling reagents. Reference Yamada and Aono20,Reference Vince, Orel, Vilčnik, Fir, Vuk, Jovanovski and Simončič38
IR spectra of (a) Fe3O4 particles without the immobilization of DNA, (b) dried SiNSi material, (c) DNA–Fe-particles, and (d) DNA material without composite of inorganic components. The IR spectrum was measured at the resolution of 4 cm−1. Triplicate experiments gave similar results. The scale bars indicate the value of transmittance.

Generally, the methoxysilyl group in SiNSi molecule hydrolyzes in water and produces the silanol group. These silanol groups condense by the dehydration reaction and ultimately form the siloxane with the Si–O–Si group. In addition, since the surface of metal oxide in water was covered with hydroxyl group, these condensations with the dehydration reaction occur not only between silanol groups but also between silanol group and the surface of metal oxide. Reference Ulman39 Therefore, the formation mechanism of DNA–Fe-particles is proposed as follow: the trimethoxysilyl group of the SiNSi molecules hydrolyzed and formed the network of the Si–O–Si group by polymerization. Simultaneously, the condensation reaction occurred at Fe–OH group of Fe3O4 surface and produced the Fe–O–Si [see Scheme 1(b)]. As a result, the three-dimensional network of SiNSi was formed onto Fe3O4 surface. Additionally, the three-dimensional network of SiNSi encapsulated the double-stranded DNA into its network [see Scheme 1(c)]. Reference Yamada and Aono20 Furthermore, the DNA in hybrid material was stabilized by the electrostatic interaction between the phosphate groups of DNA and the imino groups of SiNSi molecules. Therefore, the DNA–SiNSi hybrid was immobilized onto the surface of Fe3O4 particles and these DNA–Fe-particles showed the water-insoluble and the thermal stable properties.
B. Accumulation of metal ions by the DNA–Fe-particles
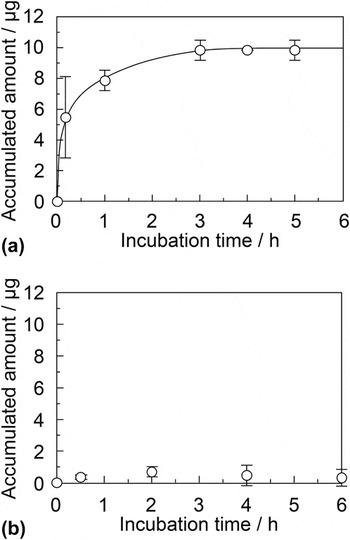
Double-stranded DNA specially interacts with various metal ions in an aqueous solution. Reference Saenger1–Reference Liu, Diao and Nishi4,Reference Yamada and Abe22 Therefore, we demonstrated the accumulation of various metal ions from an aqueous solution by the DNA–Fe-particles. The metal ion-accumulated DNA–Fe-particles were separated from an aqueous solution by the neodymium magnet. Figures 7(a) and 7(b) show the accumulation of Cu(II) and Mg(II) ions at various incubation times by the DNA–Fe-particles, respectively. In these experiments, the concentration of the Cu(II) and Mg(II) ions was 50 ppm and the amount of DNA–Fe-particles was 10 mg. The concentration of the aqueous metal ion solution was estimated from the calibration curve with the metal indicator. The accumulated amount of the Cu(II) ions increased with the incubation time and reached a constant value at 3 h. The accumulated amount of the Cu(II) ions was approximately 10 μg. Therefore, we demonstrated the accumulation of other metal ions for the incubation time of 3 h. In contrast, the accumulated amount of Mg(II) did not show the increase with the incubation time and the DNA–Fe-particles could not accumulate the Mg(II) ions. A similar behavior was obtained regarding accumulation of Ca(II) ions. These results suggested that the DNA–Fe-particles have a different affinity to the other kinds of metal ions.
Accumulation of (a) Cu(II) and (b) Mg(II) ions by DNA–Fe-particles for various incubation times. The concentration of the Cu(II) and Mg(II) ions was 50 ppm. The amount of the DNA–Fe-particles was 10 mg. Each of the values represents the mean of three or five separate determinations. The error bars indicate the standard deviations.

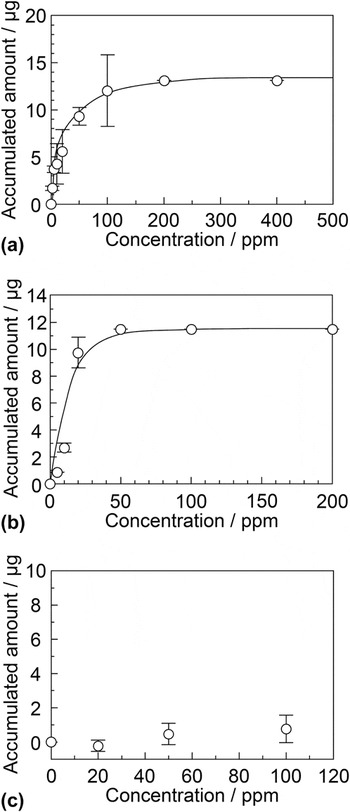
Figures 8(a)–8(c) show the accumulation of Cu(II), In(III), and Mg(II) ions at various concentrations by the DNA–Fe-particles, respectively. The accumulated amount of the Cu(II) ions increased with the initial concentration and reached a constant value at approximately 200 ppm. The accumulated amount was 13.1 μg. Therefore, we defined the constant value as the maximum-accumulated amount of the metal ions. Similar results were obtained for the accumulation of the Zn(II) and Cd(II) ions, such as heavy metal ions. The maximum-accumulated amounts of the Zn(II) and Cd(II) ions were 4.10 and 8.54 μg, respectively. The In(III) ion, one of the rare-earth metal ions, was accumulated by the DNA–Fe-particles and the maximum-accumulated amount of the In(III) ion was 11.5 μg [see Fig. 8(b)]. Similar results were obtained for the accumulation of the Y(III) and Tb(III) ions, such as rare-earth metal ions. The accumulated amounts of the Y(III) and Tb(III) ions were 6.37 μg and 8.30 μg, respectively. On the other hand, the DNA–Fe-particles did not show the accumulation of Mg(II) ions [see Fig. 8(c)]. Similar results were obtained for the accumulation of Ca(II) ions (data not shown). The selective accumulation of metal ions, such as heavy and rare-earth metal ions, has been reported by DNA–inorganic hybrid materials. Reference Yamada and Abe22 These results suggested that the DNA–Fe-particles selectively accumulate the heavy and rare-earth metal ions from an aqueous solution and the metal ion-accumulated particles could simply collect from an aqueous solution by the magnet. On the other hand, synthesized Fe3O4 particles without the immobilization of the DNA–SiNSi hybrid material did not show any measurable accumulation of metal ions.
Accumulation of (a) Cu(II), (b) In(III), and (c) Mg(II) ions by the DNA–Fe-particles at various concentrations. The incubation time was 3 h. We defined the constant value as the maximum-accumulated amount of the metal ions. Each of the values represents the mean of three or five separate determinations. The error bars indicate the standard deviations.

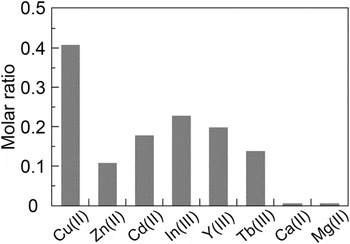
Figure 9 shows the molar ratios of the nucleotide and the accumulated metal ions for the maximum-accumulated amounts. The moles of the accumulated metal ions were estimated from the maximum-accumulated amount of each metal ion. For the accumulation of the heavy and rare-earth metal ions, although the Cu(II) ion showed the highest value of approximately 0.4, the other metal ions, such as the Zn(II), Cd(II), In(III), Y(III), and Tb(III) ions, were 0.1–0.2 and showed almost constant values regardless of the kinds of metal ions. In contrast, the DNA–Fe-particles could not accumulate the light metal ions, such as the Ca(II) and Mg(II) ions. Therefore, we estimated the binding affinity between the DNA–Fe-particles and metal ions from the molar ratios. The binding affinities were Cu(II) ≫ In(III), Y(III), Cd(II) > Tb(III), Zn(II) ≫ Ca(II), Mg(II). For other DNA materials, such as DNA–inorganic hybrid material, Reference Yamada and Abe22 the molar ratio of the nucleotide and accumulated metal ion was approximately 0.5 and these values were constant regardless of the kinds of metal ions. Therefore, the binding affinities with the metal ions by the DNA–Fe-particles were different from the reported results.
Molar ratios of nucleotide and accumulated metal ions. The moles of the accumulated metal ions were estimated from the maximum-accumulated amount. Each of the values represents the mean of three or five separate determinations.

C. IR measurements of metal ion-accumulated DNA–Fe particles
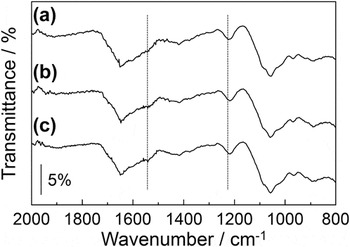
Generally, since the metal ions interact with the nucleic acid bases and the phosphate group in DNA, Reference Lippard and Berg40–Reference Scharf and Müller43 the DNA materials can accumulate the metal ions in their structures. Especially, the DNA materials indicate the metal ion selectivity for heavy and rare earth metal ions. Therefore, we demonstrated the IR measurements of metal ion-accumulated DNA–Fe-particles. Figures 10(a)–10(c) shows the IR spectra of DNA–Fe-particles, Cu(II) ion-accumulated DNA–Fe-particles with the incubation at 500 ppm, and Cu(II) ion-accumulated DNA–Fe-particles with the incubation at 1000 ppm, respectively. The DNA–Fe-particles had an absorption band at 1213 cm−1, Reference Yamada and Aono20,Reference Yamada and Abe22,Reference Tajmir-Riahi, Naoui and Ahimad35,Reference Banyay and Sarkaräslund36 related to the antisymmetric vibration of the phosphate group of DNA. This absorption band shifted to a lower wavenumber, approximately 10 cm−1, by the accumulation of Cu(II) ion [see spectra (b) and (c) in Fig. 10]. In addition, the absorption band at 1530 cm−1, related to the stretching vibration of C=N of guanine base, Reference Yamada and Aono20,Reference Yamada and Abe22,Reference Tajmir-Riahi, Naoui and Ahimad35,Reference Banyay and Sarkaräslund36 increased and broadened when the DNA–Fe-particles accumulated the Cu(II) ion [see spectra (b) and (c) in Fig. 10]. These results suggested that the metal ion interacts with not only the phosphate group of DNA but also the C=N of nucleic acid base and is accumulated by DNA–Fe-particles. Similar phenomena, such as the binding of metal ion to the phosphate group and nucleic acid base, have been reported for other DNA materials, such as UV-irradiated DNA film and DNA–inorganic hybrid material. Reference Yamada and Abe22 On the other hand, the amount of accumulative metal ion of the DNA–Fe-particles was lower than that of other DNA material, such as DNA–inorganic hybrid material. Reference Yamada and Abe22 These phenomena are due to the distortion of the double-stranded DNA structure by the immobilization onto the Fe3O4 particles.
IR spectra of (a) DNA–Fe-particles, (b) Cu(II) ion-accumulated DNA–Fe-particles with the incubation at 500 ppm, and (c) Cu(II) ion-accumulated DNA–Fe-particles with the incubation at 1000 ppm. The IR spectrum was measured at the resolution of 4 cm−1. Triplicate experiments gave similar results. The scale bars indicate the value of transmittance.

D. Reuse of metal ion-accumulated DNA–Fe-particles
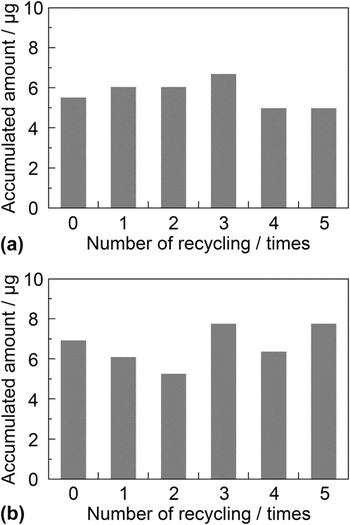
The DNA–Fe-particles showed the characteristic of the selective accumulation of the heavy and rare-earth metal ions. Therefore, we demonstrated the reuse of the metal ion-accumulated DNA–Fe-particles by washing using an aqueous EDTA solution. EDTA is one of the most famous chelating reagents of metal ions. Reference Lippard and Berg40,Reference Lo and Yang44 Additionally, since EDTA, which has a high binding constant, strongly interacts with the metal ions, Reference Lo and Yang44 the EDTA can extract the metal ions from the metal ion-accumulated DNA–Fe-particles. Figures 11(a) and 11(b) show the reuse of the Cu(II) and Tb(III) ion-accumulated DNA–Fe-particles by washing using an aqueous 1 mM EDTA solution, respectively. This cycle was repeated five times. Before the recycling, the DNA–Fe-particles accumulated approximately 5 μg of the Cu(II) ions [see Fig. 11(a)]. After the five recycling, the accumulated amount of Cu(II) ions was approximately 5 μg and did not appear to decrease. Similar results were obtained for the reuse of Tb(III)-accumulated DNA–Fe-particles and the accumulated amount of Tb(III) ion was approximately 7 μg. In contrast, we demonstrated the reuse by washing using 1M hydrochloric acid as a substitution for the EDTA. In this case, the accumulated amount of metal ions did not show a constant value during the recycling process. This is due to the hydrolysis of DNA and the dissolution of the Fe3O4 particles under the acidic conditions. These results suggested that the metal ion-accumulated DNA–Fe-particles can be effectively reused by washing of an aqueous EDTA solution.
Reuse of DNA–Fe-particles with accumulated (a) Cu(II) and (b) Tb(III) ions. The concentration of Cu(II) and Tb(III) ions was 20 ppm. The metal ion-accumulated DNA–Fe-particles were recycled by washing with 1 mM EDTA solution and water. This cycle was repeated five times.

IV. CONCLUSION
We prepared the DNA-immobilized Fe3O4 particles (DNA–Fe-particles) by mixing with double-stranded DNA, magnetic Fe3O4 particles, and SiNSi. The DNA–SiNSi hybrid material was uniformly immobilized onto the magnetic Fe3O4 particles with the average diameters of approximately 450 nm. The DNA–Fe-particles were stable in water and could be simply collected from an aqueous solution by a magnet. Additionally, the DNA–Fe-particles could selectively accumulate heavy and rare-earth metal ions, such as Cu(II), Cd(II), and In(III) ions, from a metal ion-containing aqueous solution. Furthermore, the DNA–Fe-particles could be recycled by washing them using an aqueous EDTA solution. The DNA–Fe-particles may have potential use for biomedical application, such as the removal of harmful heavy metal ion in human body, and environmental applications, such as the accumulation of rare-earth metals from industrial waste.
ACKNOWLEDGMENTS
This work was supported by JSPS KAKENHI Grant No. 25410195 and the matching fund subsidy for private universities from MEXT.