Introduction
Solid matter is a three-dimensional (3D) agglomeration of atoms. The properties of materials are determined by the positions of the atoms, their chemical nature, and the bonding between them. If one is able to determine these parameters in 3D, it becomes possible to provide the necessary input into calculations for predicting the physicochemical properties of these atomic agglomerates. Moreover, this will guide the synthesis and development of new nanomaterials.
The development of aberration-corrected transmission electron microscopes has enabled structural investigation of nanostructures with resolution on the order of 50 pm.Reference Haider, Rose, Uhlemann, Schwan, Kabius and Urban1–Reference Erni, Rossell, Kisielowski and Dahmen4 However, transmission electron microscopy (TEM) images are only two-dimensional (2D) projections of 3D (nano) objects. Electron tomography has therefore been developed as a powerful tool to investigate the morphology, 3D structure, and composition of a broad range of materials, many examples of which are presented elsewhere in this issue.Reference Midgley and Dunin-Borkowski5,Reference Midgley and Weyland6
Most tomography results have been achieved at the nanometer level, but open questions in materials science demanded further development of the technique and have pushed the resolution to the atomic scale. For example, it is known that the surface morphology of Au nanocrystals mainly determines their catalytic and optical properties.Reference Grzelczak, Perez-Juste, Mulvaney and Liz-Marzan7,Reference Valden, Lai and Goodman8 Although the morphology can be characterized using conventional electron tomography with a resolution around a few nanometers or below, it is impossible to precisely determine the exact type of surface planes from such reconstructions. In addition to the morphology, the crystal structure, including defects and (surface) strain, is equally essential, since it will directly affect plasmonic or catalytic properties.Reference Goubet, Yan, Polli, Portales, Arfaoui, Cerullo and Pileni9,Reference Louis and Pluchery10 Being able to perform electron tomography with atomic resolution is therefore crucial. Although this is not yet a standard possibility for all structures, significant progress for samples that are relatively stable under the electron beam has recently been achieved using different approaches, which will be further explained in this article.
Visualizing atoms in 3D electron tomography
First reports in which the 3D atomic structure of a nanoparticle was visualized were based on a single 2D projection image. Li et al. were able to extract a thickness profile and proposed a 3D modelReference Li, Young, Di Vece, Palomba, Palmer, Bleloch, Curley, Johnston, Jiang and Yuan11 through quantitative analysis of the projected intensities in atomically resolved high-angle annular dark field (HAADF) scanning transmission electron microscopy (STEM) images, acquired from an isolated Au nanocluster. However, it is likely there are different 3D models matching a specific 2D image.
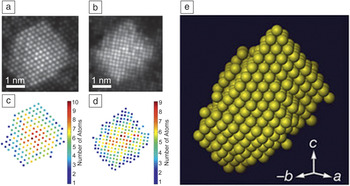
In 2011, a breakthrough occurred when Van Aert and co-workers obtained a unique 3D reconstruction at the atomic scale for a 3 nm Ag nanoparticle embedded in an Al matrix.Reference Van Aert, Batenburg, Rossell, Erni and Van Tendeloo12 The reconstruction was based on two HAADF-STEM images acquired along different zone axes. As illustrated in Figure 1, these images (Figure 1a–b) were translated into counting results (number of atoms in each atomic column) using statistical parameter estimation theory (Figure 1c–d). Discrete tomography was then used to combine the images into a 3D reconstruction with atomic resolution (Figure 1e).Reference Jinschek, Batenburg, Calderon, Kilaas, Radmilovic and Kisielowski13 This approach was proposed earlier as an efficient strategy based on simulated electron micrographs.Reference Jinschek, Batenburg, Calderon, Kilaas, Radmilovic and Kisielowski13 It was assumed that all of the atoms were positioned on a face-centered-cubic grid without the presence of vacancies. An excellent match was found when comparing the 3D reconstruction with projection images that were acquired along additional zone axes, thereby confirming the quality of the reconstruction.
(a–b) Refined models for two high-angle annular dark-field-scanning transmission electron microscope projection images of a nano-sized Ag cluster embedded in an Al matrix. (c–d) Number of Ag atoms per projected atomic column for both images. (e) 3D reconstruction of the Ag nanoparticle, based on discrete tomography.Reference Van Aert, Batenburg, Rossell, Erni and Van Tendeloo12

The assumptions for the discrete reconstruction provide an excellent start to investigate different nanomaterials.Reference Batenburg, Bals, Sijbers, Kubel, Midgley, Hernandez, Kaiser, Encina, Coronado and Van Tendeloo14,Reference Bals, Casavola, van Huis, Van Aert, Batenburg, Van Tendeloo and Vanmaekelbergh15 However, deviations from a fixed grid, which is assumed for the reconstruction, may occur because of defects, strain, or lattice relaxation. Such deviations are of great importance as they determine the physical properties of nanomaterials. One may therefore wonder if continuous tomography can lead to visualization of individual atoms in the case where the projection images yield atomic resolution.
Sadan and co-workers made the first attempts to visualize atoms using continuous tomography in their investigation of fullerene-like MoS2 nanostructures with subnanometer spatial resolution (0.3*0.6*0.6) nm3.Reference Bar Sadan, Houben, Wolf, Enyashin, Seifert, Tenne and Urban16 In this work, a tilt series was recorded with a tilt range of ±60° at fixed 3° increments. The series was acquired in bright-field TEM mode using a microscope aligned at negative spherical aberration (C s) imaging conditions. The tomographic reconstruction, which was obtained for MoS2 octahedral nanoparticles, could be interpreted in terms of the atomic structure.
Scott et al. recently reported a 3D reconstruction of a 10-nm Au nanoparticle at a resolution of 0.24 nm, based on equally sloped tomography.Reference Scott, Chen, Mecklenburg, Zhu, Xu, Ercius, Dahmen, Regan and Miao17 The main difference compared to conventional electron tomography is that the tilt series in this case is not acquired with constant tilt angle increments between two successive projection images, but rather, with a constant increment of the slope. The approach enables the use of a pseudo-polar Fourier transform that renders a pseudo-polar grid in Fourier space to a Cartesian grid in real space without the need for interpolation.Reference Miao, Forster and Levi18 Although not all atoms in the multiply twinned Au nanoparticle could be located in the reconstruction, individual atoms could be observed in some parts of the nanoparticle. Equally sloped electron tomography does not assume any prior knowledge, but a relatively large number of images (69) are required to obtain high-quality results. The technique was also applied to Pt nanoparticles showing dislocations in the final reconstruction.Reference Chen, Zhu, White, Chiu, Scott, Regan, Marks, Huang and Miao19
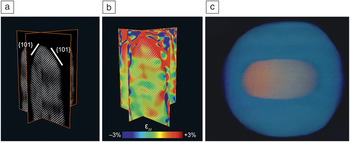
Goris et al.Reference Goris, Bals, Van den Broek, Carbo-Argibay, Gomez-Grana, Liz-Marzan and Van Tendeloo20 proposed an alternative approach to determine the atom positions using a limited number of projection images based on compressive sensing, which is an image-processing technique that enables the exploitation of prior knowledge about the sparsity of the object during the reconstruction. No prior knowledge concerning the crystal lattice is needed, but it was assumed that the reconstruction is sparse at the atomic level. For high-resolution electron tomography, only a limited number of voxels in the reconstruction are expected to contain an atomic core, and most voxels will correspond to vacuum. An important benefit is that because of the incorporation of sparsity during the reconstruction, a limited number of projections are sufficient to create a reliable reconstruction of the atomic lattice.Reference Goris, Bals, Van den Broek, Carbo-Argibay, Gomez-Grana, Liz-Marzan and Van Tendeloo20 This methodology was applied to a study of Au nanorods, and the surface facets of these particles could be precisely determined, as illustrated in Figure 2a. It must be noted that only four high-resolution HAADF-STEM images were used as input.
(a) Slices through a 3D reconstruction of an Au nanorod showing the atomic lattice. (b) Corresponding slices through the strain field along the major axis of the nanorod, indicating an outward relaxation at the tip of the nanorod. (c) 3D visualization of a core–shell Au@Ag nanorod, where the Au core is rendered orange, and the Ag atoms are visualized in blue.Reference Goris, Bals, Van den Broek, Carbo-Argibay, Gomez-Grana, Liz-Marzan and Van Tendeloo20,Reference Goris, De Backer, Van Aert, Gomez-Grana, Liz-Marzan, Van Tendeloo and Bals22

One of the major advantages of equally sloped tomography and this approach is that atoms are not fixed on a specific grid during the reconstruction. Therefore, small deviations from a perfect crystal lattice can be detected and measured. Figure 2b shows the ɛzz strain field along the major axis of the nanorod, obtained by applying geometrical phase analysis to the 3D reconstruction.Reference Hytch, Snoeck and Kilaas21 The geometrical phase analysis selects different reflections in the Fourier transform to investigate the relationship between the phase of these reflections and displacements in the atomic lattice. The same reconstruction approach was used to combine five HAADF-STEM images into a 3D reconstruction of core–shell bimetallic Au@Ag nanorods (Figure 2c).Reference Goris, De Backer, Van Aert, Gomez-Grana, Liz-Marzan, Van Tendeloo and Bals22 Due to the Z 2-dependence of the intensities (where Z is the atomic number) in the individual HAADF-STEM projection images, a careful analysis of the intensities in the 3D reconstruction enabled distinguishing between Ag and Au atoms. Thus, the atomic structure at the interface between the core and the shell could be determined. Recently, Z-contrast in tomographic reconstructions was also used to identify Au- and Ag-rich regions in bimetallic Au-Ag nanoclusters.Reference Haberfehlner, Thaler, Knez, Volk, Hofer, Ernst and Kothleitner23
Measuring atom positions and strain fields in 3D
Although many studies have demonstrated the ability to visualize atoms in 3D using electron tomography, the number of investigations in which atom positions were measured is unfortunately still limited. If the coordinates of every atom in a nanostructure could be extracted, the data can be used as realistic input for ab initio calculations. In addition to the many technical challenges of acquisition and reconstruction, one of the main problems is that 3D reconstructions at the atomic scale often correspond to a continuous 3D volume of intensity values, hampering the extraction of the exact coordinates of the atoms inside the nanoparticle. In a recent study, dedicated post-processing algorithms were applied to a 3D reconstruction obtained by equally sloped tomography.Reference Xu, Chen, Wu, Scott, Theis, Ophus, Bartels, Yang, Ramezani-Dakhel, Sawaya, Heinz, Marks, Ercius and Miao24 The 3D positions of the atoms in a needle-shaped tungsten specimen could be extracted such that the strain field could be investigated.
Being able to measure lattice strain in 3D has been an important goal in the field of (high-resolution) electron microscopy. A well-known example of strained nanoparticles are nanodecahedra or pentagonal bipyramids. Such particles consist of five segments bound by {111} twin boundaries, yielding a crystallographically forbidden morphology. Therefore, measuring strain fields in nanodecahedra by TEM has been the topic of several studies in recent years.
Johnson and co-workers combined atomic resolution TEM and geometrical phase analysis to investigate the strain distribution in an Au decahedron with a diameter of 17 nm.Reference Johnson, Snoeck, Ezcurdia, Rodriguez-Gonzalez, Pastoriza-Santos, Liz-Marzan and Hytch25 Large strain fields are expected in such nanoparticles because of its fivefold symmetry. Their results were supported by finite element calculations and revealed a combination of internal lattice rotation and small shear strains inside each segment of the nanoparticle. Although many studies provide a good start toward the understanding of the strain distribution inside Au decahedrons,Reference Johnson, Snoeck, Ezcurdia, Rodriguez-Gonzalez, Pastoriza-Santos, Liz-Marzan and Hytch25,Reference Walsh, Yoshida, Kuwabara, Pay, Gai and Boyes26 it is important to note that the results are based on a single 2D projection, hereby neglecting the 3D nature of the lattice strain.
Goris et al. conducted a study to compare strain investigations using 2D projection images with 3D measurements based on high-resolution electron tomography reconstructions.Reference Goris, De Beenhouwer, De Backer, Zanaga, Batenburg, Sanchez-Iglesias, Liz-Marzan, Van Aert, Bals, Sijbers and Van Tendeloo27 They found an outward relaxation of the crystal lattice that could not be observed from a single 2D projection image.
A continuous tilt series of 2D projection images was acquired in HAADF-STEM mode, and a dedicated alignment procedure was applied. During conventional alignment, the angles at which the images in the tilt series are acquired are mostly fixed according to their nominal values. Here, the angles were estimated during the reconstruction in an iterative manner by calculating intermediate reconstructions.
As previously discussed, the outcome of a 3D reconstruction at the atomic scale is often a continuous 3D volume of intensity values, from which the center of each atom can only be determined by additional analysis after the reconstruction. It is therefore often difficult to obtain atom coordinates because of the size of the data set and the lack of objective and automatic segmentation procedures. We could overcome this limitation by assuming that the 3D atomic potential can be modeled by 3D Gaussian functions. This assumption significantly simplifies the reconstruction problem, yielding the coordinates of the individual atoms as a direct outcome of the reconstruction. A similar approach was recently used to determine the positions of more than 10,000 spherical nanoparticles in a nanoassembly.Reference Zanaga, Bleichrodt, Altantzis, Winckelmans, Palenstijn, Sijbers, de Nijs, van Huis, Sanchez-Iglesias, Liz-Marzan, van Blaaderen, Batenburg, Bals and Van Tendeloo28 The assembly was considered as a set of perfect spheres. The use of shape models can therefore be considered as a powerful solution to many problems in the field of electron tomography.
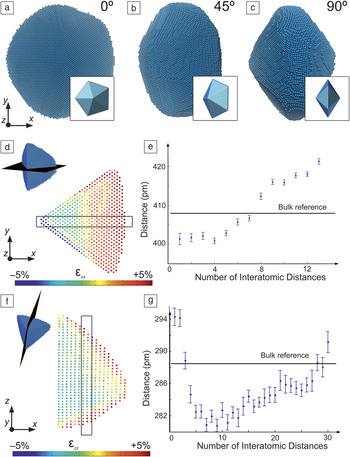
The approach was applied to an Au nanodecahedron containing more than 90,000 atoms, and visualizations of the final 3D reconstruction obtained for an Au nanodecahedron containing more than 90,000 atoms are presented in Figure 3a–c along different viewing directions.Reference Goris, De Beenhouwer, De Backer, Zanaga, Batenburg, Sanchez-Iglesias, Liz-Marzan, Van Aert, Bals, Sijbers and Van Tendeloo27 The insets display the 3D model of the morphology. Since the coordinates of the atoms are a direct outcome of the reconstruction technique, it becomes straightforward to calculate the 3D displacement map. The displacements were calculated with respect to a reference region in the middle of the segment. The derivatives of the displacement map were computed such that 3D volumes were obtained corresponding to εxx and εzz, components of the strain field.Reference Galindo, Kret, Sanchez, Laval, Yanez, Pizarro, Guerrero, Ben and Molina29 Slices through the resulting εxx and εzz volumes were acquired through the middle of the segment and the results are presented in Figure 3d,f. Furthermore, the variation of the lattice parameters was investigated along x and z based on the same slices (Figure 3e,g). Both along the x and z direction, a systematic outward expansion of the lattice can be observed. The expansion along z is limited to a few of the outer atomic layers and shows an asymmetry (Figure 3f–g) that is likely to be related to the fact that the decahedron is deposited on a carbon support.
(a–c) 3D visualizations of the reconstruction showing the atomic lattice of an Au nanodecahedron rotated over 0°, 45°, and 90° around the y-axis. The insets display the 3D model of the morphology. (d,f) ɛxx and ɛzz strain field showing surface relaxation in both directions. The color scale indicates the expansion of the lattice parameter with respect to a reference. (e,g) This surface relaxation was confirmed by measuring the lattice parameter on slices through the reconstructions at the positions indicated in (d) and (f).Reference Goris, De Beenhouwer, De Backer, Zanaga, Batenburg, Sanchez-Iglesias, Liz-Marzan, Van Aert, Bals, Sijbers and Van Tendeloo27

3D information from single-projection images
As previously discussed, the first attempts to obtain 3D reconstructions using electron tomography at the atomic scale were based on single 2D projection images. The ever-increasing complexity in composition of novel nanostructures is often accompanied by an increasing sensitivity toward the electron beam. Therefore, it is far from straightforward to acquire a large number of TEM images, since samples tend to degrade. Also, for small clusters (<5 nm), it is nearly impossible to avoid rotations or structural changes due to the energy transfer from the electrons to the cluster. The possibility to determine the 3D atomic structure of nanomaterials based on a single-projection image has therefore received renewed interest.
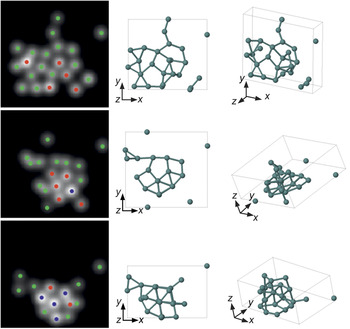
Van Aert and co-workers showed that the number of atoms in a given atomic column can be counted with single-atom sensitivity.Reference Van Aert, De Backer, Martinez, Goris, Bals, Van Tendeloo and Rosenauer30 The technique is based on a statistical analysis of the scattering cross sections, which can be obtained at the atomic level when using an empirical model-based approach. The scattering cross sections for each atomic column can be related to the number of atoms that are present in each column. This approach was used to investigate the dynamical behavior of ultrasmall Ge clusters consisting of less than 25 atoms.Reference Bals, Van Aert, Romero, Lauwaet, Van Bael, Schoeters, Partoens, Yucelen, Lievens and Van Tendeloo31 Aberration-corrected HAADF-STEM images were acquired, and the number of atoms at each position were determined. Ab initio calculations were carried out in order to extend the 2D images into 3D. As an input, different starting configurations, in agreement with the experimental 2D HAADF-STEM images, were used. All of the final cluster configurations stay relatively close to the input structures, as illustrated in Figure 4.Reference Bals, Van Aert, Romero, Lauwaet, Van Bael, Schoeters, Partoens, Yucelen, Lievens and Van Tendeloo31 However, only those configurations in which a planar base structure was assumed were found to be compatible with the 2D experimental images. Reliable 3D structural models could thus be obtained for the ultrasmall clusters.
The left column illustrates the counting results obtained for three different configurations of a single ultrasmall Ge cluster, consisting of <25 atoms. Green, red, and blue dots correspond to the presence of one, two, and three atoms, respectively. The 3D results of the ab initio calculations are illustrated at the right along different viewing directions, showing a planar base structure.Reference Bals, Van Aert, Romero, Lauwaet, Van Bael, Schoeters, Partoens, Yucelen, Lievens and Van Tendeloo31

For larger clusters or nanoparticles, counting results can be used to generate a starting configuration where each atomic column is positioned symmetrically around a central plane. Using Monte-Carlo-based energy minimization, a 3D model for the structure of the nanoparticle can be proposed. Jones and co-workers successfully applied this technique to visualize the 3D atomic structure of a catalytic Pt nanoparticle and observed mainly {111} facets on the nanoparticle.Reference Jones, MacArthur, Fauske, van Helvoort and Nellist32 Jia et al. determined the shape of a MgO nanocrystal using a single high-resolution TEM projection image acquired with the negative spherical aberration imaging technique.Reference Jia, Mi, Barthel, Wang, Dunin-Borkowski, Urban and Thust33 Van Dyck and co-workers analyzed the stacking of two graphene layers with atomic resolution from a single restored exit wave.Reference Van Dyck, Jinschek and Chen34 The exit wave is the electron wave after it has interacted with the specimen. This technique is based on the fact that the phase of the exit wave increases linearly with the distance of propagation, and as a result, the third dimension of each atom can be estimated by a linear fitting model. A similar study was also performed to obtain a 3D atomic model of the active sites on Pt catalytic nanoparticles.Reference Chang, Barnard, Gontard and Dunin-Borkowski35
Clearly, these different approaches will become increasingly important in the future for atomic-resolution electron tomography and are expected to open up a whole new range of experiments that will enable researchers to link the crystal structure, including defects, to functional properties.
Summary
Electron tomography has been used in an increasing number of studies to investigate the 3D structure of nanomaterials. Recent advances by different groups and using different techniques have pushed the resolution of the technique to the atomic level. Although many of these results have been obtained for model-like systems, innovative studies have also enabled the investigation of interfaces, defects, and lattice deviations with the same resolution in noble materials with a typical fcc crystal structure. However, investigating the positions of the atoms in an unknown crystal structure remains challenging, as is investigating the chemical nature and valence for every atom in a given nanostructure. This could be achieved using a combination of HAADF-STEM tomography with electron energy loss spectroscopy or x-ray energy dispersive spectroscopy. Recently, high-quality reconstructions have been obtained with a resolution at the nanometer scale, but further progress is required to push the resolution to the atomic scale. The achievement of atomic resolution in 3D electron tomography should therefore not be considered as the end of a quest, but rather, as the start of a new journey in the field of 3D electron microscopy and materials science in general.
Acknowledgments
The authors gratefully acknowledge funding from the Research Foundation Flanders (G.0381.16N, G.036915, G.0374.13, and funding of postdoctoral grants to B.G. and A.D.B.). S.B. acknowledges the European Research Council, ERC Grant Number 335078—Colouratom. The research leading to these results received funding from the European Union Seventh Framework Program under Grant Agreements 312483 (ESTEEM2). The authors would like to thank the colleagues who have contributed to this work, including K.J. Batenburg, J. De Beenhouwer, R. Erni, M.D. Rossell, W. Van den Broek, L. Liz-Marzán, E. Carbó-Argibay, S. Gómez-Graña, P. Lievens, M. Van Bael, B. Partoens, B. Schoeters, and J. Sijbers.