Statement of Research Significance
Research Question(s) or Topic(s): This study developed regression-based normative data for widely used neuropsychological tests in Argentine adults aged 50 years and older, examining the effects of age, sex, and education on cognitive performance. Main Findings: Age, sex, and education were significant predictors of performance across several cognitive measures. Older age was generally associated with lower performance, higher education with better performance, and female sex with better scores in verbal memory and phonological fluency. The results support regression-based models as a useful framework for adjusting neuropsychological test scores for demographic influences. Study Contributions: This study provides locally derived normative data for Argentina, helping reduce reliance on foreign norms in clinical practice. It also shows the methodological value of regression-based norming and offers an open-access calculator to facilitate application in clinical and research settings.
Introduction
Argentina, the second-largest country in Latin America and home to nearly 9% of the world’s Latino population, is confronting the dual pressures of rapid population aging and an increasing prevalence of dementia risk factors. According to the National Institute of Statistics and Censuses (INDEC, 2024), adults aged 60 years and older now account for 16.2% of the total population, underscoring a marked demographic transition over the past century. Using a decade of data from the National Disability Registry, Calandri et al. (Reference Calandri, Suemoto and Allegri2025) estimated age-standardized dementia incidence rates per 100,000 inhabitants based on population projections from the 2010 and 2022 national censuses. Their analyses indicate that in 2023 Argentina registered an age-standardized incidence of 25.3 new dementia cases per 100,000 inhabitants, with higher rates among women (31.1) than men (19.1). In this national context, neuropsychological assessment constitutes an indispensable tool for diagnosis, treatment planning, and clinical decision-making (Soer et al., Reference Soer, van der Schans, Geertzen, Groothoff, Brouwer, Dijkstra and Reneman2009). Consequently, the use of culturally adapted neuropsychological measures and locally derived normative data represents a necessary condition for valid clinical inferences.
Neuropsychological inferences and sociodemographics
Yet cognition is, by definition, demographic-dependent: its expression and measurement are inseparable from the individual’s social, educational, and biological context (Fittipaldi et al., Reference Fittipaldi, Legaz, Maito, Hernandez, Altschuler, Canziani, Moguilner, Gillan, Castillo, Lillo, Custodio, Avila-Funes, Cardona, Slachevsky, Henriquez, Fraile-Vazquez, de Souza, Borroni, Hornberger and Ibanez2023). Studies with large samples consistently indicate that sociodemographic predictors explain a substantial proportion of cognitive variability across different domains, such as attention, cognitive flexibility, reasoning, processing speed, and working memory (Marzuki et al., Reference Marzuki, Wong, Chan, Na, Thanaraju, Phon-Amnuaisuk, Vafa, Yap, Lim, Yip, Arokiaraj, Shee, Lee, Chia, Jenkins and Schaefer2024; Nichols et al., Reference Nichols, Wild, Owen and Soddu2021; Rexroth et al., Reference Rexroth, Tennstedt, Jones, Guey, Rebok, Marsiske, Xu and Unverzagt2013). Taken together, these findings indicate that younger age and higher educational level are associated with better cognitive performance, whereas sex may be differentially related to specific domains. However, the tendency to consider the effect of sociodemographic variables on aging (Jawinski et al., Reference Jawinski, Markett, Drewelies, Düzel, Demuth, Steinhagen-Thiessen, Wagner, Gerstorf, Lindenberger, Gaser and Kühn2022; Yan et al., Reference Yan, Li, Wang, Huang, Wan and Nho2015) and neurodegeneration (Pinaya et al., Reference Pinaya, Scarpazza, Garcia-Dias, Vieira, Baecker, da Costa, Redolfi, Frisoni, Pievani, Calhoun, Sato and Mechelli2021; Verdi et al., Reference Verdi, Kia, Schott, Marquand and Cole2022) is not a common practice. Nevertheless, sociodemographic variables such as age (Bethlehem et al., Reference Bethlehem, Seidlitz, White, Vogel, Anderson, Adamson, Adler, Alexopoulos, Anagnostou, Areces-Gonzalez, Astle, Auyeung, Ayub, Bae, Ball, Baron-Cohen, Beare, Bedford, Benegal and Alexander-Bloch2022; Cesnaite et al., Reference Cesnaite, Steinfath, Jamshidi Idaji, Stephani, Kumral, Haufe, Sander, Hensch, Hegerl, Riedel-Heller, Röhr, Schroeter, Witte, Villringer and Nikulin2023; Di Biase et al., Reference Di Biase, Tian, Bethlehem, Seidlitz, Alexander-Bloch, Yeo and Zalesky2023; Gaal et al., Reference Gaál, Boha, Stam and Molnár2010; Ishii et al., Reference Ishii, Canuet, Aoki, Hata, Iwase, Ikeda, Nishida and Ikeda2017 ; Murty et al., Reference Murty, Manikandan, Kumar, Ramesh, Purokayastha, Javali, Rao and Ray2020; Rossini et al., Reference Rossini, Rossi, Babiloni and Polich2007; Stacey et al., Reference Stacey, Crook-Rumsey, Sumich, Howard, Crawford and Livne2021; Stier et al., Reference Stier, Braun and Focke2023; Trammell et al., Reference Trammell, MacRae, Davis, Bergstedt and Anderson2017; Trondle et al., Reference Trondle, Popov, Pedroni, Pfeiffer, Baranczuk-Turska and Langer2023; Valdes-Sosa et al., Reference Valdes-Sosa, Galan-Garcia and Bosch-Bayard2021; Voytek et al., Reference Voytek, Kramer, Case, Lepage, Tempesta, Knight and Gazzaley2015; Zappasodi et al., Reference Zappasodi, Marzetti, Olejarczyk, Tecchio and Pizzella2015) and education (Gordon et al., Reference Gordon, Rykhlevskaia, Brumback, Lee, Elavsky, Konopack, McAuley, Kramer, Colcombe, Gratton and Fabiani2008; Jokinen et al., Reference Jokinen, Melkas, Madureira, Verdelho, Ferro, Fazekas, Schmidt, Scheltens, Barkhof, Wardlaw, Inzitari, Pantoni and Erkinjuntti2016; Habes et al., Reference Habes, Pomponio, Shou, Doshi, Mamourian, Erus, Nasrallah, Launer, Rashid, Bilgel, Fan, Toledo, Yaffe, Sotiras, Srinivasan, Espeland, Masters, Maruff and Fripp2021; Franzmeier et al., Reference Franzmeier, Duering, Weiner, Dichgans and Ewers2017a, Reference Franzmeier, Göttler, Grimmer, Drzezga, Áraque-Caballero, Simon-Vermot, Taylor, Bürger, Catak, Janowitz, Müller, Duering, Sorg and Ewers2017b) are important predictors of changes over time in the brain and behavior.
In this regard, data derived from cognitive tests must be adjusted for key sociodemographic variables such as age, sex, and education (Innocenti et al., Reference Innocenti, Tan, Candel and van Breukelen2023). Such adjustment enhances the representativeness of the test scores and improves the validity of test interpretation.
Normative data in Argentina
Despite their critical role, normative data (ND) – defined as reference values that allow clinicians to interpret an individual’s test performance by comparison with a reference population – specifically developed for Latin American (LA) populations remain scarce and often lack sufficient methodological rigor (Guàrdia-Olmos et al., Reference Guàrdia-Olmos, Peró-Cebollero, Rivera and Arango-Lasprilla2015; Perez-Lao et al., Reference Perez-Lao, Ying, Arias, Levy and Smith2025). A national survey of neuropsychologists in Argentina (n = 107) reported that 58% of the professionals use ND from foreign countries, and 64% of respondents expressed concern about the absence of culturally appropriate ND (Fernández et al., Reference Fernandez, Ferreres, Morlett-Paredes, Rivera and Arango-Lasprilla2016). In the absence of locally validated norms, clinicians frequently rely on ND developed in the United States or Europe, which may not adequately account for cultural, linguistic, and educational differences (Casaletto & Heaton, Reference Casaletto and Heaton2017; Daga et al., Reference Daga, Mohanty, Krishna and Priya2025; Karstens et al., Reference Karstens, Christianson, Lundt, Machulda, Mielke, Fields, Kremers, Graff-Radford, Vemuri, Jack, Knopman, Petersen and Stricker2024). Applying non-local norms can result in substantial diagnostic inaccuracies, increasing the risk of false positives and misdiagnoses when assessing individuals from diverse cultural backgrounds (Norman et al., Reference Norman, Evan, Miller and Heaton2000, Reference Norman, Moore, Taylor, Franklin, Cysique, Ake, Lazarretto, Vaida and Heaton2011). For example, in a study by Daugherty et al. (Reference Daugherty, Puente, Fasfous, Hidalgo-Ruzzante and Pérez-Garcia2017), the application of North American norms to Colombian, Moroccan, and Spanish samples led to false positive rates of 16%, 23%, and 6%, respectively. Depending on the specific test and population, up to 51% of individuals were misclassified as having mild or major cognitive disorder. Among Colombians, 23% met criteria for Mild Cognitive Disorder and 11% for major cognitive disorder; for Moroccans, these rates were 20% and 24%, respectively, compared to only 11% and 1.2% among Spaniards.
Despite these challenges, normative research in neuropsychology in Argentina has progressed over the past two decades (Martino et al., Reference Martino, Cervigni, Gallegos de San Vicente and Politis2021); however, the development of ND has been heterogeneous, with studies varying widely in their methodology. As an example of task-specific normative efforts, Margulis et al. (Reference Margulis, Squillace Louhau, Ferreres, Margulis, Louhau and Ferreres2019) developed ND for the Trail Making Test (TMT) in 407 individuals aged 16 to 90 years from Buenos Aires, providing norms stratified by age and education. More recently, Filippetti and Gutiérrez (Reference Filippetti and Gutiérrez2025), produced regression-based norms for 413 children and adolescents aged 5 to 15.
For verbal fluency tasks, several Argentine studies have been done. Butman et al. (Reference Butman, Allegri, Harris and Drake2000) generated the first local ND for phonemic and semantic fluency in 266 adults aged 16 to 83 years, stratified by 10-year age bands and three educational levels. Marino and Alderete (Reference Marino and Alderete2010) expanded the scope by providing norms for categorical, phonemic, grammatical, and combined fluency tasks in 259 adults aged to 15 to 70 years, stratifying by sex, age, and education groups. Martino et al. (Reference Martino, Cervigni, Portillo, Gallegos, Politis, Bortoli and Vivas2022) developed norms for phonemic, semantic, and action fluency in 303 adults aged 50 years and older. Although they modeled sociodemographic effects, the final normative tables were stratified by age and educational level.
With respect to memory assessment, Leis et al. (Reference Leis, Allegri, Román, Iturry, Crotti, Gatto and Rojas2018) published Argentine ND for the verbal subtests of the Signoret Memory Efficiency Battery (BEM 144) in 227 cognitively healthy adults and 95 patients with mild cognitive impairment (MCI). Norms were provided for six age groups. Complementarily, Román et al. (Reference Román, Iturry, Rojas, Barceló, Buschke and Allegri2016) validated the Argentine version of the Memory Binding Test (MBT) for early MCI detection in 88 participants (46 healthy controls and 42 amnestic MCI). The authors provided stratified ND by age (≤65 vs. ≥66 years) and education (≤12 vs. ≥13 years).
Stratified normative data vs the regression-based approach
The traditional approach to constructing neuropsychological norms involves defining a reference population and categorizing continuous variables, such as age, into discrete intervals (e.g., 60–69 years), with specific norms calculated for each. The approach involves the calculation of the sample mean and its standard deviation.
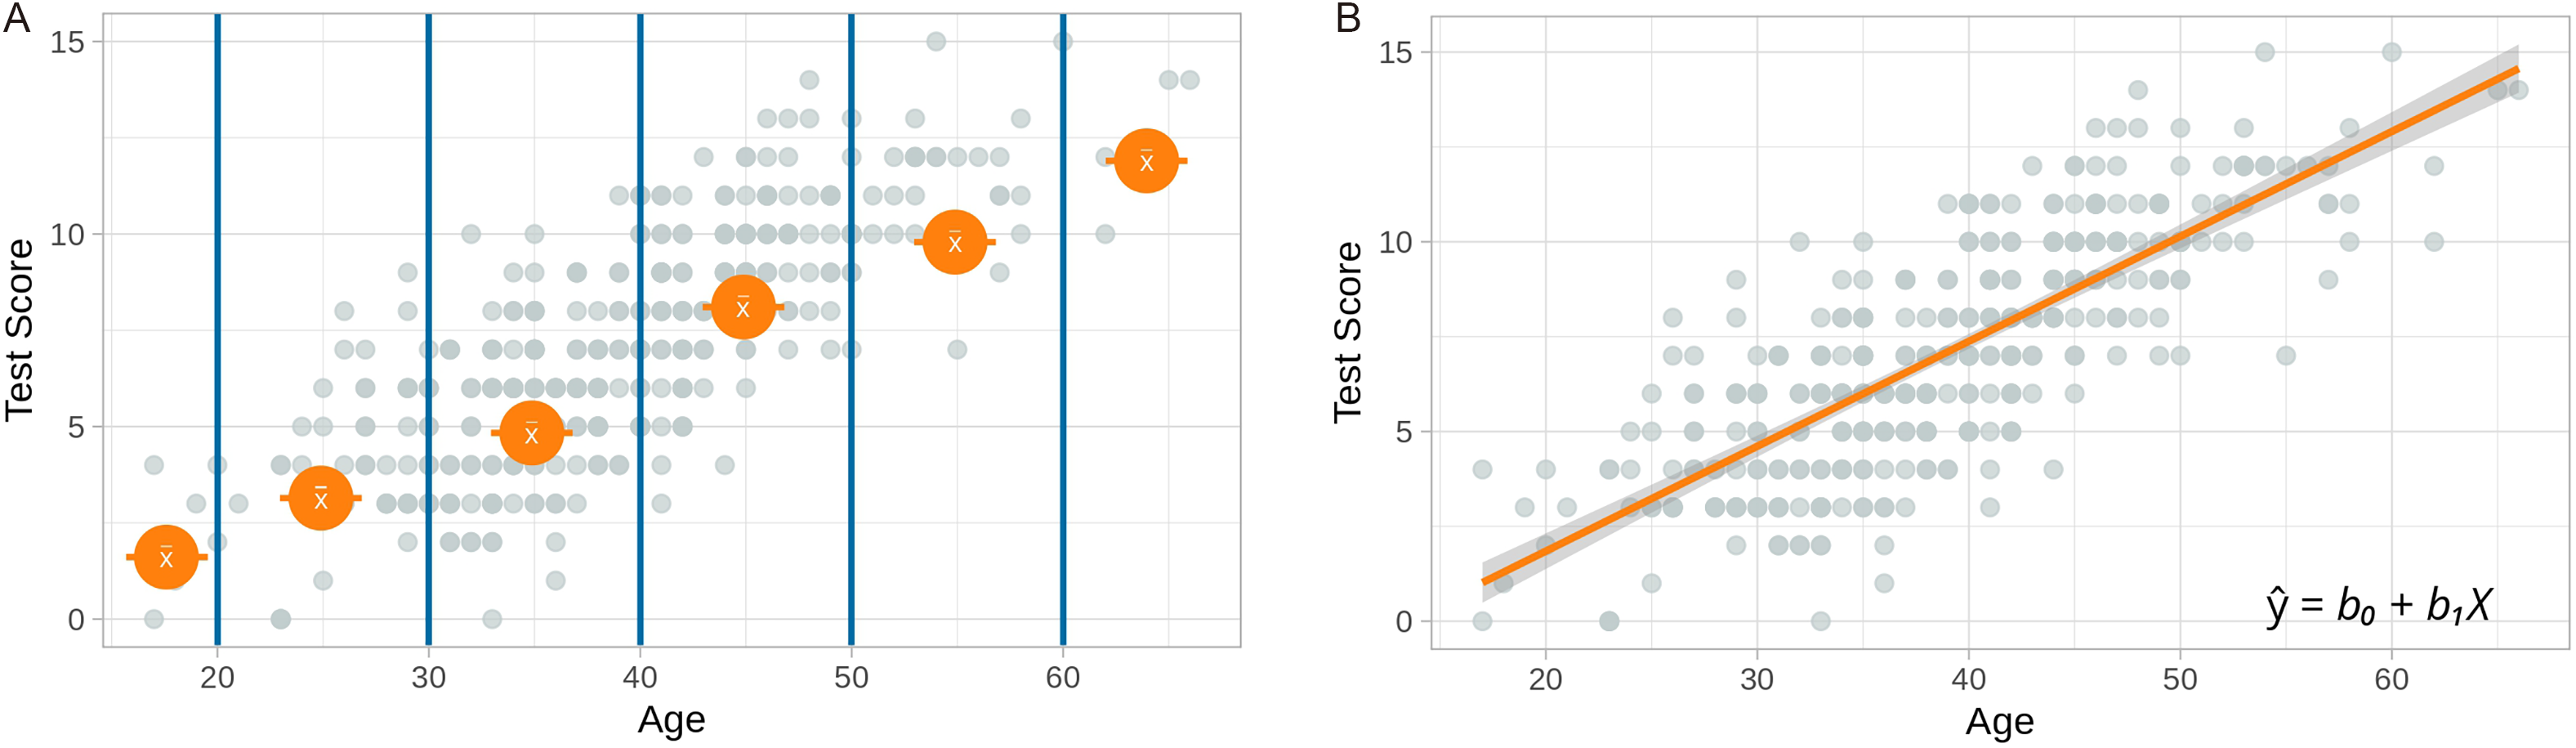
However, this approach presents limitations, as it can lead to abrupt jumps in normative scores when transitioning between age intervals (Kiselica et al., Reference Kiselica, Kaser, Weitzner, Mikula, Boone, Woods, Wolf and Webber2024). This means that nearly identical raw scores may be interpreted differently for individuals whose ages fall just within successive intervals, even if they differ by only a few days (e.g., 59 years and 364 days vs. 60 years and 1 day). Such jumps are unrealistic, as they contradict the theoretical understanding that score distributions change smoothly and continuously (Van Breukelen & Vlaeyen, Reference Van Breukelen and Vlaeyen2005; Zachary & Gorsuch, Reference Zachary and Gorsuch1985). Traditional norming relies on age intervals, which implies the implicit assumption that the test score distribution remains constant within each interval. However, when score distribution changes continuously, this assumption only holds to an adequate degree if very narrow intervals are used (Figure 1).
Panel A: Traditional normative approach using discrete age bins, where test scores are compared to group means within each age interval. Panel B: Regression-based normative approach, where test scores are predicted as a continuous function of covariates using linear models. Inspired by Timmerman et al., Reference Timmerman, Voncken and Albers2021.

In contrast, regression-based normative methods use covariates – such as age, sex, and education – as independent variables to predict raw test scores. These predicted scores are then standardized to generate an empirical distribution that adjusts for the covariates of interest (Shirk et al., Reference Shirk, Mitchell, Shaughnessy, Sherman, Locascio, Weintraub and Atri2011). Unlike traditional normative methods, which often rely on arbitrary grouping, regression-based approaches treat continuous variables as such, avoiding artificial cutoffs and better capturing individual variability. These models can incorporate multiple covariates simultaneously, be tailored to specific neuropsychological tests and populations (Timmerman et al., Reference Timmerman, Voncken and Albers2021), and include interaction effects between variables. Additionally, non-linear relationships between predictors and outcomes can be modeled to more accurately reflect complex patterns (Shirk et al., Reference Shirk, Mitchell, Shaughnessy, Sherman, Locascio, Weintraub and Atri2011). Finally, empirical estimates suggest that traditional normed score calculation requires sample sizes two and a half to five times larger than regression-based normed score calculation (Oosterhuis et al., Reference Oosterhuis, Van der Ark and Sijtsma2016).
Due to the methodological limitations in generating norms via stratification and the lack of local ND, it becomes necessary to develop ND that ensure robustness and generalizability. Using local ND will allow for greater precision in the cognitive mapping and strengthen clinical decision-making. In this context, linear modeling offers several advantages: it quantifies the independent contribution of each predictor to cognitive performance and enables the simultaneous inclusion of multiple predictors, thereby avoiding arbitrary stratification schemes and improving model efficiency and interpretability. With this in mind, the objective of this study is to develop regression-based ND for a set of widely used neuropsychological tests. In addition, as a secondary aim, we will provide a freely accessible calculator for use in Buenos Aires, Argentina.
Materials and methods
Participants
Participants were drawn from a large clinical dataset maintained by the Fleni Neurology, Neuropsychology, and Neuropsychiatric Department (Buenos Aires, Argentina). Patients underwent evaluations between 2020 and 2024. Inclusion criteria were as follows: (a) age over 50 years, (b) native Rioplatense Spanish speaker, (c) a Montreal Cognitive Assessment (MoCA) score ≥ 26 (González Palau & Berrios, Reference González Palau, Berrios, García Basalo, Ojea Quintana, Fernández, García Basalo, Fernández, Cámpora, Matusevich and Golimstok2018), (d) z-scores > −1.5 on both immediate and delayed recall phases of the Craft Story 21 (Sachs et al., Reference Sachs, Steenland, Zhao, Hughes, Weintraub, Dodge, Barnes, Craft, Parker and Goldstein2020), and (e) a Functional Assessment Questionnaire (FAQ) score < 9. Patients with neurological and/or psychiatric diagnoses, as determined by clinical neurologists according to Diagnostic and Statistical Manual of Mental Disorders V (DSM-V), were excluded from the study.
This project was approved by the Fleni Research Ethics Committee (registration code 16997). The study used retrospective data extracted from an institutional database, and the requirement for informed consent was waived by the ethics committee. The research was conducted in accordance with the principles of the Declaration of Helsinki.
Cognitive measures
The criteria for including the following cognitive tests were based on two main aspects: (a) their dissemination across the region, considering both accessibility and open availability of stimuli, as detailed below and (b) their adequate psychometric properties. Neuropsychological tests are part of the Uniform Data Set Neuropsychological Battery (Morris et al., Reference Morris, Weintraub, Chui, Cummings, DeCarli, Ferris, Foster, Galasko, Graff-Radford, Peskind, Beekly, Ramos and Kukull2006; Weintraub et al., Reference Weintraub2009). The complete list of stimuli can be viewed at https://www.naccdata.org/collect-and-submit-nacc-data. The version of the RAVLT used corresponds to Burín et al. (Reference Burin, Ramenzoni and Arizaga2003).
Rey auditory verbal learning test
The Rey Auditory Verbal Learning Test (RAVLT; Lezak, Reference Lezak1983; Rey, Reference Rey1964) assesses episodic verbal memory through the learning and recall of a word list. The test begins with a learning phase consisting of five trials during which the subject is presented with 15 words that must be recalled immediately after being pronounced by the examiner. Subsequently, a unique alternative list of 15 words (interference list) is introduced, which the subject must also recall immediately. Next, the subject is asked to recall the first list again. After a set interval (20–30 minutes), long-term retention is assessed through delayed recall, and finally, a recognition task is performed to identify the previously presented words. In addition to the scores obtained during the initial phase, which allow for the construction of a learning curve, and the results of the various recall and recognition trials necessary to evaluate the processes of encoding, storage, and retrieval, this test provides valuable information about the presence of intrusions and false positives, key aspects for constructing the subject’s cognitive profile. According to Alviarez-Schulze et al. (Reference Alviarez-Schulze, Cattaneo, Pachón-García, Solana-Sánchez, Tormos, Pascual-Leone and Bartrés-Faz2022), the RAVLT demonstrates adequate construct validity, with a four-factor structure showing good model fit (GFI = 0.95, RMSEA < 0.09), and evidence of convergent validity, as indicated by significant correlations between RAVLT scores and S-FNAME performance (r = 0.37–0.43; p < .01).
Semantic and phonological fluency
Verbal Fluency tasks assess the subject’s ability to access the lexicon and retrieve information related to words. This information may be linked to meaning (semantic fluency) or formal structure (phonological fluency). In both tasks, the subject is asked to produce as many words as possible within a set time period (1 minute), under a specific restriction. In semantic fluency, responses must be limited to a specific category; for this study, the category of animals was used (Morris et al., Reference Morris, Heyman, Mohs, Hughes, van Belle, Fillenbaum, Mellits and Clark1989). In phonological fluency, the subject must generate words starting with a specific letter; in this case, the letter P was chosen, as it is widely used in the region (Butman et al., Reference Butman, Allegri, Harris and Drake2000). These tasks not only assess language-related aspects but also involve other cognitive domains, such as executive functions. Additionally, they allow for the analysis of other elements, beyond the final score, such as the presence of perseverations, intrusions, and the order in which words are produced, providing insight into the strategies used by the subject. In an Argentine study by Martino et al. (Reference Martino, Cervigni, Portillo, Gallegos, Politis, Bortoli and Vivas2022), test–retest reliability was examined in a sample of 85 non-clinical adults (mean age = 73.7 years; 75.3% women). Phonological and semantic fluency tasks demonstrated good reliability, with intraclass correlation coefficients (ICCs) of 0.77 and 0.79, respectively, while the action fluency task showed excellent reliability (ICC = 0.90). Similarly, in the normative study by Butman et al. (Reference Butman, Allegri, Harris and Drake2000), phonological and semantic fluency tasks provided evidence of convergent validity, as both measures correlated positively with years of education and total scores on the Mini-Mental State Examination (MMSE) and negatively with age.
Trail Making Test
The Trail Making Test (TMT; Reitan, Reference Reitan1958) is a neuropsychological assessment consisting of two parts. In Part A, sustained attention and visuospatial skills, such as visual search, are assessed by asking the subject to connect numbers from 1 to 25 in ascending order with a straight line as quickly as possible. Part B shares a similar format with Part A but is more demanding. In this task, the subject must alternate between numbers (1 to 13) and letters (A to L), connecting them with a straight line as quickly as possible while maintaining ascending numerical and alphabetical order (e.g., 1-A-2-B). In this part, alternating attention is evaluated in addition to the skills assessed in Part A. In both tasks, scoring is based on the total time taken (in seconds). Additionally, the number of errors and, particularly in Part B, the type of error may also be recorded. Regarding its psychometric properties, in an Argentine study, Fernández et al. (Reference Fernández, Marino and Alderete2002) standardized the TMT and examined its convergent validity, finding a significant association between the TMT and verbal fluency (TMT-A and verbal fluency: r = −0.36, p < .001, TMT-B and verbal fluency: r = −0.40, p < .001) and the Porteus Maze Test (TMT-A and Porteus Maze Test: r = −0.48, p < .001, TMT-B and Porteus Maze Test: r = −0.44, p < .001).
Digit span test
The Digit Span test (Richardson, Reference Richardson2007) is a tool frequently used in neuropsychological assessment. It consists of two parts: Digit Forward and Digit Backward. In the Digit Forward task, the subject must immediately repeat, in the same order, a series of digits that progressively increase in length as the test advances. The series begins with 2 digits and increases in number with each level. This task primarily assesses attentional span. The Digit Backward task follows a similar format in terms of presentation. The subject listens to a series of digits that also increase in length but, in this case, must repeat them in reverse order. This task assesses working memory, as it requires temporarily storing the digits and mentally manipulating them before reproducing them. Separate scores are obtained for each part, allowing for independent analysis of the assessed domains. Barreyro et al. (Reference Barreyro, Injoque-Ricle, González and Burin2015) examined the reliability and convergent validity of this test in an Argentine sample. The results indicated good internal consistency (α = 0.80 and α = 0.83 for the two subtests) and significant associations between the Digit Span and the Letter–Number Sequencing task. A confirmatory factor analysis supported a model with two first-order factors (one for each task) and a second-order working memory factor, showing good fit indices (χ 2(1) = 0.62, p = .43; AGFI = 0.97; CFI = 0.99; TLI = 0.99; RMSEA ≤ 0.00).
Sociodemographic variables
The sociodemographic variables to be included are age, sex, and educational attainment. Age will be defined as chronological age; sex will be classified as female or male (female = 1, male = 0); and educational attainment will be expressed as the total number of completed years of formal education.
Data analysis
All analyses were conducted using R version 4.5.0. The following packages were used: tidyverse, NormData, caret, MASS, arsenal, flexplot, and forecast. The ND development procedure is based on the one proposed by Van der Elst (Reference Van der Elst2024).
Stage 1: Building the regression model.
The regression-based ND were calculated using age, sex, and education as predictors and raw scores as outcomes for each variable. The linear regression model can be expressed as:
 $$Y'=\alpha +\beta _{1}X_{1}+\beta _{2}X_{2}+\epsilon \ \ \ \ \ N(0,{\sigma }_{\epsilon }^{2})$$
where Y′ is the predicted score, α is the intercept, βi is the beta coefficient associated with variable i, and Xi is the value of predictor i. The intercept (α) represents the value of the response variable when all predictors are equal to 0. At the same time, the beta coefficients (βi) indicate the average change in the response variable for a one-unit increase in the predictor, holding all other predictors constant.
The first main objective of Stage 1 of the regression-based normative procedure is to obtain a parsimonious model for the mean structure. Age was centered (Ageᶜ = age-x̅ in the sample) in order to render the model intercept clinically interpretable so that it represents the expected performance of an average individual from the normative sample rather than a value at age zero. The considered model includes Ageᶜ, Age2ᶜ, Age3ᶜ,
 $\log({age \over 100})$
, Sex, Educational Level, Ageᶜ × Sex, Ageᶜ × Educational Level, Sex × Educational Level. The model includes three main effects (Ageᶜ, Sex, and Educational Level), higher-order polynomial terms up to the third order for the centered quantitative independent variable (Ageᶜ), and interaction terms.
A stepwise backward elimination model-building strategy was employed. This approach, based on the Akaike Information Criterion (AIC), starts from the full theoretical model and progressively removes predictors that do not improve model fit and has been widely used in regression-based normative frameworks (e.g., Casaletto & Heaton, Reference Casaletto and Heaton2017; Mitrushina et al., Reference Mitrushina, Boone, Razani and D’Elia2005; Van der Elst et al., Reference Van der Elst, Molenberghs, Van Boxtel and Jolles2013). Following model selection, statistical significance of retained predictors was evaluated using Bonferroni-corrected p-values to control for multiple comparisons (Arcara et al., Reference Arcara2024).
The following assumptions were evaluated for all regression models: multicollinearity (Variance Inflation Factor [VIF] < 10), homoscedasticity (Breusch–Pagan test), normality of the standardized residuals (Kolmogorov–Smirnov test and histogram plots), kurtosis, skeweness, and the existence of influential values (measured by standardized residual variance distance). When the homoscedasticity assumption was not met, heteroskedasticity-consistent (HC) standard errors were computed using the HC0 estimator (White, Reference White1980). Finally, model comparison was complemented using information-theoretic criteria (AIC and BIC).
In order to reduce overfitting, we additionally performed 10-fold cross-validation to estimate the out-of-sample predictive performance of each model. In this procedure, the total sample (n = 393) was partitioned into 10 folds of approximately equal size. Each validation fold contained between 39 and 40 participants, while the corresponding training sets ranged from 353 to 354 participants. In each iteration, 9 folds were used for model training and the remaining fold for validation. This process was repeated 10 times so that each observation contributed once to validation and nine times to training. Whereas the full-sample R 2 reflects explained variance, the cross-validated R 2, RMSE, and MAE quantify the expected accuracy when predicting new subjects.
Stage 2: Deriving normative data
The procedure consists of:
1. Calculating
 $\widehat{Y}_{0}$
for the evaluated individual i = 0 using the Stage 1 prediction function.
2. Calculating the residuals
 $$\varepsilon _{0}=Y_{0}-\widehat{Y}_{0}$$
3. Calculating the standardized residual
 $$\left(\delta ={\varepsilon \over \sigma _{\varepsilon }}\right)$$
4. The individual residual score (δ0), obtained as described in Step 3, was converted into an estimated percentile rank (π0) using the empirical cumulative distribution of residuals derived from the normative sample:
 $$\pi_0=\Psi(\delta_0)$$
Results
Sociodemographics
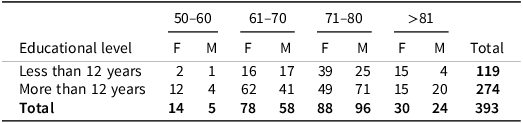
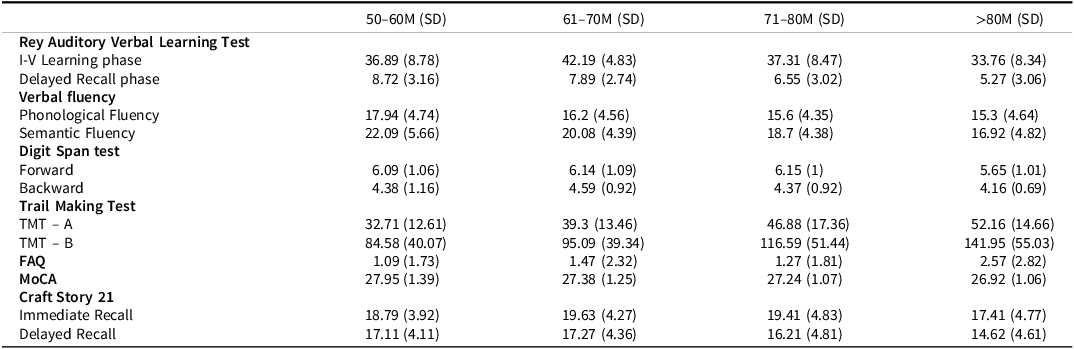
The initial dataset consisted of a total of 13,729 patients. After applying the eligibility criteria, 393 were selected. A sample size evaluation is provided in the Supplementary Materials. Sociodemographic characteristics of the sample are described in Table 1. Neuropsychological test results are described in Table 2.
Sociodemographic data (n = 393) grouped by age, sex, and educational level

Table 1 Long description
A table with sociodemographic data grouped by age, sex, and educational level. The table has 4 columns and 5 rows, including headers. The columns are labeled with age groups (50-60, 61-70, 71-80, >81) and further divided by sex (F, M). The rows are labeled by educational level (Less than 12 years, More than 12 years) and include a total row. Row 1: Less than 12 years, F: 2, 1, 16, 39; M: 17, 25, 15, 4; Total: 119. Row 2: More than 12 years, F: 12, 62, 41, 15; M: 4, 49, 71, 20; Total: 274. Row 3: Total, F: 14, 78, 58, 30; M: 5, 58, 88, 24; Total: 393.
Note: F = Female; M = Male.
Neuropsychological and functional tests scores

Table 2 Long description
The table presents neuropsychological and functional test scores for different age groups, specifically 50-60M, 61-70M, 71-80M, and over 80M. It includes standard deviations for each test score. The table has 11 rows and 8 columns. Column headers are: 50-60M (SD), 61-70M (SD), 71-80M (SD), and over 80M (SD). Row labels include various tests such as Rey Auditory Verbal Learning Test, Verbal fluency, Digit Span test, Trail Making Test, FAQ, MoCA, and Craft Story 21. Each row provides specific test scores and their standard deviations for the different age groups. Notable trends include variations in test scores across different age groups, with some tests showing higher scores in younger age groups and others showing more variability in older age groups.
Note : M = Mean, SD = Standard Deviation, TMT = Trail Making Test, FAQ = Functional Assessment Questionnaire, MoCA = Montreal Cognitive Assessment.
Model assumptions
Across all models, multicollinearity – measured through generalized variance inflation factors – was below conventional thresholds. No models showed evidence of problematic collinearity. For the RAVLT Learning, RAVLT Delayed, Semantic Fluency, Phonological Fluency, Digit Span Forward, Trail Making Test A and Trail Making Test B models, the assumption of homoscedasticity was supported by non-significant Breusch–Pagan tests. In these models, residual normality was generally adequate, although mild deviations from normality were observed in some cases (e.g., Semantic and Phonological fluency, Digit Span Forward, and Trail Making Test B). No influential outliers were detected.
In contrast, the Digit Span Backward model showed evidence of heteroscedasticity, as indicated by Breusch–Pagan tests. For this model, heteroscedasticity-consistent standard errors were therefore used. Detailed test statistics for all assumption checks and model comparisons are reported in the Supplementary Materials section (Appendix 2–3).
Model performance and predictors
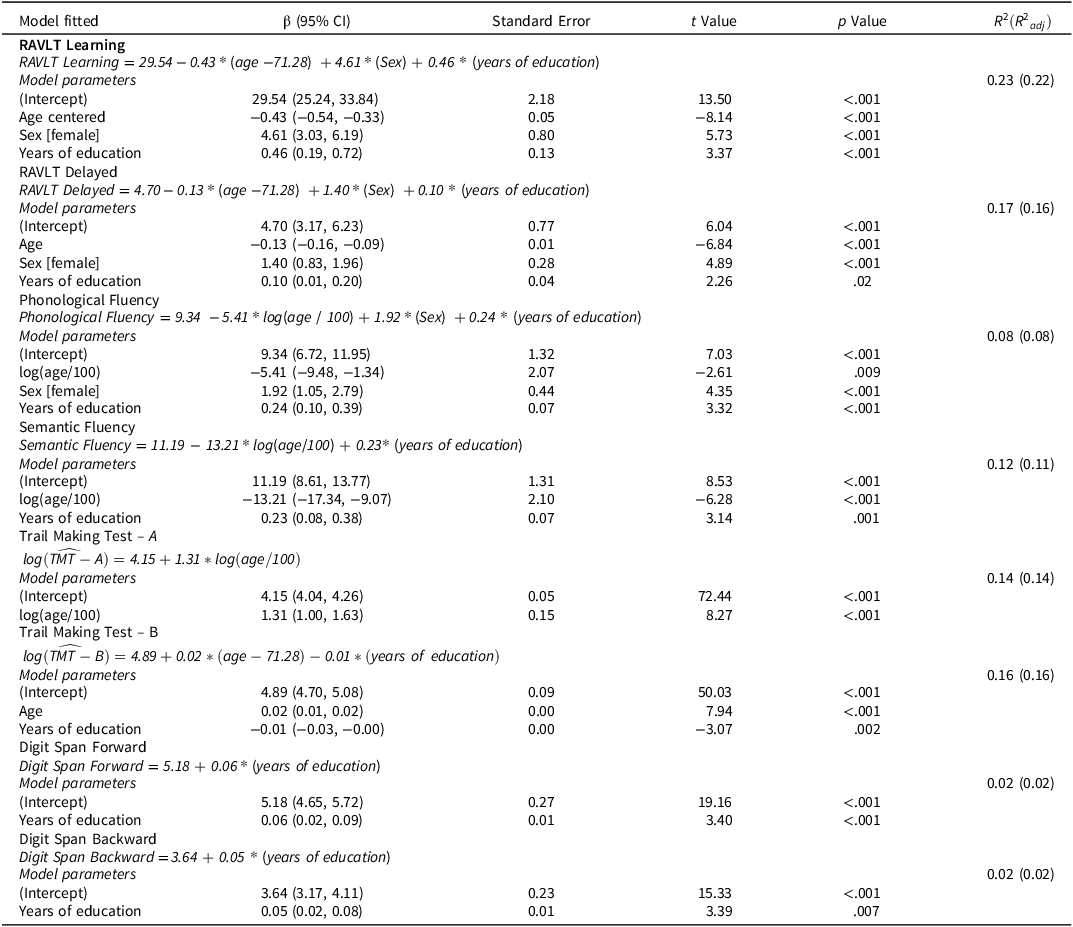
Across verbal memory, fluency, working memory, and executive measures, demographic variables accounted for a systematic proportion of performance variability. Parameter estimates, explained variance proportion (R 2 and adjusted R 2), error metrics, confidence intervals, and the final formula for all adjusted models are presented in Table 3. Interaction terms and higher-order age polynomials were not retained in the final models due to lack of statistical significance.
Fitted model results

Table 3 Long description
A table comparing demographic variables' impact on cognitive performance. The table has 10 rows and 6 columns. Column headers are Model fitted, β (95% CI), Standard Error, t Value, p Value, and R2 (R2 adj). Row labels include RAVLT Learning, RAVLT Delayed, Phonological Fluency, Semantic Fluency, Trail Making Test - A, Trail Making Test - B, Digit Span Forward, and Digit Span Backward. Each cognitive measure has model parameters listed with intercept, age centered, sex female, and years of education. Values for β (95% CI), Standard Error, t Value, p Value, and R2 (R2 adj) are provided for each parameter. Notable trends include significant p values for most parameters, indicating strong relationships between demographic variables and cognitive performance.
Note: β coefficients are unstandardized.
For verbal memory, age, sex, and years of education jointly contributed to RAVLT performance. Increasing age was associated with lower scores, whereas female sex and higher educational attainment were associated with better outcomes. The RAVLT learning model explained 23% of the variance, with ten-fold cross-validation yielding an R 2 of 0.24 (RMSE = 7.86; MAE = 6.23). For RAVLT Delayed Recall, the model explained 17% of the variance, and cross-validation yielded an R 2 of 0.17 (RMSE = 2.80; MAE = 2.28).
In verbal fluency tasks, age (modeled as log(age/100)), education and sex were the primary determinants of performance. Phonological Fluency was associated with age, sex – with females outperforming males – and years of education. The proportion of explained variance was 8%, and cross-validation results were consistent with the fitted model (R 2 = 0.08; MSE = 4.34; MAE = 3.43). Semantic Fluency scores decreased with increasing age and increased with higher years of education, with the final model explaining 12% of the variance and cross-validated performance remaining consistent (R 2 = 0.12; RMSE = 4.38; MAE = 3.53).
Years of education was a significant predictor of Digit Span Forward performance, accounting for approximately 2% of the variance. Cross-validation showed a R 2 = 0.04, RMSE = 1.02, and MAE = 0.78. On the other hand, Digit Span Backward performance was associated with years of education, with an explained variance of 2% and cross-validation yielding similar results (R 2 = 0.03; RMSE = 0.90; MAE = 0.75).
Due to the positively skewed distribution of completion times, both Trail aking Test outcomes were log-transformed prior to modeling. Finally, both Trail Making Test were age-dependent. For TMT-A, older age was associated with longer completion times, with the final model explaining approximately 14% of the variance. Cross-validation results indicated comparable performance (R 2 = 0.16; RMSE = 0.33; MAE = 0.26). For TMT-B, performance reflected the effects of age and education, with completion times increasing with age and decreasing with higher educational attainment. The final model explained 16% of the variance, and cross-validation yielded an R 2 of 0.18 (RMSE = 0.36; MAE = 0.29). The table linking percentiles with their corresponding residual values is provided in the Supplementary Materials (Appendix 2).
Open access calculator
The four-step normative procedures explained above offer clinicians the ability to determine a z-score and the corresponding percentile for a participant who has a specific score on the RAVLT Learning, RAVLT Delayed, Verbal Fluency, TMT A-B, and Digit Span. To facilitate its use, the authors developed a calculator in Microsoft Excel where clinicians should include patient information (raw score for the specific test score, age, education, and sex). This excel file is freely available for all users and may be downloaded at https://github.com/nicorvfl/RegNorm. In addition, a brief tutorial on the use of the calculator, provided in both English and Spanish, is included in the Supplementary Materials (Appendix 1).
Discussion
The primary aim of this study was to develop regression-based ND for an adult Argentine population aged 50 to 90 years for the most commonly used neuropsychological tests in the region. Specifically, these norms are intended for individuals primarily residing in Buenos Aires, with demographic, educational, and socioeconomic characteristics broadly comparable to those represented in the present sample. In addition, we provide a freely accessible open access calculator. Using a clinical sample of 393 participants from Fleni, we established ND that account for sociodemographics, such as age, sex, and education. The selected tests consist of the RAVLT, Verbal Fluency (Semantic and Phonological), TMT A - B, and Digit Span (Forward and Backward). Overall, our results indicate that sociodemographic variables constitute relevant predictors of cognitive performance and that, consequently, adjusting ND for these variables represents a fundamental methodological step.
Sociodemographic factors have had a significant effect on all models of cognitive tests. Among them, age has been negatively associated with most tasks, indicating that older age is linked to lower cognitive performance. This result is consistent with previous studies (Deary et al., Reference Deary, Corley, Gow, Harris, Houlihan, Marioni and Starr2009; Murman, Reference Murman2015; Zaninotto et al., Reference Zaninotto, Batty, Allerhand and Deary2018). Age is, as expected, one of the most important sociodemographic variables for statistical control in the generation of ND due to its effect on the structural and functional changes in the human brain. According to the global decline approach, age negatively affects cognitive control function – i.e., the ability to regulate and coordinate thoughts, actions, and emotions to achieve goals and adapt to changing environmental demands – through the slowing down of processing speed (Sorel & Pennequin, Reference Sorel and Pennequin2008). This deceleration affects cognitive skills such as attention, memory, and executive functions (Korotkevich et al., Reference Korotkevich, Trewartha, Penhune and Li2015) and particularly hinders the ability to encode new information effectively and, therefore, retrieve information from long-term memory (Salthouse, Atkinson, Berish, et al., Reference Salthouse, Atkinson and Berish2003; Salthouse, Reference Salthouse2009; Spreng & Turner, Reference Spreng and Turner2019). Global decline, in turn, may affect working memory and impact daily activities such as decision-making and problem-solving (Vaughan & Giovanello, Reference Vaughan and Giovanello2010). In our article, we found that the effect of age has been transversal to cognitive function: it plays a role in memory, executive function, verbal fluency, and tasks related to processing speed.
Another demographic factor that has emerged as a relevant predictor is education. Its association with cognitive performance has been positive: as education increases, cognitive performance improves. Years of education are an important variable for explaining the variability in aging trajectories and cognitive function, and the influence of education on cognitive aging has been well documented (Galama et al., Reference Galama, Lleras-Muney and Kippersluis2018, Opdebeeck et al., Reference Opdebeeck, Martyr and Clare2016; Chen et al., Reference Chen, Lv, Li, Zhang, Chen, Liu, Li, Fan, Qin, Luo and Zhang2019; Clouston et al., Reference Clouston, Kuh, Herd, Elliott, Richards and Hofer2012; Clouston et al., Reference Clouston, Smith, Mukherjee, Zhang, Hou, Link and Richards2020; Lövdén et al., Reference Lövdén, Fratiglioni, Glymour, Lindenberger and Tucker-Drob2020; Schneeweis, Skirbekk, & Winter-Ebmer, Reference Schneeweis, Skirbekk and Winter-Ebmer2014; Wilson et al., Reference Wilson, Yu, Lamar, Schneider, Boyle and Bennett2019). People with higher educational levels tend to be, on average, healthier, live longer, and experience fewer instances of morbidity throughout their lives (Davies et al., Reference Davies, Dickson, Smith, van den Berg and Windmeijer2018). The component still up for debate is whether education is a correlational or rather a causal factor. Furthermore, there are several suggestions that higher levels of education in life not only affect cognitive ability but also may attenuate aging-associated declines in cognition (Livingston et al., Reference Livingston, Huntley, Liu, Costafreda, Selbæk, Alladi, Ames, Banerjee, Burns, Brayne, Fox, Ferri, Gitlin, Howard, Kales, Kivimäki, Larson, Nakasujja, Rockwood and Mukadam2024), although there is doubt regarding the latter (Lövdén et al., Reference Lövdén, Fratiglioni, Glymour, Lindenberger and Tucker-Drob2020).
Finally, sex emerged as another significant predictor of cognitive performance. In our sample, the observed trend indicates that women showed higher cognitive performance in verbal memory tasks and phonological verbal fluency. In non-clinical populations, women tend to demonstrate better performance in verbal episodic memory functions (Lundervold et al., Reference Lundervold, Wollschlager and Wehling2014; Sunderaraman et al., Reference Sunderaraman, Blumen, DeMatteo, Apa and Cosentino2013; Herlitz & Yonker, Reference Herlitz and Yonker2002). Moreover, a meta-analysis by Hirnstein et al. (Reference Hirnstein, Stuebs, Moè and Hausmann2023), including a sample of 355,173 participants, found that women outperform men in phonological fluency tasks but not in semantic fluency. Women also outperformed men in recall and recognition tasks.
In our study, we did not find a significant interactive effect between sociodemographic variables and cognitive performance. At this point, the literature remains at least inconclusive. In a cohort study conducted by Reas et al. (Reference Reas, Laughlin, Bergstrom, Kritz-Silverstein, Barrett-Connor and McEvoy2017), involving a sample of 2,225 community-dwelling participants aged 31–99 years at their initial cognitive assessment, interactive effects between age and sex were identified for trajectories of the Mini-Mental State Examination screening test and the TMT-B, with the latter showing a steeper decline in women than in men. However, in the same study, no significant interactions between demographic variables were observed for other cognitive measures, such as the TMT-A, Verbal Fluency, or the Buschke Selective Reminding Test. On the other hand, Heiskanen et al. (Reference Heiskanen, Nevalainen, Pahkala, Juonala, Hutri, Kähönen, Jokinen, Laitinen, Tossavainen, Taittonen, Viikari, Raitakari and Rovio2024) examined interactions among sex, age, and educational level in a longitudinal cohort from the Cardiovascular Risk in Young Finns Study. In that study, the sex×age and age×education interaction terms were not significant for any specific cognitive domain nor for overall cognitive performance. Nevertheless, a significant interaction between sex and educational level was identified for overall cognition, learning and memory, and information processing speed. In our sample, several explanations may be plausible. First, interaction effects tend to be domain-specific, and therefore large samples may be required to obtain stable and replicable estimates (Castillo et al., Reference Castillo, Miller, Vize, Baranger and Lynam2026). Second, differences in sampling characteristics may lead to inconsistencies across studies and difficulties in replicating interactive effects (Holzmeister et al., Reference Holzmeister, Johannesson, Böhm, Dreber, Huber and Kirchler2024; Olsson-Collentine et al., Reference Olsson-Collentine, Wicherts and van Assen2020). Taken together, and considering the heterogeneity of the existing evidence, further studies with greater robustness are likely needed to determine whether interactive effects are constrained to specific cognitive domains or are instead driven by particular population characteristics, and ultimately to clarify whether their influence on cognitive performance is additive or multiplicative in nature.
Finally, and in line with the previously stated need to adjust cognitive models for sociodemographic variables, it is important to note that several models (e.g., Digit Span) exhibit a low proportion of explained variance (2%). Given that a prior study reported a similar R 2 value for this task (Iñesta et al., Reference Iñesta, Oltra-Cucarella, Bonete-López, Calderón-Rubio and Sitges-Maciá2021), it is reasonable to infer that performance may depend on factors not captured by variables such as age, sex, or education, including individual differences in attentional processes or cognitive reserve. In the same vein, the discrepancies observed between the in-sample R 2 and the cross-validated R 2 in models with low explained variance (e.g., cross-validated R 2 = 0.04 vs. R 2 = 0.02) should not be interpreted as evidence of superior generalization. Rather, they reflect the inherent instability of estimation under low-fit conditions, which is consistent with limited predictive capacity. This pattern contrasts with that observed in other models, such as the RAVLT, where the convergence between both R 2 suggests greater stability of the estimates. Accordingly, in models with low explained variance, both the estimates and the resulting normative predictions should be interpreted with caution. In this context, the findings of the present study indicate that the relevance of adjusting for sociodemographic variables could be task-dependent: while some measures show low explained variance, others exhibit more consistent associations. Therefore, and in light of this differential pattern, the development of ND that incorporate sociodemographic variables into the modeling becomes particularly relevant.
Another important issue addressed in this article concerns the assumptions of the linear regression model. One of the most relevant assumptions is homoscedasticity. When this assumption is violated, standard error estimates may be biased, leading the model to overestimate or underestimate predictive precision in specific regions of the predictor space. To address violations of the homoscedasticity assumption, heteroskedasticity-consistent estimators were used to obtain robust standard errors for the regression coefficients. Another relevant assumption of the linear regression model is the normality of the residuals. This assumption implies that, once the systematic component of the model has been accounted for, the residuals are approximately normally distributed around zero. From an inferential perspective, violations of this assumption may affect the accuracy of classical t-tests and confidence intervals in small samples. However, previous work has demonstrated that even under extreme departures from normality, linear regression remains robust in moderate to large samples (Lumley et al., Reference Lumley, Diehr, Emerson and Chen2002). Consequently, residual non-normality is not expected to substantially bias the estimation of average effects in samples of sufficient size, although it may still affect the interpretation of extreme individual values.
This study addresses several critical gaps in the local neuropsychological field. First, there is a substantial lack of locally developed ND in Latin America, particularly in Argentina (Perez-Lao et al., Reference Perez-Lao, Ying, Arias, Levy and Smith2025). As a result, clinicians are often compelled to rely on norms derived from foreign populations (Fernández et al., Reference Fernandez, Ferreres, Morlett-Paredes, Rivera and Arango-Lasprilla2016). This limitation is especially relevant given the central role of neuropsychological assessment in the detection of subtle cognitive changes that inform diagnosis and treatment planning. In this regard, the present study provides a robust estimation of cognitive performance based on locally derived ND. Moreover, the availability of a ND-calculator ensures that these data can be implemented across diverse clinical and research settings. Second, traditional approaches to ND construction – typically based on stratification by age, sex, and education – may fail to adequately capture the continuous nature of cognitive performance and can introduce artificial score discontinuities at subgroup boundaries. In contrast, regression-based normative methods offer a statistically more efficient and ecologically valid alternative by modeling raw test scores as continuous functions of demographic variables.
Finally, our study addresses a common issue in our region, namely the use of foreign ND. By way of example, a study by Arango-Lasprilla et al. (Reference Arango-Lasprilla, Rivera, Rodríguez, Garza, Galarza-Del-Angel, Rodríguez, Velázquez-Cardoso, Aguayo, Schebela, Weil, Longoni, Aliaga, Ocampo-Barba, Saracho, Panyavin, Esenarro, Martínez, García de la Cadena and Perrin2015) developed regression-based ND for a series of Latin American countries (Argentina, Bolivia, Chile, Cuba, El Salvador, Guatemala, Honduras, Mexico, Paraguay, Peru, and Puerto Rico). That study illustrates the notable differential impact of sociodemographic variables on cognition, even among countries that share the same language. One such example is sex, for which the proportion of explained variance ranges from 1% to 23% across countries at different altitudes. It is therefore necessary to develop ND grounded in the national context and to discourage the importation of foreign norms.
This study has several limitations that should be acknowledged. A primary concern relates to the clinical nature of the sample. Although participants were selected to represent cognitively healthy individuals, recruitment through clinical sites may limit the generalizability of the regression estimates and introduce potential biases in error structure and measurement. To mitigate this issue, strict inclusion criteria were applied, including normal performance on a global cognitive screening measure (MoCA) and on a sensitive verbal memory task (Craft Story), which is frequently affected in the early stages of neurodegenerative disorders. In addition, intact functional status was required, as assessed by the FAQ, a measure with strong psychometric properties and demonstrated accuracy in discriminating normal cognition from mild cognitive impairment and dementia (González et al., Reference González, Gonzales, Resch, Sullivan and Soble2022). In this line, it should be acknowledged that the inclusion of the Craft Story 21 criterion relies on ND that have not been developed at the national level. Future studies will need to establish ND for logical memory tests within the region. Another limitation concerns sample representativeness. Despite its relatively large size, the sample may not fully capture the regional, educational, and socioeconomic diversity of the Argentine population. Likewise, our normative sample consists predominantly of individuals older than 60 years. Caution is therefore warranted when generalizing these findings to populations aged 50 to 59 years, and the potential estimation error of the model coefficients should be taken into account. Future studies should aim to expand recruitment across provinces and cultural contexts in order to enhance population-level validity. Finally, the use of linear models – particularly Gaussian models – in neuropsychological testing overlooks the structural assumption regarding the bounded nature of the dependent variable. Because cognitive scores often exhibit lower and upper limits, this approach may be suboptimal, especially at the extremes of the distribution. Future studies should employ alternative approaches, such as Bayesian methods, which allow for the explicit modeling of bounded dependent variables through distributions with restricted support, the incorporation of relevant information about score structure and variance, and the derivation of more robust inferences.
Future studies could address these limitations by incorporating multi-center samples and by more comprehensively evaluating the validity of regression-based ND using explicit training, testing, and validation frameworks. In addition, the use of penalized linear models, such as LASSO or Elastic Net, may be advantageous for variable selection and parameter estimation in larger and more heterogeneous datasets, particularly when the number of predictors is relatively high and multicollinearity among sociodemographic variables is present. Although model specification may become less transparent - especially when tuning parameters are selected via cross-validation – predicted scores can still be derived from the fitted models. In such cases, the availability of accessible computational tools (e.g., open-access calculators) becomes particularly important to ensure the practical implementation of the resulting ND.
Conclusion
This study could represent an important contribution to neuropsychological practice in Latin America by providing a regression-based normative framework and an accessible tool for cognitive assessment. By addressing critical gaps in local ND and implementing a more ecologically valid statistical approach, this work enhances the accuracy and applicability of neuropsychological evaluations in Buenos Aires – Argentina. Future research should consider additional cognitive domains and leveraging more advanced modeling techniques in order to improve ND representativeness.
Supplementary material
The supplementary material for this article can be found at https://doi.org/10.1017/S1355617726101994.
Acknowledgements
None.
Funding statement
This research did not receive any specific grant from funding agencies in the public, commercial, or not-for-profit sectors.
Competing interests
The authors declare that they have no competing interests.