
I. INTRODUCTION
Lead-based relaxor ferroelectric single crystals, Pb(Zn1/3Nb2/3)O3–PbTiO3 (PZN–PT), have received considerable attention owing to their excellent dielectric and piezoelectric properties with the composition near the morphotropic phase boundary (MPB). Reference Wang, Zhang, Sun and Cao1,Reference Liu, Zhang, Wang, Ren, Zhang, Jiao, Zhao and Luo2 The MPB of PZN–PT single crystals is well known to be located at the composition range of x = 9 – 11, Reference Rajan, Shanthi, Chang and Jin3 which is considered as a interesting region connecting the rhombohedral and tetragonal ferroelectric phases. Reference Liu, Zhu, Chen, Fang, Ding, Zhao, Xu and Luo4 Such excellent relaxor ferroelectrics have been widely used in medical ultrasound imaging, resonant actuators, and underwater communication due to their larger piezoelectric coefficient and dielectric permittivity. Reference Touhtouh, Hajjaji, Boughaleb, Benkhouja, Arbaoui, Rguiti and Guyomar5,Reference Lebrun, Sebald, Guiffard, Richard, Guyomar and Pleska6 However, the lower rhombohedral to tetragonal phase transition (T R–T, ∼80 °C) could induce the depoling at low temperature and inhibit PZN–PT single crystal development. Reference Li, Li, Liu, He, Shen and Long7,Reference Ai, Li, Wang, Liu, He, Li, Chu, Pang, Tailor and Long8 In addition, the low coercive fields also restrict the ferroelectric phase transition of the relaxor ferroelectrics. (E C, ∼2 to 3 kV/cm). Reference Zhang and Shrout9
Investigations have revealed that the addition of rare-earth ions not only improves the electrical properties of the ceramics with the perovskite structure, but also gives rise to upconversion (UC) luminescence. Reference Li, Xu, Chu, Fu and Zang10,Reference Diez-Betriu, Garcia, Ostos, Boya, Ochoa, Mestres and Perez11 The UC luminescence is the process of higher energy photon with shorter wave length generated from lower energy photons with longer wave length by multiphoton absorptions or ETs. Reference Wei, Wang, Zhao, Dong and Wang12 These UC materials are currently considered as the promising candidate in biosensors, display devices, and solid-state lasers. Reference Li, Xu, Chu, Fu and Zang10 Among the all rare-earth ion options, the erbium ion (Er3+) is the most popular dopant because of its favorable UC characteristic with 4I15/2 → 4I11/2 transition excited by commercial low-cost laser diodes. Reference Sun, Zhang, Wang and Gu13,Reference Dong, Xu, Wang, Yang and He14 As the prototypical example shown, Li et al. Reference Li, Xu, Chu, Fu and Zang10 produced (Ba0.99Ca0.01) (Ti0.08Zr0.02)O3 ceramics by modification with Er3+ ions, they found that the temperature stabilities of piezoelectric properties were greatly enhanced and the Curie temperature (T C) shifted toward high temperature. Furthermore, bright green and weak red emission bands were obtained under excitation (980 nm) at room temperature. The substitution of manganese (Mn) and iron (Fe) for the PZN–PT single crystals is primarily investigated. Reference Sun, Zhang, Wu, Yang and Cao15 However, studies focusing on rare-earth ion modification for PZN–PT single crystal are nearly limited.
In the present work, the pure and Er3+-modified Pb(Zn1/3Nb2/3)O3–9PbTiO3 (PZN–9PT) single crystals were grown by using flux method. The effects of Er3+ ions on the electrical properties and UC luminescence of PZN–9PT single crystals were investigated. The UC mechanism also was discussed. Moreover, the dielectric relaxor behavior of the as-grown single crystals was characterized using modified Curie–Weiss law.
II. EXPERIMENTAL PROCEDURE
The pure and Er3+-modified PZN–9PT single crystals were grown spontaneously by using flux method. The reagent-grade oxide powders, namely, PbO (99.99%), ZnO (99.99%), TiO2 (99.99%), Nb2O5 (99.99%), and Er2O3 (99.99%), were used as the starting materials. The columbite precursor, ZnNb2O6, was prefabricated to obtain pure perovskite phase at 1050 °C for 6 h by the two-step method. Then the ZnNb2O6 precursor combined with PbO, TiO2 according to the stoichiometric composition of 91PZN–9PT, and 2 wt% of Er2O3 (total mass) were weighed and mixed in the polyethylene jar and wet-milled for 12 h. The mixed powder was placed into a platinum crucible and grown in the furnace equipped with an automatic temperature controller to melt. Finally, the [110]-oriented single crystals were cut. The dimensions of PZN–9PT and Er3+-modified PZN–9PT single crystal specimens were about 7 × 4 × 0.7 and 2 × 2 × 0.5 mm3, respectively. Then a silver paste was daubed on two sides and then heated at 550 °C for 30 min to serve as the electrodes in the dielectric and ferroelectric properties measurement.
The phase analysis of the as-grown single crystals was characterized by the x-ray diffraction (XRD) analysis (D/Max2550VB+/PC, Rigaku Corporation, Tokyo, Japan) with Cu Kα radiation. The XRD measurements were carried out over an angular range of 10°–80° with a scanning step of 0.02° and a fixed counting time of 2 s. The lattice parameters of the perovskite structure were refined by the Rietveld method. The dielectric permittivity and loss were measured from room temperature to 400 °C at a heating rate of 3 °C/min and frequency range of 100 Hz to 100 kHz using an automatic system equipped with a temperature-controlled chamber (E4980/GJW-I). The remnant polarization (P r) was also determined from a polarization versus electric field (P–E) hysteresis loop measurement at room temperature by using a ferroelectric test system (Radiant Precision Premier II, Radiant Technologies, Inc., Albuquerque, New Mexico). The optical absorption spectra were detected using Cary Series UV–Vis–NIR Spectrophotometer (Agilent, Santa Clara, California). The UC spectra were measured by a power controllable 980 nm laser diode.
III. RESULTS AND DISCUSSION
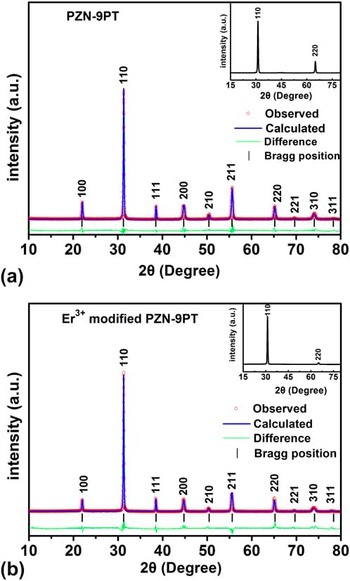
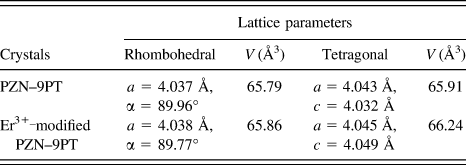
Figure 1 shows the XRD patterns of the as-grown single crystals and the [110]-oriented single crystal specimens. The pure perovskite structure of the as-grown single crystals was indexed and no secondary phase was detected, indicating that the Er3+ ions diffused well into the crystal lattice of the PZN–9PT single crystals. In the previous investigation, the phases of the PZN–PT single crystals have been reported. Cox et al. Reference Cox, Noheda, Shirane, Uesu, Fujishiro and Yamada16 has shown the presence of the orthorhombic phase. Kiat et al. Reference Kiat, Uesu, Dkhil, Matsuda, Malibert and Calvarin17 have reported the coexistence phase between the monoclinic Pm and tetragonal P4mm phase. While Srimathy et al. Reference Srimathy, Jayavel, Bhaumik, Ganesamoorthy, Karnal, Gupta and Kumar18 revealed the rhombohedral R3m and tetragonal P4mm phases in the Nd and Cr doped Pb(Zn1/3Nb2/3)O3–PbTiO3 single crystals. The pseudovoigt function profile was used to fit the XRD patterns. The results of the Rietveld refinement are presented in Figs. 1(a) and 1(b), respectively. The rhombohedral R3m and tetragonal P4mm phases were determined by the fitting between the observed and calculated profiles. The refined lattice parameters of the PZN–9PT and Er3+-modified PZN–9PT single crystals are shown in Table I. It was found that the lattice parameters of the Er3+-modified PZN–9PT single crystals were bigger than that of PZN–9PT single crystals, which could deduce that the Er3+ ions with the larger radius [r (Er3+) = 0.88 Å] replaced the B position ions with smaller radius [r (Zn2+) = 0.74 Å and r (Nb5+) = 0.70 Å]. Furthermore, it was obviously observed that the single crystal specimens were well oriented and the diffraction peaks corresponded to the [110] plane in the insets of Figs. 1(a) and 1(b).
X-ray powder diffraction patterns of the as-grown single crystals. (a) and (b) The results of the Rietveld refinement for the PZN–9PT and Er3+-modified PZN–9PT single crystals, respectively. The dotted-line and solid lines represent the observed and calculated profile, respectively. The vertical solid lines and curve are the standard Bragg positions and the difference, respectively. The insets are the XRD patterns of the [110]-oriented crystals.

Lattice parameters and volumes of the as-grown single crystals determined by the Rietveld refinement.

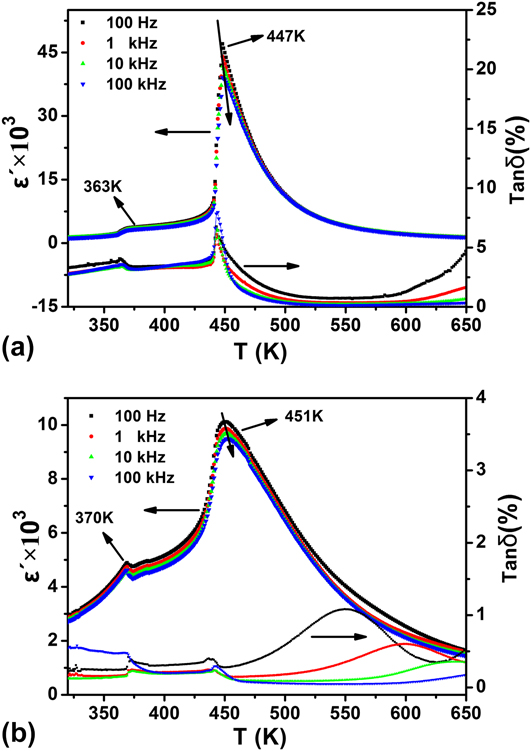
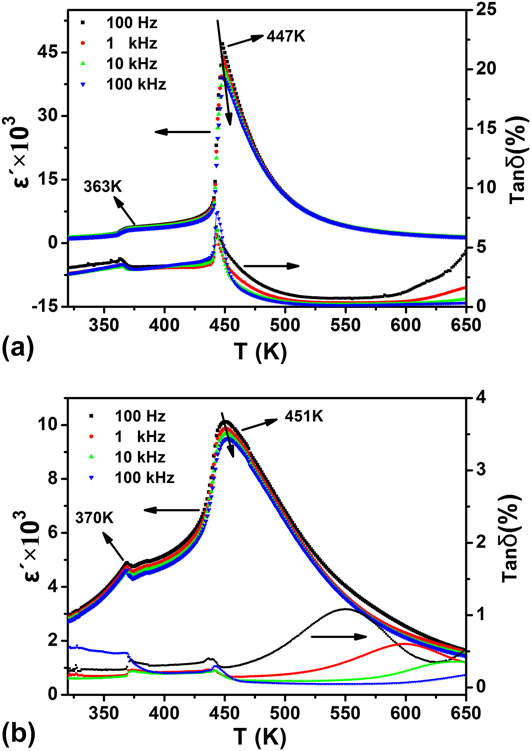
Figure 2 shows the temperature dependence of the dielectric permittivity and dielectric loss of the [110]-oriented as-grown single crystals at different frequencies (100 Hz–100 kHz). Two dielectric peaks were observed in the PZN–9PT and Er3+-modified PZN–9PT single crystals during heating within these frequencies. One of the peaks corresponded to T R–T and the other to T C. The T R–T and T C of the PZN–9PT crystals were approximately 363 and 447 K, respectively; after modification with Er3+ ions, the T R–T and T C reached 370 and 451 K. Moreover, a low dielectric loss tan δ was found (<1%), whereas the loss of the PZN–9PT single crystals was higher than that of Er3+-modified PZN–9PT single crystals; this observation was related to the conductivity induced by defects due to the modification of Er3+ ions.
Temperature dependence of the dielectric permittivity at different frequencies (100 Hz–100 kHz) of the (a) [110]-oriented PZN–9PT single crystals and (b) [110]-oriented Er3+-modified PZN–9PT single crystals.
The dielectric permittivity of the normal ferroelectrics above the Curie temperature T C should generally follow the Curie–Weiss law:
 $$1/\varepsilon ' = {{\left( {T - {T_{{\rm{CW}}}}} \right)} \over C}\quad ,$$
where C is the Curie–Weiss constant and T CW is the Curie–Weiss temperature. However, the empirical modified Curie–Weiss law is usually used in characterizing the dielectric relaxor behavior of the as-grown single crystals near the MPB. Reference Choi, Shrout, Jang and Bhalla19,Reference Kirillov and Isupov20
 $$1/\varepsilon ' - 1/{\varepsilon '_{\rm{m}}} = {{{{\left( {T - {T_{\rm{m}}}} \right)}^\gamma }} \over {2{{\varepsilon '}_{\rm{m}}}{\delta ^\gamma }}}\quad ,$$
where ε′ is the dielectric permittivity above the Curie temperature,
 ${\varepsilon '_{\rm{m}}}$
is the maximum value of the dielectric permittivity, δ is the degree of diffuseness of the dielectric permittivity peaks in relaxors, and γ characterizes diffused temperature dependence of dielectric permittivity. Generally, γ = 1, describes the normal ferroelectrics, γ = 2, represents the relaxor ferroelectrics.
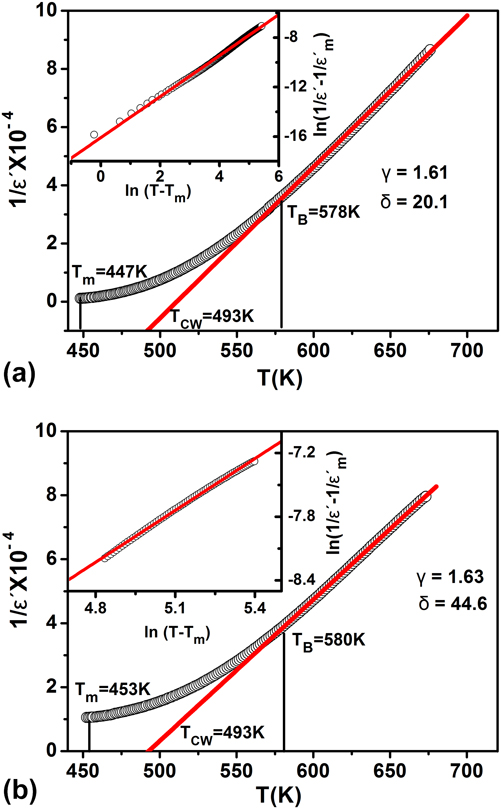
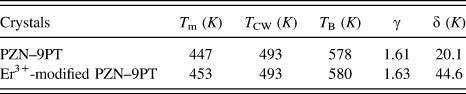
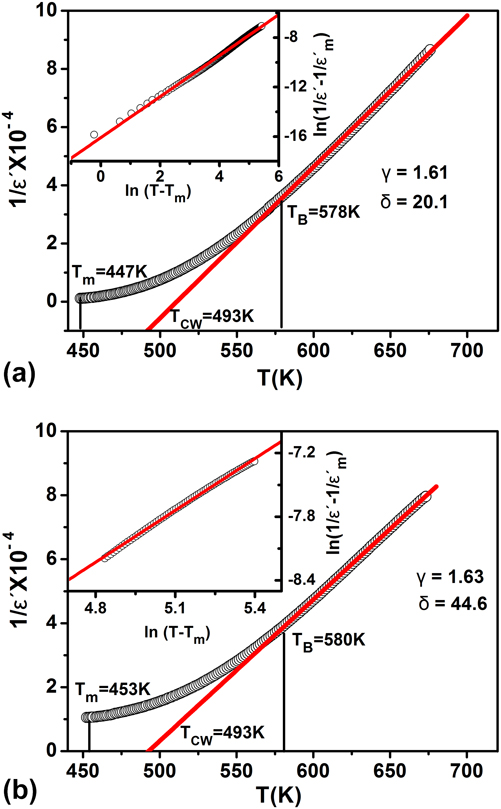
Figure 3 shows the inverse of dielectric permittivity as a function of temperature at 100 kHz in the PZN–9PT and Er3+-modified PZN–9PT single crystals. The Burns temperature T B expresses the temperature that starts to conform to the Curie–Weiss law. The experimental dates were well fitted by Eq. (2). The fitted parameters are presented in Table II. The γ values of the PZN–9PT and Er3+-modified PZN–9PT single crystals were 1.61 and 1.63, respectively. The δ value of the PZN–9PT single crystals ranged from 20.1 to 44.6 by the modification of Er3+ ions, indicating that adding Er3+ enhanced the degree of diffuseness for the PZN–9PT single crystals. Moreover, the discrepancy between T CW and T m demonstrated the dielectric relaxor-like characterization of the as-grown single crystals, which was consistent with the previous reports. Reference Long and Ye21,Reference Xi, Bu, Fang, Long and Li22
Inverse of dielectric permittivity as a function of temperature at 100 kHz in the (a) PZN–9PT single crystals and (b) Er3+-modified PZN–9PT single crystals (the solid line and symbols indicate the fitting to the Curie–Weiss law and the experimental data, respectively; insets show the fitting to the modified Curie–Weiss law above the Burns temperature T B).
The fitting result for the as-grown single crystals with the modified Curie–Weiss law at frequency of 100 kHz.
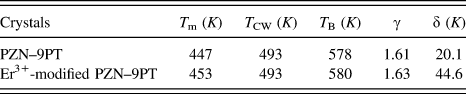
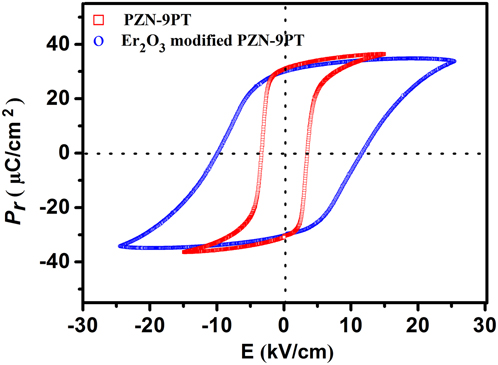
Figure 4 shows the P–E of the as-grown single crystals at 1 kHz. Saturated P–E loops were observed under an external field of ±15–25 kV/cm at room temperature. The P r of the as-grown single crystals was nearly 30.8 μC/cm2. However, the E C of the Er3+-modified PZN–9PT single crystals was 11.6 kV/cm higher than that of the PZN–9PT crystals (E C, ∼3.5 kV/cm). The enhancement of E C for the PZN–9PT single crystals was attributed to the defect dipoles induced by modification with Er3+ ions. When the single crystals were poled at the external field, the defect dipoles that were parallel to the spontaneous polarization attempted to elongate to reduce electrostatic energy by the local piezoelectric properties. While the defect dipoles, antiparallel to the spontaneous polarization, tried their best to contract at the same rate of elongation. Therefore, the stress was generated under the interaction of both type of defect dipoles, which inhibited the motion of domains and leaded to the increase of E C. Reference Srimathy, Jayavel, Bhaumik, Ganesamoorthy, Karnal, Gupta and Kumar18
Polarization versus electric field (P–E) of the PZN–9PT and Er3+-modified PZN–9PT single crystals.
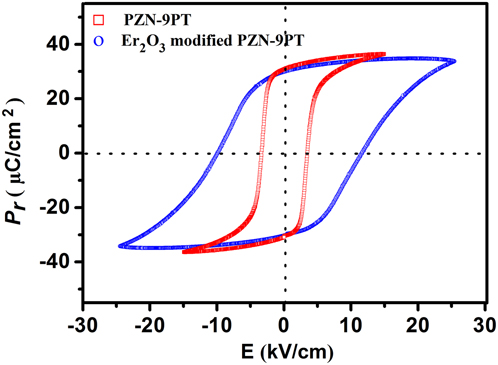
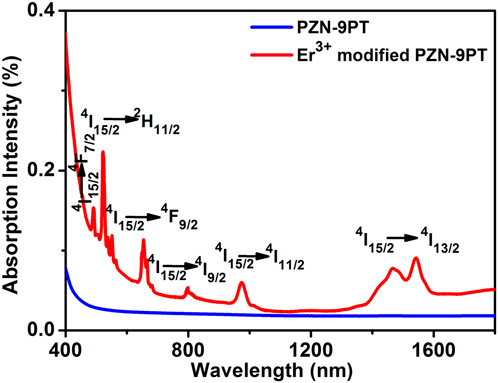
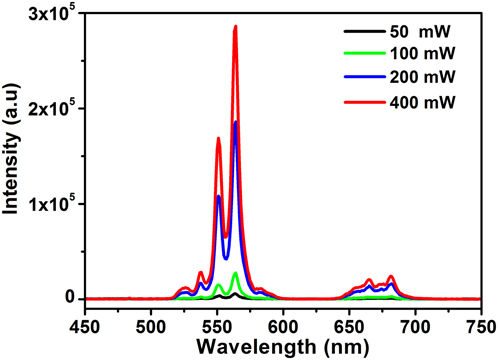
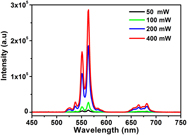
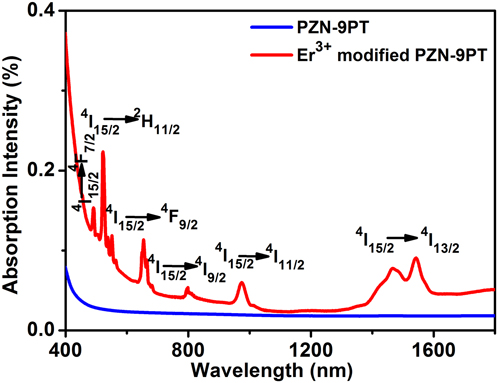
Figure 5 shows the absorption spectra of the PZN–9PT and Er3+-modified PZN–9PT single crystals in wave length range of 400 nm–1800 nm. Compared with the PZN–9PT single crystals, the absorption bands were observed in the Er3+-modified PZN–9PT single crystals from Er3+ ground state to the excited states. The UC emission spectra of the Er3+-modified PZN–9PT single crystals under 980 nm excitation at different powers are presented in Fig. 6. As can been seen, the intensity of luminescence was remarkably increased with the increase of the excited power. The red emission bands between 660 and 680 nm corresponded to 4F9/2 → 4I15/2 transition. The weak emission band at about 525 nm was due to Er3+ transition: 2H11/2 → 4I15/2. While the strongest green emission band centered at around 550 nm was attributed to 4S3/2 → 4I15/2 transition, which indicated that the PZN–9PT single crystals could become one of the potential UC host materials.
Absorption spectra of the PZN–9PT and Er3+-modified PZN–9PT single crystals in wave length range of 400 nm–1800 nm.
UC emission spectra of the Er3+-modified PZN–9PT single crystals under 980 nm excitation at different power (50 mW–400 mW).
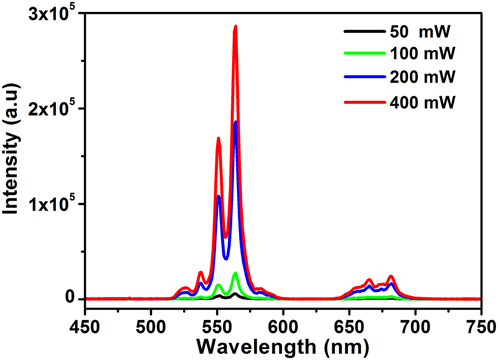
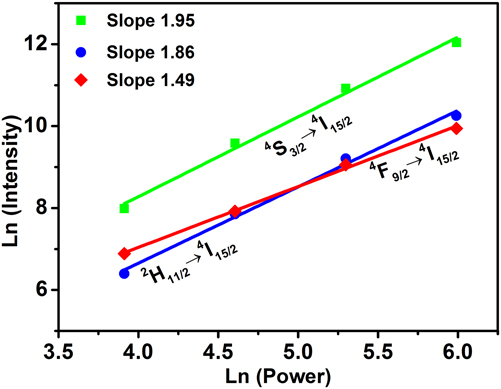
Figure 7 shows the power dependence of the UC emission intensities of Er3+ modified PZN–9PT single crystals. For an unsaturated UC process, the emission intensity I UC depended on the pumping power I pump conforming to the equation Reference Sun, Zhang, Wang and Gu13 :
 $${I_{{\rm{UC}}}}\; \propto\; I_{{\rm{pump}}}^n\quad ,$$
where n is number of pumping photons producing an UC photon. The slope of a double-logarithmic plot of UC emission intensity versus pump power is usually used to investigate the UC mechanism and the number of photons in the UC process. The results of UC emission bands around 525, 550, 670 nm are presented in Fig. 7. The calculated slope values of n were 1.86 and 1.95 for the green emission, respectively. This proved that two excitation photons contributed to one UC photons. Whereas the slop n value of the red emission obviously deviated from 2, which could be related to the competition between the linear decay and the UC process for the depletion of the intermediate excited states. Reference Wang, Zhang, Xu and Xing23
Power dependence of the upconversion emission intensities of Er3+-modified PZN–9PT single crystals.
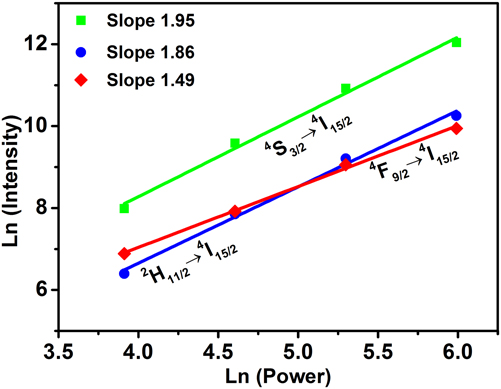
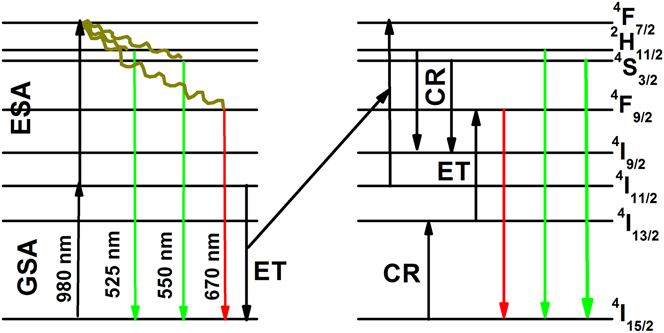
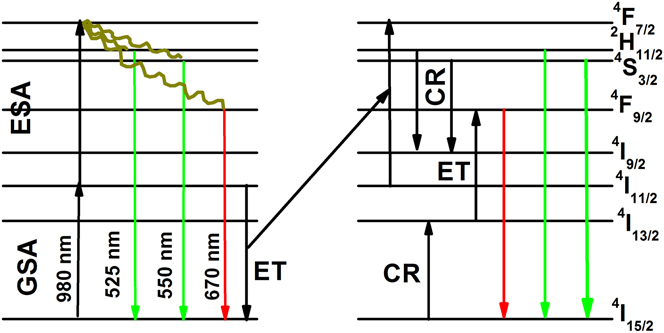
Figure 8 shows the schematic energy level diagram for the UC mechanism of Er3+-modified PZN–9PT single crystals for the green and red emission. The involved UC mechanisms have been investigated in some reports. Reference Wang, Luo, Huang, Li and Wang24,Reference Yao, Luo, Zuo, Li and Zhou25 Firstly, the 980 nm laser light excited the Er3+ ions from the ground state 4I15/2 to the excited state 4I11/2 through the ground state absorption process. Then, the Er3+ ions populated at the 4I11/2 level were excited to the 4F7/2 level through the excited state absorption (ESA) or energy transfer. Subsequently, a nonradiative relaxation take place from the 4F7/2 level to the mixed 2H11/2 + 4S3/2 and 4F9/2 levels. Finally, the Er3+ ions relaxed to the ground state. Therefore, the green (2H11/2 + 4S3/2 → 4I15/2) and the red (4F9/2 → 4I15/2) bands were observed. Furthermore, the cross relaxation (CR) could also occur in the red emission band, namely, 2H11/2 + 4S3/2 → 4I9/2 and 4I15/2 → 4I13/2. The levels 4I9/2 and 4I13/2 were populated. The Er3+ ions located at 4I9/2 level could nonradiatively relax to the lower levels 4I11/2 and 4I13/2 or radiatively decay to the ground state. The Er3+ ions at 4I13/2 level could not only radiatively decay to the ground state but also follow an UC promotion to the level 4F9/2 through ET process: (4I13/2 + 4I11/2) → (4F9/2 + 4I15/2), which promoted that the red emission was obtained in the radiative transition from the 4F9/2 to 4I15/2 level. Reference Sun, Zhang, Wang and Gu13,Reference Dai, Du, Xu, Xu and Luo26
Energy level diagram of Er3+-modified PZN–9PT single crystals and possible upconversion mechanisms excited at 980 nm.
IV. CONCLUSION
The pure and Er3+-modified PZN–9PT single crystals were successfully grown by using the flux method. The as-grown single crystals had the single perovskite structure. T R–T and T C of PZN–9PT single crystals were about 363 and 447 K, respectively. Those of Er3+-modified PZN–9PT single crystals were around 370 and 451 K, respectively. The ferroelectric performance and dielectric relaxor behavior of these single crystals were effectively enhanced by modification with Er3+ ions. The E C was increased to 11.6 kV/cm from 3.5 kV/cm. The γ values of as-grown single crystals were respectively 1.61 and 1.63. The δ values ranged from 20.1 to 44.6 by the modification of Er3+ ions. Moreover, the very strong green and weak red UC emission bands were observed in the Er3+-modified PZN–9PT single crystals, which demonstrated that the Er3+ modified PZN–9PT single crystals could be the promising candidate for the green UC devices.
ACKNOWLEDGMENTS
This work was supported by the National Basic Research Program of China (973 Program) (Grant No. 2013CB632900), the National Natural Science Foundation of China (Grant No. 51472197), and the Scientific Research Plan Projects of Shaanxi Provincial Education Department (Grant No. 15JK1345).