1 Introduction
Confronting measurement error in statistical research in political science and other disciplines has a lengthy history. Hausman (2001, p. 57) states, “The effect of mismeasured variables in statistical and econometric analysis is one of the oldest known problems.” Asher (1974, 469) argues that “a more subtle problem of secondary analysis is that the investigator often has little feel for the quality of the data, for the extent and nature of the measurement error in the data.” Nonetheless, the issue is often ignored by researchers. When it is not ignored, the focus is almost exclusively on classical measurement error. Here, “classical” refers to mean zero errors that are independent of covariates and the stochastic disturbance in the model; Asher (Reference Asher1974) refers to this as the case of “random” measurement error. Imai and Yamamoto (Reference Imai and Yamamoto2010, 543) conclude that “existing research has either completely ignored the problem or exclusively focused on classical measurement error in linear regression models where the error is assumed to arise completely at random.”
The focus on classical measurement error is particularly true in the case of mismeasurement of a continuous dependent variable in a linear regression framework. Here, classical measurement error reduces precision, but does not bias estimates. However, the assumption of classical measurement error is often invoked without any formal justification. In practice, a frequently encountered situation of nonclassical measurement error in the dependent variable occurs when the outcome is systematically over- or under-reported, resulting in measurement error that is skewed with nonzero mean; termed “nonrandom” in Asher (Reference Asher1974).
Skewed measurement errors, of which one-sided measurement errors are a special case, are likely to be a feature of many outcome variables used in political science research. Consider measures of the severity of civil conflict as an example. Measures of conflict intensity (e.g., casualties) are derived from either government reports, media accounts, or third-parties such as humanitarian groups. Each data source has its own unique challenges. Official government statistics face deficiencies related to insufficient resources and political manipulation. For example, Krueger and Laitin (Reference Krueger and Laitin2004, 8) state that “terrorism reports produced by the U.S. government do not have nearly as much credibility as its economic statistics, because there are no safeguards to ensure that the data are as accurate as possible and free from political manipulation.” Media accounts risk missing data from remote areas (Wiedmann Reference Wiedmann2016). Third-parties face tension between providing accurate data and other objectives. For instance, Lacina and Gleditsch (2012, p. 1118) state that the Peace Research Institute Oslo battle deaths data may overstate the true death toll due to a “blurring between expertise and advocacy” as “experts may overestimate deaths because they seek to draw attention to ongoing conflicts or to underline the importance of the conflict on which they specialize.”
Similarly, official death tolls from natural disasters may suffer from skewed measurement error. Consider the recent crisis in Puerto Rico arising from Hurricane Maria. Kishore et al. (Reference Kishore2018) claim that the official death toll may severely understate the true loss of life. The authors state: “Accurate estimates of deaths, injuries, illness, and displacement in the aftermath of a disaster such as Hurricane Maria are critical…However, public health surveillance is extremely challenging when infrastructure and health systems are severely damaged. In early December 2017, the official death count in Puerto Rico stood at 64, but several independent investigations concluded that additional deaths attributable to the hurricane were in excess of 1,000 in the months of September and October.” Kishore et al. (Reference Kishore2018) estimate the death toll at 4,645.
Other examples of outcomes that may suffer from skewed measurement error abound. Katz and Katz (Reference Katz and Katz2010) discuss measurement error in self-reported voting behavior. Using validation data for elections over the period 1964–1990, the authors find that between 13% and 25% of self-reported voters did not vote; at most 4% of self-reported nonvoters did vote. The highly skewed errors at the individual level mean that aggregate measures of self-reported voter turnout will suffer from one-sided measurement error. Measurement of corruption, or criminal activity more generally, may also suffer from one-sided measurement error. Goel and Nelson (Reference Goel and Nelson1998) and subsequent research on corruption in the United States utilize data on the number of public officials convicted for abuse of office. This measure only captures illegal activities that are discovered and prosecuted. Measurement of local pollution, necessary for analyses of environmental justice or other determinants of local environmental conditions, may also suffer from one-sided measurement error. For example, Daniels and Friedman (Reference Daniels and Friedman1999) and others rely on self-reported emissions by establishments in the United States obtained from the Toxic Release Inventory. The self-reported and public nature of the data make systematic under-reporting likely. Finally, survey data on actions or attitudes that may lead to social judgement may suffer from skewed measurement error, including data on political or charitable contributions, attitudes concerning racial or ethnic issues, etc.
With skewed measurement error in the dependent variable in a linear regression framework, the consequences extend beyond a loss in precision. Ordinary Least Squares (OLS) will no longer provide an unbiased estimate of the intercept (due to the nonzero mean of the composite error term) and may no longer provide unbiased estimates of the slope parameters if the skewed measurement error is heteroskedastic. Moreover, Instrumental Variable (IV) estimation, the traditional solution to measurement error when it is addressed econometrically, is not a viable solution as any potential instruments will necessarily be invalid. As a result, the typical response in political science and elsewhere is to ignore the issue. For example, Wiedmann (Reference Wiedmann2016, 206–207) states: “Thus, for scholars trying to explain the occurrence of political violence, this means that their dependent variable may be measured with error. This alone would not be a problem if this error was random; however, as is well known, systematic measurement error that is correlated with an independent variable can introduce statistical bias and lead to erroneous conclusions. Both conceptually and methodologically, the new wave of event-level analysis has not taken this issue serious enough.”
However, solutions are available, but have rarely been used by researchers; never in political science to our knowledge. Our objective is to draw attention to these solutions and assess their performance via simulations and three replications.
The first solution entails directly modeling the measurement error assuming it stems from a particular parametric distribution.Footnote 1 Techniques to accomplish this are well-developed in the literature on efficiency modeling (Aigner, Lovell, and Schmidt Reference Aigner, Lovell and Schmidt1977; Parmeter and Kumbhakar Reference Parmeter and Kumbhakar2014). Specifically, stochastic frontier analysis (SFA) allows for the composite error term to include a one-sided component (which can either be non-negative or nonpositive) and a two-sided idiosyncratic component. While the one-sided error component is traditionally viewed as capturing inefficiency, one may instead interpret it as skewed measurement error; this stems from the statistics literature on closure properties related to many common skewed distributions. Moreover, heteroskedasticity in the skewed error may be accommodated in the estimation. SFA is now quite common; it is available in software packages such as Stata, SAS, and R. The second solution is similar to SFA, but involves Nonlinear Least Squares (NLLS) rather than maximum likelihood. NLLS replaces the distributional assumptions in SFA with an assumption referred to as the scaling property. Again, NLLS is available in software packages such as Stata, SAS, and R.
To the best of our knowledge, the first paper to utilize SFA to address one-sided measurement error in the dependent variable is Hofler and List (Reference Hofler and List2004). Subsequent research using SFA to address one-sided measurement error in the dependent variable has remained confined to the analysis of auction data where systematic over- or under-bidding may be common (e.g., Kumbhakar, Parmeter, and Tsionas Reference Kumbhakar, Parmeter and Tsionas2012) or population and mortality data (Anthopolos and Becker 2010).
We make several contributions to this literature. First, we consider the case of skewed measurement error in the outcome variable. Prior applications focus exclusively on one-sided measurement error. As illustrated in Katz and Katz (Reference Katz and Katz2010) with regards to self-reported voting behavior, often the outcome variable suffers from skewed, rather than strictly one-sided, measurement error. Second, whereas prior papers using stochastic frontier (SF) models to address one-sided measurement error use the methodology for a specific application, we provide a rigorous analysis of the issue. This entails quantifying the impact on parameter estimates via simulations, as well as offering recommendations for researchers when confronting skewed measurement error. Finally, as the existing literature does not discuss the potential for NLLS under the scaling property to circumvent the need for distributional assumptions when confronting skewed or one-sided measurement error, we fill this gap.
Our results are striking. First, the simulations document that even a small amount of systematic, one-sided measurement error can lead to severe bias. Second, while correctly specified SFA and NLLS offer a solution, misspecification of the error components can have dire consequences. Third, the simulations confirm the superiority of SFA and particularly NLLS (in large samples) over ignoring measurement error when the errors are skewed instead of strictly one-sided. Finally, our three replications demonstrate that accounting for one-sided measurement error is important when evidence of heteroskedasticity is present.
2 Measurement Error in The Dependent Variable
To begin, we discuss one-sided measurement error as it illustrates the main empirical challenges. After, we consider the general case of skewed measurement error.
2.1 The Impact of One-Sided Measurement Error
Consider the following linear in parameters model
 $$ \begin{align} y_{i}^{\ast }=x_{i}\beta +v _{i}, \end{align} $$
where
 $y_{i}^{\ast }$
is the true measure of interest, such as the number of deaths during conflict i,
 $x_{i}$
is the set of covariates, and
 $v _{i}$
is a classical error term. In this setting, OLS will produce unbiased and consistent estimates of
 $\beta $
. Moreover,
 $ x_{i}\beta $
can be interpreted as the conditional expectation of
 $y^{\ast }$
given x,
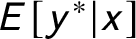 $E[y^{\ast }|x]$
.
Suppose one has access to a random sample,
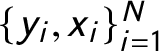 $\{y_{i},x_{i}\}_{i=1}^{N}$
, where
 $y_{i}$
is the observed value of
 $y^{\ast }$
. In the absence of measurement error, these measures coincide and
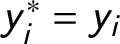 $y_{i}^{\ast }=y_{i}$
. However, with either over- or under-reporting, we have
 $$ \begin{align} y_{i}=y_{i}^{\ast }+su_{i}, \end{align} $$
where
 $u_{i}\geq 0$
for all i and
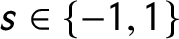 $s\in \{-1,1\}$
. When
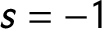 $s=-1$
(
 $s=1$
) values of
 $y^{\ast }$
are systematically under- (over-)reported. The estimating equation is
 $$ \begin{align} y_{i}=x_{i}\beta +v_{i}+su_{i}=x_{i}\beta +\varepsilon _{i}. \end{align} $$
The consequences of one-sided measurement error exceed those arising from classical measurement error. Whereas classical measurement error leads to a loss in precision, one-sided measurement error can potentially lead to substantial bias in the coefficient estimates. To see this, note that due to the one-sided nature of the measurement error,
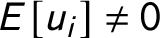 $E[u_{i}]\neq 0$
. Thus, OLS applied to (3) will estimate the conditional mean
 $ E[y|x]=E[y^{\ast }|x]+E[u|x]$
.
For practitioners, the source of the bias does not matter, but it likely does have an impact on whether there exists an expectation of bias. For instance, even a naïve researcher might realize that there are known issues with corruption data, but not necessarily with voter turnout data. While there is a difference in skewness arising from missingness due to case censoring (e.g., corruption data) versus respondent misreporting (e.g., voter turnout data), the issue may be handled directly by modeling the skewness in both settings.Footnote 2
To assess the impact of this one-sided error, recall that OLS produces estimates that ensure the residuals are mean zero. Thus, the model that is estimated is
 $$ \begin{align} y_{i}=\beta _{0}+x_{i}\beta +\varepsilon _{i}=\big(\beta _{0}+sE[u]\big)+x_{i}\beta +\big( \varepsilon _{i}-sE[u]\big) , \end{align} $$
where we now explicitly include the intercept,
 $\beta _{0}$
, and redefine
 $ x $
to include only the model covariates with associated parameter vector,
 $ \beta $
. Here, the main impact of one-sided measurement error is on the intercept. However, this assumes that the one-sided error is not systematic. If, alternatively, the level of over- or under-reporting depends on observable characteristics, the impact can be far more damaging.
Assume the level of over- or under-reporting depends on x. For example, in conflict research, the under-reporting of deaths may be a function of communication technology, and such technology may also be a direct determinant of conflict (Wiedmann Reference Wiedmann2016). In such a situation, the variance of the one-sided measurement error will depend on x. However, heteroskedasticity affects not only the variance of
 $u_{i}$
, but also its conditional mean. Formally, with one-sided, heteroskedastic measurement error,
 $E[u|x]\neq E[u]\neq 0$
.Footnote
3
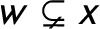
Moreover, the nature of the problem ensures that any potential instrument (i.e., a variable
 $w\varsubsetneq x$
such that
 $Cov(w,x)\neq 0$
) will be invalid. Finally, Wang and Schmidt (Reference Wang and Schmidt2002) show that the OLS estimates of
 $\beta $
will also be biased if the variance of u depends on some other covariates z, where
 $z\varsubsetneq x $
, unless z and x are independent.
In sum, in the presence of one-sided, heteroskedastic measurement error, the estimating equation becomes
 $$ \begin{align} y_{i}=\beta _{0}+x_{i}\beta +sE[u|x]+( \varepsilon _{i}-sE[u|x]). \end{align} $$
Thus, estimation of the conditional mean results in an omitted variable problem that will yield biased coefficients except under specific assumptions that are unlikely to hold in practice. Moreover, this bias will not diminish even as the sample size increases.
2.2 Skewed Versus One-Sided Measurement Error
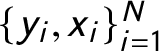
The assumption of one-sided measurement error may be too rigid in many applications. Instead, the assumption of measurement errors highly skewed in one direction may be more realistic. With skewed measurement error, it is likely that many of the issues that arise with one-sided measurement error continue to do so. Again consider the linear in parameters model in (1) and data that represent a random sample,
 $\{y_{i},x_{i}\}_{i=1}^{N}$
, where
 $y_{i}$
is the observed value of
 $y_{i}^{\ast }$
. However, now suppose that both over- and under-reporting simultaneously exist but in vastly different proportions. In this case,
 $$ \begin{align} y_{i}=y_{i}^{\ast }+u_{i}, \end{align} $$
where
 $u_{i}$
comes from a skewed distribution and can take both negative and positive values. As in the case of one-sided measurement error, skewed errors can potentially lead to substantial bias in the coefficient estimates.
To see this, consider a simple parametric example. The estimating equation is
 $$ \begin{align} y_{i}=x_{i}\beta +v_{i}+u_{i}=x_{i}\beta +\varepsilon _{i}. \end{align} $$
Suppose that
 $\varepsilon $
is distributed as skew normal, which has pdf
 $ f(\varepsilon )= {2}/{\omega }\phi ( A) \Phi (\alpha A) $
, where
 $A={\varepsilon -\xi }/{\omega }$
,
 $\omega $
is the variance of
 $\varepsilon $
,
 $\alpha $
controls the skewness of
 $\varepsilon $
, and
 $\xi $
is the location (not to be conflated with the mean) of
 $ \varepsilon $
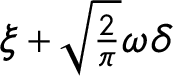
. The mean of
 $\varepsilon $
is
 $\xi +\sqrt {\frac {2}{\pi }} \omega \delta $
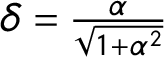
, where
 $\delta =\frac {\alpha }{\sqrt {1+\alpha ^{2}}}$
(Azzalini 1985). Note, even if
 $\xi =0$
, the mean of
 $\varepsilon $
is nonzero as long as there is skewness (i.e.,
 $\alpha \neq 0$
). Moreover, the conditional mean of
 $\varepsilon $
depends on the variance parameter,
 $ \omega $
. Thus, with skewed and heteroskedastic measurement error, the conditional mean of
 $\varepsilon $
is no longer constant. Thus, OLS applied to (7) estimates the conditional mean
 $E[y|x]=E[y^{\ast }|x]+E[\varepsilon |x]\neq E[y^{\ast }|x]$
.
The use of the skew normal assumption is only for illustrative purposes. Nearly all members of the class of skewed distributions (skew normal, skew
 $ t $
, skew Laplace, etc.) possess these same features.Footnote
4
In addition, even with the assumption that v is distributed symmetrically, the distribution of
 $v+u$
will be asymmetric provided that u is distributed asymmetrically (whether u is one-sided or not). It is this asymmetry, and not one-sided measurement error, coupled with heteroskedasticity in the measurement error that leads to the bias and inconsistency of the OLS estimator as the conditional mean of the error term now depends on covariates, leading to the usual omitted variable bias. Consequently, skewness of the residuals provides a potential metric researchers can explore. Finally, note that with heteroskedastic but symmetric measurement error, the mismeasurement only affects efficiency and inference.
2.3 Confronting Skewed Measurement Error
Estimating models with one-sided errors has a long history in the analysis of productive efficiency (Kumbhakar and Lovell 2001; Parmeter and Kumbhakar Reference Parmeter and Kumbhakar2014). This literature offers an array of methods to capture the one-sided nature of
 $u_{i}$
. Thus, accounting for one-sided measurement error can be addressed with application of these methods.
The most common approach is SFA, which begins by making distributional assumptions on both errors in (3). Typically,
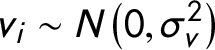 $v_{i}\sim N\big ( 0,\sigma _{v}^{2}\big ) $
and the one-sided error is assumed to be distributed half-normal,
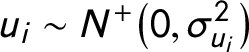 $u_{i}\sim N^{+}\big ( 0,\sigma _{u_{i}}^{2}\big ) $
.Footnote
5
If the observed outcome suffers from one-sided, heteroskedastic measurement error, a (correctly specified) SF model provides consistent estimates of the parameters.
It is noteworthy that while SFA typically uses the half-normal assumption for u, a nearly identical result holds if u is instead distributed as skew normal. The reason for this is that, as demonstrated in González-Farías et al. (2004), the sum of a normal random variable and a skew normal random variable is distributed as skew normal. More formally, the skew normal family is closed under addition; just as the sum of two normal random variables is distributed normal, the sum of two skew normal random variables is distributed skew normal (and a normal random variable is skew normal, with parameter
 $\alpha =0$
).
Maintaining the previous distributional assumptions on the errors and assuming that the errors are independent, the model is estimated via maximum likelihood with the following log-likelihood function
 $$ \begin{align} \ln L=\sum\limits^n_{i=1}\bigg\{ -\ln \sigma _{\varepsilon }+\ln \Phi \bigg[ -\frac{s\varepsilon _{i}\big( \frac{\sigma _{ui}}{\sigma _{v}}\big) }{ \sigma _{\varepsilon _{i}}}\bigg] -\frac{\varepsilon _{i}^{2}}{2\sigma _{\varepsilon _{i}}^{2}}\bigg\} , \end{align} $$
where
 $\Phi (\cdot )$
is the standard normal cumulative distribution function and
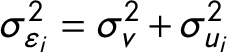 $\sigma _{\varepsilon _{i}}^{2}=\sigma _{v}^{2}+\sigma _{u_{i}}^{2}$
(Parmeter and Kumbhakar Reference Parmeter and Kumbhakar2014). If u is heteroskedastic, the variance is commonly modeled as
 $$ \begin{align*} \sigma _{u_{i}}^{2}=\exp (z_{i}\gamma ), \end{align*} $$
where typically
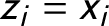 $z_{i}=x_{i}$
(e.g., Caudill, Ford, and Gropper Reference Caudill, Ford and Gropper1995).
Alternative methods exist for researchers hesitant to make such distributional assumptions. One approach is to assume that
 $u_{i}$
satisfies the scaling property (Simar et al. 1994; Wang and Schmidt Reference Wang and Schmidt2002). Under the scaling property,
 $u_{i}$
has the following form
 $$ \begin{align} u_{i}\sim g(z_{i};\,\delta )u_{i}^{\ast }, \end{align} $$
where
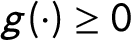 $g(\cdot )\geq 0$
is a function of exogenous variables while
 $ u_{i}^{\ast }$
is a random variable whose distribution does not depend on
 $ z_{i}$
.Footnote
6
The scaling property captures the idea that the shape of the distribution of the asymmetric measurement error is the same for all observations. However, the scaling function collapses or expands the random variable so that the scale of
 $u_{i}$
changes without changing the underlying shape (Parmeter and Kumbhakar Reference Parmeter and Kumbhakar2014). In addition, the scaling property permits estimation without specifying a distribution for v or
 $u^{\ast }$
. Combining (3), the scaling property, and placing structure on
 $g(\cdot )$
yields the following regression model
 $$ \begin{align} y_{i}=x_{i}\beta +v_{i}\pm \exp (z_{i}{\delta })u_{i}^{\ast }, \end{align} $$
where the conditional mean of y given x and z is
 $$ \begin{align} E[y|x,z]=x\beta \pm \exp (z{\delta })\mu ^{\ast } \end{align} $$
with
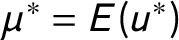 $\mu ^{\ast }=E(u^{\ast })$
. We use the
 $\pm $
here to capture asymmetric measurement error that may either have a negative or positive mean. The regression model with mean zero error term is
 $$ \begin{align} y_{i}=x_{i}\beta \pm \exp (z_{i}{\delta })\mu ^{\ast }+v_{i}\mp \exp (z_{i}{ \delta })(u_{i}^{\ast }-\mu ^{\ast })=x_{i}\beta \pm \exp (z_{i}{\delta } )\mu ^{\ast }+\varepsilon _{i}^{\ast }, \end{align} $$
which can be estimated using NLLS as
 $$ \begin{align} \big( \widehat{\beta },\widehat{\delta },\widehat{\mu }^{\ast }\big) = \underset{{\beta },{\delta },\mu ^{\ast }}{\min }n^{-1}\sum\limits_{i=1}^{n} \big[ y_{i}-x_{i}\beta \pm \mu ^{\ast }\exp (z_{i}{\delta })\big] ^{2}. \end{align} $$
The need for NLLS stems from the fact that the scaling function is positive. If one erroneously specifies it as linear, then two problems arise. First, the scaling function would not satisfy positivity everywhere, invalidating the function estimates. Second, the model would suffer from perfect multicollinearity if x and z overlap. In terms of implementation, note that the presence of
 $\mu ^{\ast }$
implies that one cannot include a constant in z, as this leads to identification issues. Given that the error term from the model in (12) is heteroskedastic by definition, either a generalized NLLS algorithm is requiredFootnote
7
or heteroskedastic robust standard errors are needed for valid inference (White 1980).
SFA and NLLS methods have benefits and shortcomings. SFA will produce consistent and efficient estimates if the distributional assumptions and functional form for the skedastic function are correct. NLLS requires proper specification of the scaling function as well as the scaling property more generally. Other approaches are available that allow one to avoid parametric specification in general, but these typically require more advanced methods and also have shortcomings (Parmeter et al. 2017; Simar et al. 2017).
2.4 Assessing the (Likely) Presence of Skewed Measurement Error
While ignoring skewed, heteroskedastic measurement error is likely to cause significant estimation issues, applying the proposed solutions when such errors are not present is apt to be highly inefficient. Thus, testing for the likely presence of skewed, heteroskedastic measurement error seems wise. Fortunately, methods of testing for such properties of residuals are commonplace. In terms of testing skewness, several tests exist. For example, Stata implements the test of D’Agostino, Belanger, and D’Agostino Jr (Reference D’Agostino, Belanger and D’Agostino1990) with the empirical correction developed in Royston (Reference Royston1991). For heteroskedasticity, again several tests are available. Stata implements tests developed in Pagan and Hall (Reference Pagan and Hall1983), Breusch and Pagan (Reference Breusch and Pagan1979), and others.
3 Monte Carlo Study
We undertake two small-scale Monte Carlo studies. The first considers the case of one-sided measurement error. The second examines skewed measurement error. The objectives are threefold. First, to assess the sensitivity of OLS to different degrees of one-sided or skewed measurement error in the dependent variable. Second, to assess the viability of correctly specified SFA and NLLS in such cases. Finally, to assess the sensitivity of the estimators to limited departures from the correct specification.
3.1 One-Sided Measurement Error
3.1.1 Design
Data are simulated from variants of the following data-generating process (DGP)Footnote 8 :
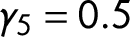
 $$ \begin{align*} y_{i}^{\ast } &=\beta _{0}+\beta _{1}x_{1i}+\beta _{2}x_{2i}+v_{i} \\ y_{i} &=y_{i}^{\ast }-u_{i} \\ x_{1i},x_{2i} &\overset{\text{iid}}{\sim }N(0,1) \\ v_{i} &\overset{\text{iid}}{\sim }N(0,1) \\ u_{i} &\sim \big\vert N(0,\sigma _{u_{i}}^{2})\big\vert \\ \sigma _{u_{i}}^{2} &=\exp (\gamma _{0}+\gamma _{1}x_{1i}+\gamma _{2}x_{2i}+\gamma _{3}x_{1i}^{2}+\gamma _{4}x_{2i}^{2}+\gamma _{5}x_{1i}x_{2i}). \end{align*} $$
In all designs, we set
 $\beta _{0}=\beta _{1}=\beta _{2}=1$
. In Design 1, we set
 $\gamma _{1}=\gamma _{2}=\gamma _{3}=\gamma _{4}=\gamma _{5}=0$
. In Design 2, we set
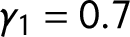 $\gamma _{1}=0.7$
,
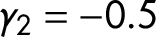 $\gamma _{2}=-0.5$
, and
 $\gamma _{3}=\gamma _{4}=\gamma _{5}=0$
. In Design 3, we set
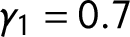 $\gamma _{1}=0.7$
,
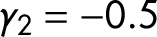 $ \gamma _{2}=-0.5$
,
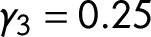 $\gamma _{3}=0.25$
,
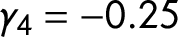 $\gamma _{4}=-0.25$
, and
 $\gamma _{5}=0.5$
. Thus, the one-sided measurement error, u, is homoskedastic in Design 1 and heteroskedastic in Designs 2 and 3. Finally,
 $\gamma _{0}$
is varied in order to assess the sensitivity of different estimators to the extent of the measurement error. Specifically, we vary
 $\gamma _{0}$
such that
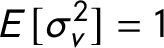
 $E[\sigma _{v}^{2}]/E[\sigma _{u_{i}}^{2}]=\{1,2,5,10\}$
. Since
 $ E[\sigma _{v}^{2}]=1$
, this is equivalent to
 $E[\sigma _{u_{i}}^{2}]=\{1,0.5,0.2,0.1\}$
.
For each experimental design, we conduct 1,000 simulations for two sample sizes,
 $N=100$
and
 $N=10,000$
. We compare the bias, mean absolute error (MAE), mean squared error (MSE), and coverage rate of four estimators: OLS, homoskedastic SF, heteroskedastic SF, and NLLS. In the homoskedastic SF model,
 $\sigma _{u_{i}}$
is assumed to be a constant for all i. In the heteroskedastic SF and NLLS models,
 $\sigma _{u_{i}}^{2}$
is parameterized as
 $\exp (\gamma _{0}+\gamma _{1}x_{1i}+\gamma _{2}x_{2i})$
.Footnote
9
As such, in Design 1, the skedastic function is over-specified. In Design 2, the skedastic function is correctly specified. In Design 3, the skedastic function is under-specified.
3.1.2 Results
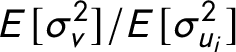
The results are presented in Figures A1–A3 and Tables A1–A5 in the Supplemental Appendix. Tables A1–A4 report the bias, MAE, MSE, and coverage rate based on 95% confidence intervals. Each table is identical except for the value of
 $\gamma _{0}$
which then yields differences in
 $E[\sigma _{v}^{2}]/E[\sigma _{u_{i}}^{2}]$
(i.e., the relative importance of the idiosyncratic error). For ease of presentation, Figures A1 and A2 present the median squared error of our estimators relative to the median squared error of OLS for Designs 2 and 3. Figure A1 is based on the simulations with
 $N=100$
, while Figure A2 is based on the simulations with
 $ N=10,000$
.
Several findings emerge. First, with one-sided, homoskedastic measurement error (Design 1), OLS performs well in terms of estimating the slope coefficients, but not the intercept. This is consistent with expectations as one-sided, homoskedastic measurement error only effects the intercept. In Design 1, the performance of the homoskedastic SF model in terms of estimating the slope parameters is nearly indistinguishable from OLS (except the coverage rates are a bit lower in small samples); estimation of the intercept and coverage rates across all parameters are very good in large samples. In Design 1, the heteroskedastic SF model is over-specified. As such, it is inefficient and the coverage rates are low, but the loss in precision is negligible in large samples if the measurement error is severe enough. Thus, with little measurement error, over-specifying the skedastic function leads to higher imprecision of all estimates, even in large samples, particularly for the intercept.
Second, with one-sided, heteroskedastic measurement error (Design 2 or 3), OLS performs poorly for all of the parameters of the model, even when the sample size is large and the measurement error is relatively small (Table A4). The homoskedastic SF model fares a bit better than OLS, but the improvement is marginal. Particularly salient is the fact that the coverage rates of the slope parameters for both OLS and the homoskedastic SF are less than 10% even when the expected variance of the measurement error is 10% of the variance of the idiosyncratic error (Table A4). Thus, even small heteroskedastic measurement error has important consequences; one should be wary of ignoring measurement error as a “minor” issue.
Third, the heteroskedastic SF model performs quite well when the heteroskedasticity function is correctly specified (Design 2), but the results are somewhat mixed when it is under-specified (Design 3). The performance of the heteroskedastic SF is increasing in the sample size and decreasing in the variance of the measurement error. However, even in Table A1 where the variance of the measurement and idiosyncratic errors are equal in expectation, the heteroskedastic SF performs very well with large samples and reasonably well in small samples. As such, a correctly specified SF model does offer a viable solution to researchers.
Fourth, the NLLS models performs quite poorly in small samples. Even when the model is correctly specified (Design 2), the median squared errors are higher than OLS and the correctly specified heteroskedastic SF model (Figure A1). With larger samples, the performance of the NLLS estimator does improve substantially, showing the consistency of the estimator. Nonetheless, the heteroskedastic SF model typically dominates the NLLS estimator when each is either correctly specified (Design 2) or over-specified (Design 1). Strikingly, though, the NLLS model appears to be more robust to misspecification. When the models are under-specified (Design 3), NLLS performs similarly to the heteroskedastic SF model when the measurement error is relatively small (Figure A2 and Tables A3 and A4) and exhibits some signs of superior performance when the measurement error is relatively large (Figure A2 and Tables A1 and A2).
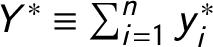
The final set of results are presented in Table A5. In certain cases, one might be interested in the total number of occurrences of the dependent variable in the sample; formally,
 $Y^{\ast }\equiv \sum ^n_{i=1}y_{i}^{\ast }$
. For instance, with civil conflicts, one may be interested in the “true” death toll. The sample provides
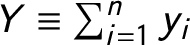 $Y\equiv \sum ^n_{i=1}y_{i}$
. Alternatively, estimates can be obtained based on different estimators of the model as
 $ \widehat {Y}^{\ast }\equiv \sum ^n_{i=1}\widehat {y}_{i}^{\ast }=\sum ^n_{i=1}(\widehat {\beta }_{0}+\widehat {\beta }_{1}x_{1i}+ \widehat {\beta }_{2}x_{2i}+\widehat {u}_{i})$
, where
 $\widehat {u}_{i}$
is the estimated measurement error (equal to zero in the case of OLS). Note, OLS yields
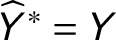 $\widehat {Y}^{\ast }=Y$
. Utilizing the four estimators, the bias and mean absolute percentage error (MAPE) are reported in Table A5. The results indicate that OLS performs poorly across all experimental designs. The homoskedastic and heteroskedastic SF models, on the other hand, perform well as long the heteroskedastic function is correctly specified or over-specified. If the SF model is under-specified, it performs better than OLS, but perhaps still not well. The NLLS model continues to perform extremely poorly in small samples, and much worse than the heteroskedastic SF model in large samples if the skedastic function is correctly specified or over-specified. However, NLLS continues to be more robust to misspecification. Finally, Figure A3 plots kernel density estimates of the distribution of
 $y_{i}^{\ast }$
and
 $\widehat {y}_{i}^{\ast }$
for one simulated data set with
 $N=10,000$
under Design 2. The results indicate that the observed density is shifted to the left, even in Panel D where the variance of the measurement error is low. The homoskedastic and heteroskedastic SF densities are fairly close to the truth, although the tails are a bit thinner. In contrast, the NLLS densities are over-corrected, lying to the right of the truth, when the measurement error is relatively small (Panels C and D). When the measurement error is relatively large (Panels A and B), the NLLS densities are fairly close to the truth, although the tails are a bit thicker.
3.2 Skewed Measurement Error
3.2.1 Design
Data are now simulated from variants of the following DGP:
 $$ \begin{align*} y_{i}^{\ast } &=\beta _{0}+\beta _{1}x_{1i}+\beta _{2}x_{2i}+v_{i} \\ y_{i} &=y_{i}^{\ast }-u_{i} \\ x_{1i},x_{2i} &\overset{\text{iid}}{\sim }N(0,1) \\ v_{i} &\overset{\text{iid}}{\sim }N(0,1) \\ \widetilde{u}_{i} &\sim \bigg( \frac{\sigma _{u_{i}}}{20}\bigg) \chi _{20}^{2} \\ u_{i} &=\widetilde{u}_{i}-0.2 \\ \sigma _{u_{i}}^{2} &=\exp (\gamma _{0}+\gamma _{1}x_{1i}+\gamma _{2}x_{2i}+\gamma _{3}x_{1i}^{2}+\gamma _{4}x_{2i}^{2}+\gamma _{5}x_{1i}x_{2i}). \end{align*} $$
We set
 $\beta _{0}=\beta _{1}=\beta _{2}=1$
and consider three designs. In Design 1, we set
 $\gamma _{1}=\gamma _{2}=\gamma _{3}=\gamma _{4}=\gamma _{5}=0$
. In Design 2, we set
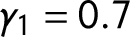 $\gamma _{1}=0.7$
,
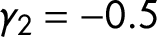 $\gamma _{2}=-0.5$
, and
 $ \gamma _{3}=\gamma _{4}=\gamma _{5}=0$
. In Design 3, we set
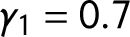 $\gamma _{1}=0.7$
,
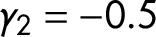 $\gamma _{2}=-0.5$
,
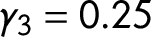 $\gamma _{3}=0.25$
,
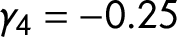 $\gamma _{4}=-0.25$
, and
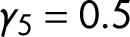 $\gamma _{5}=0.5$
. Thus, the skewed measurement error, u, is homoskedastic in Design 1 and heteroskedastic in Designs 2 and 3. Finally,
 $\gamma _{0}$
is varied in order to assess the sensitivity of different estimators to the extent of the measurement error. Again, we vary
 $\gamma _{0}$
such that
 $ E[\sigma _{v}^{2}]/E[\sigma _{u_{i}}^{2}]=\{1,2,5,10\}$
. Since
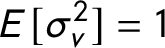 $E[\sigma _{v}^{2}]=1$
, this is equivalent to
 $E[\sigma _{u_{i}}^{2}]=\{1,0.5,0.2,0.1\} $
.
To understand the properties of the skewed measurement error, u, define the
 $r{\text {th}}$
central moments of
 $u_{i}$
as
 $$ \begin{align*} m_{r}=\frac{1}{N}\sum\limits^n_{i=1} \big( u_{i}-\overline{u}\big) ^{r}. \end{align*} $$
The coefficient of skewness is
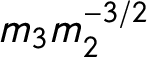 $m_{3}m_{2}^{-3/2}$
. In Designs 1 and 2, the expected coefficients of skewness are approximately 0.6 and 1.8, respectively. In Design 3, it is at least 14. Finally, the expected fraction of observations with
 $u_{i}<0$
varies across all designs parameter configurations. In Design 1, the expected fraction is less than 1%. In Designs 2 and 3, the expected fractions become as high as about 5% and 13%, respectively.
For each experimental design, we conduct 1,000 simulations with
 $N=100$
and
 $ N=10,000$
and report the same metrics as in the prior section. However, there is one important distinction between this set of simulations and the prior set. In Design 3, we now specify the heteroskedasticity error term variance,
 $\sigma _{u_{i}}^{2}$
, as
 $\exp (\gamma _{0}+\gamma _{1}x_{1i}+\gamma _{2}x_{2i}+\gamma _{3}x_{1i}^{2}+\gamma _{4}x_{2i}^{2}+\gamma _{5}x_{1i}x_{2i})$
during estimation. Thus, the heteroskedastic variance is no longer under-specified during estimation in Design 3. As stated above, the degree of skewness is much higher in Design 3 than Design 2. By making this change, we are not confounding the effects of raising the degree of skewness and the effects of under-specifying the heteroskedastic variance.Footnote
10
3.2.2 Results
The results are presented in Figures A4 and A5 and Tables A6–A9 in the Supplemental Appendix. Several findings emerge. First, with skewed, homoskedastic measurement error (Design 1), OLS performs well in terms of estimating the slope coefficients but not the intercept. Moreover, the performance of the homoskedastic SF model continues to be nearly indistinguishable from OLS, with the exception that the estimation of the intercept is much improved. This is noteworthy because, with skewed measurement error, the distributional assumption pertaining to the one-sided measurement error is not correct. In Design 1, the heteroskedastic SF and NLLS models are over-specified. As such, both are inefficient and, hence, less precise, particularly in small samples. Second, with skewed, heteroskedastic measurement error (Design 2 or 3), OLS and the homoskedastic SF model perform quite poorly. Furthermore, the coverage rates of the slope parameters for both OLS and the homoskedastic SF are close to zero even with relatively little measurement error.
Third, the heteroskedastic SF model performs quite well with skewed, heteroskedastic measurement error (Design 2 or 3) in terms of estimating the individual parameters. However, despite this performance, the coverage rates are not good, particularly with the larger sample size. This is not surprising. It is important to remember that the heteroskedastic SF model is misspecified, despite specifying the variance as a function of the correct covariates, since the distributional assumptions of the model are incompatible with those used to develop the likelihood function. However, despite this misspecification, the heteroskedastic SF model offers an improvement over ignoring the measurement error.
Finally, NLLS performs poorly in small samples. While the coverage rates are better than the heteroskedastic SF model, this reflects the imprecision in the estimates. With larger samples, NLLS performs substantially better, particularly in Design 3 with a high degree of skewness. Moreover, the coverage rates of NLLS in large samples continues to be much better than the heteroskedastic SF model. Thus, with large samples, NLLS can still be a bit imprecise, but the lack of distributional assumptions is a major advantage, particularly with a high degree of skewness.
4 Applications
4.1 Civil Conflict
To investigate the importance of addressing possible measurement error, we first revisit some of the analysis in Nepal, Bohara, and Gawande (Reference Nepal, Bohara and Gawande2011). Footnote 11 The study investigates the role of inequality on conflict, analyzing killings by Nepalese Maoists in the People’s War against their government. The conflict lasted from February 13, 1996 until the signing of the Comprehensive Peace Accord on November 21, 2006.
The main estimating equation in Nepal et al. (Reference Nepal, Bohara and Gawande2011) is
 $$ \begin{align} \ln (y_{ij}^{\ast })=x_{ij}\beta +\alpha _{j}+v_{ij}, \end{align} $$
where
 $y_{ij}^{\ast }$
is the number of killings by Nepalese Maoists in village i in district j over the period 1996–2003,
 $x_{ij}$
is a vector of village-level covariates,
 $\alpha _{j}$
are district fixed effects, and
 $ v_{ij}$
is a well-behaved error term. The observed variable,
 $y_{ij}$
, comes from annual reports by the Informal Sector Services Center (INSEC). Because of the possibility of some violence being undocumented, the true number of killings is likely to exceed those reported. Thus,
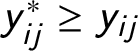 $y_{ij}^{\ast }\geq y_{ij} $
which implies that
 $s=1$
in (2). The SF model is given by
 $$ \begin{align} \ln (y_{ij})=x_{ij}\beta +\alpha _{j}-u_{ij}+v_{ij}. \end{align} $$
Measurement error in the death toll during the Nepalese civil war is indicated by the variation in fatalities reported across sources. Do and Iyer (Reference Do and Iyer2010) put the death toll at over 13,000; ReliefWeb (2009) puts it at under 17,000. Reliance on INSEC’s subnational data by researchers analyzing the Maoist conflict is common. Joshi and Pyakurel (Reference Joshi and Pyakurel2015, 604) state: “INSEC is highly respected among national and international human rights communities for their monitoring of human rights issues in Nepal…For their commitment to human rights and to unbiased reporting, they are respected by the rank-and-file members of the Maoist party as well as by government officials.” At the same time, the authors also note (p. 605) that “While it is possible that the INSEC data collection processes are biased for their focus on human rights issues, which could be used by domestic and international organizations as leverage to monitor the human rights situation in Nepal, the data are verifiable and correctable.” Lastly, we note that the Nepalese government raised the official death toll in 2009 to 16,278 (BBC News 2009), higher than that contained in the INSEC database analysed in Joshi and Pyakurel (Reference Joshi and Pyakurel2015), which contains records for 15,021 deaths. Thus, the assumption that the INSEC suffers from strictly one-sided measurement error seems likely.
The set of village-level covariates include a measure of inequality (either the Gini coefficient or a polarization index), the percent below the poverty line, average years of education, mean months of employment in 2001, the percent of farmers, the percent speaking Nepali as their primary language, a rural dummy, and log population. The sample includes 3,857 villages across 75 districts. The variance of the error term is modeled as
 $$ \begin{align} \sigma _{u_{ij}}^{2}=\exp (z_{ij}\gamma ), \end{align} $$
where
 $z_{ij}$
includes an intercept only (homoskedastic SF) or a linear or quadratic function of all variables in
 $x_{ij}$
(heteroskedastic SF and NLLS).
Finally, the authors are concerned about the possible endogeneity of their primary regressor of interest, inequality. As such, they instrument for inequality using three village-level instruments: percent of households operating agricultural land, percent of households with female ownership of land, and the average number of big head livestock owned by women. For the SF and NLLS models, we address endogeneity via a control function approach with bootstrap standard errors (see, e.g., Amsler, Prokhorov, and Schmidt Reference Amsler, Prokhorov and Schmidt2016). Specifically, (15) is augmented with the first-stage residual, becoming
 $$ \begin{align} \ln (y_{ij})=x_{ij}\beta +\alpha _{j}+\widehat{\eta }_{ij}-u_{ij}+v _{ij}, \end{align} $$
where
 $\widehat {\eta }_{ij}$
is the estimated residual from the first-stage model given by
 $$ \begin{align} x_{1ij}=w_{ij}\pi +\alpha _{j}+\eta _{ij}. \end{align} $$
In (18),
 $x_{1ij}$
represents the element of x corresponding to the inequality covariate and
 $w_{ij}$
denotes the vector of excluded instruments and remaining (exogenous) elements of x.Footnote
12
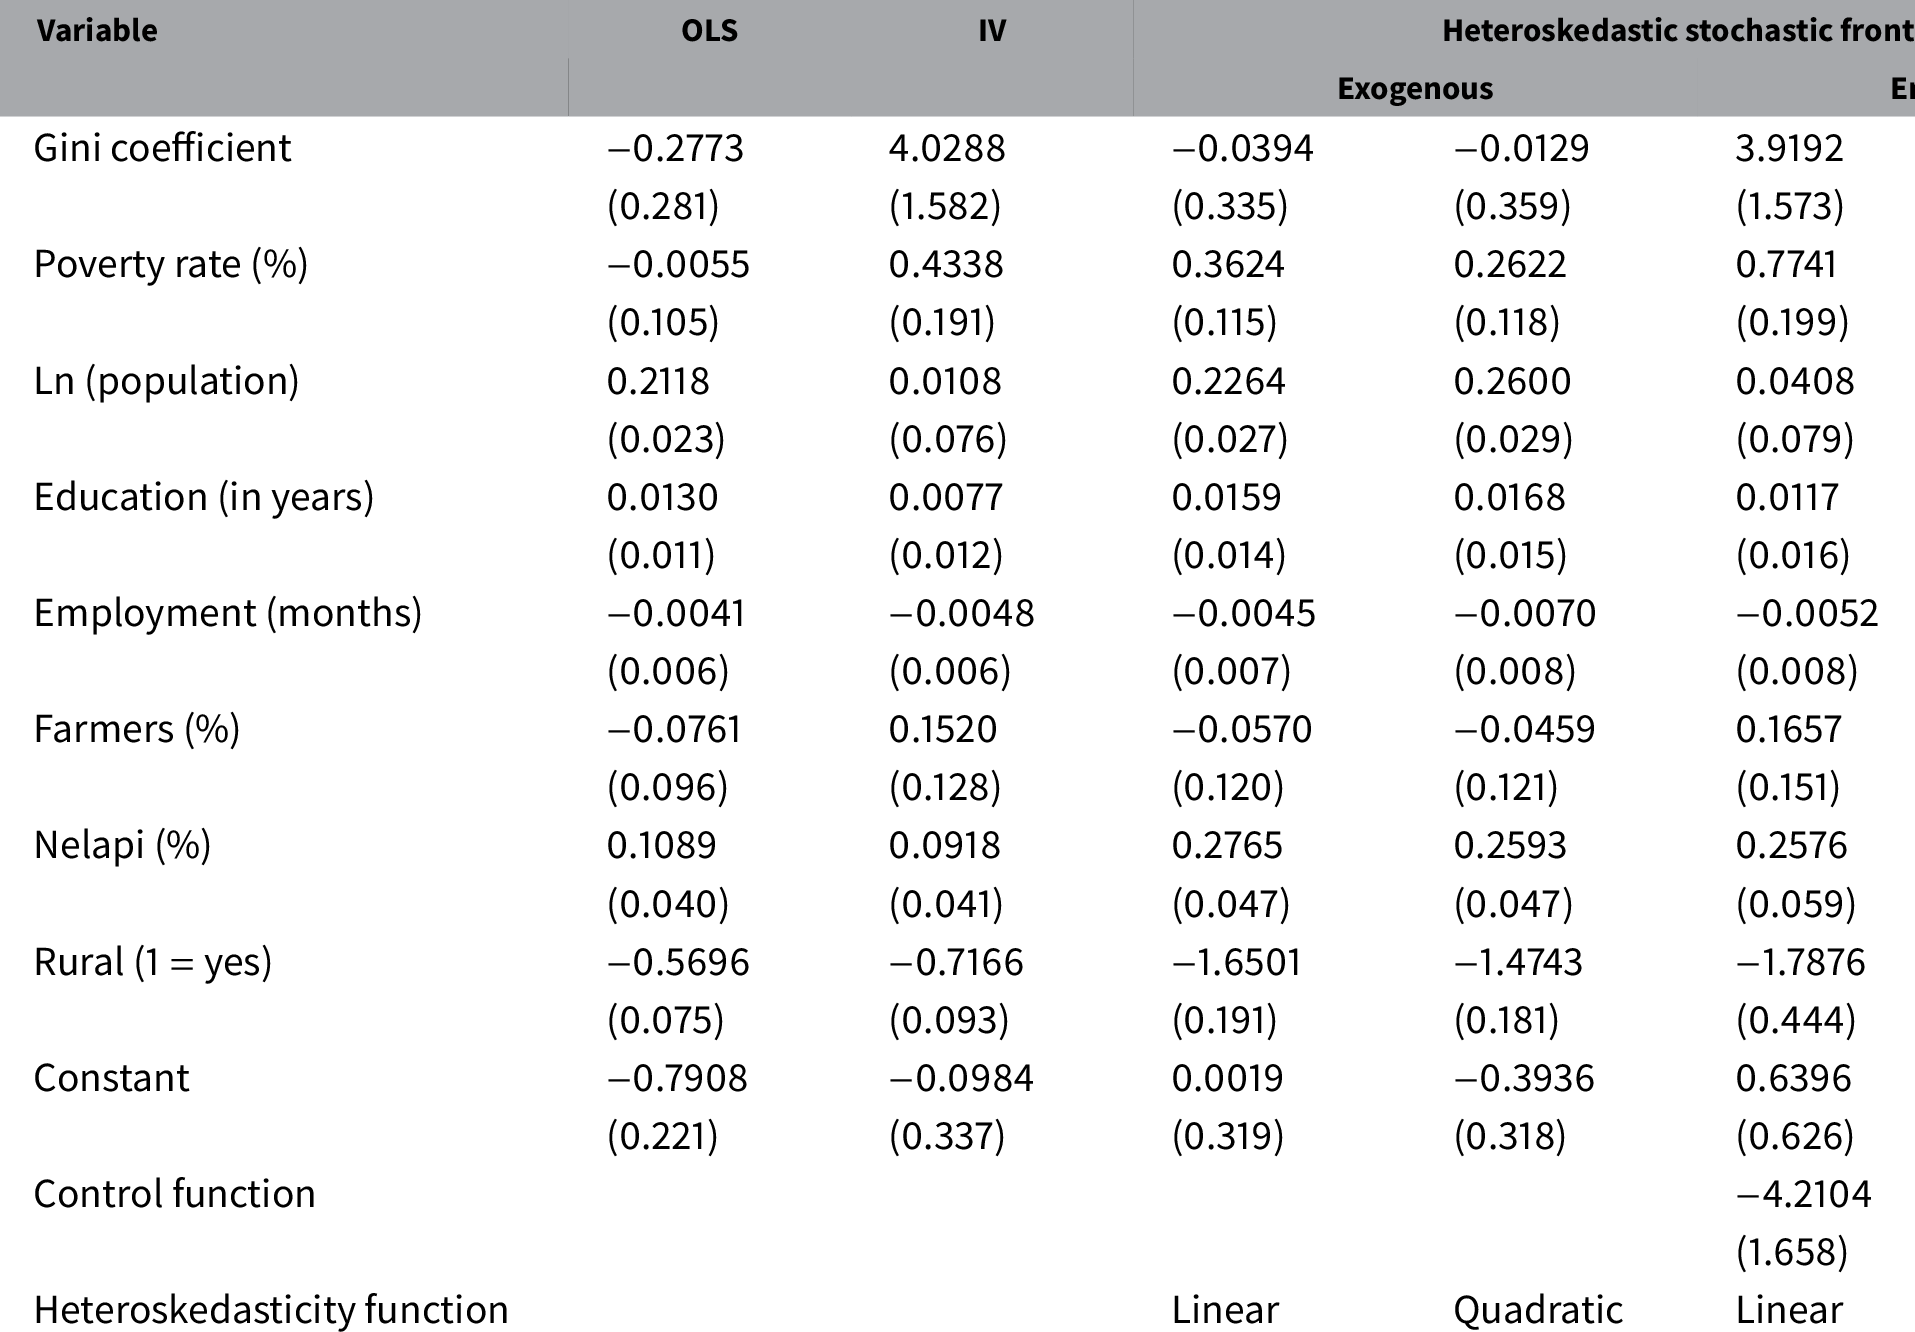
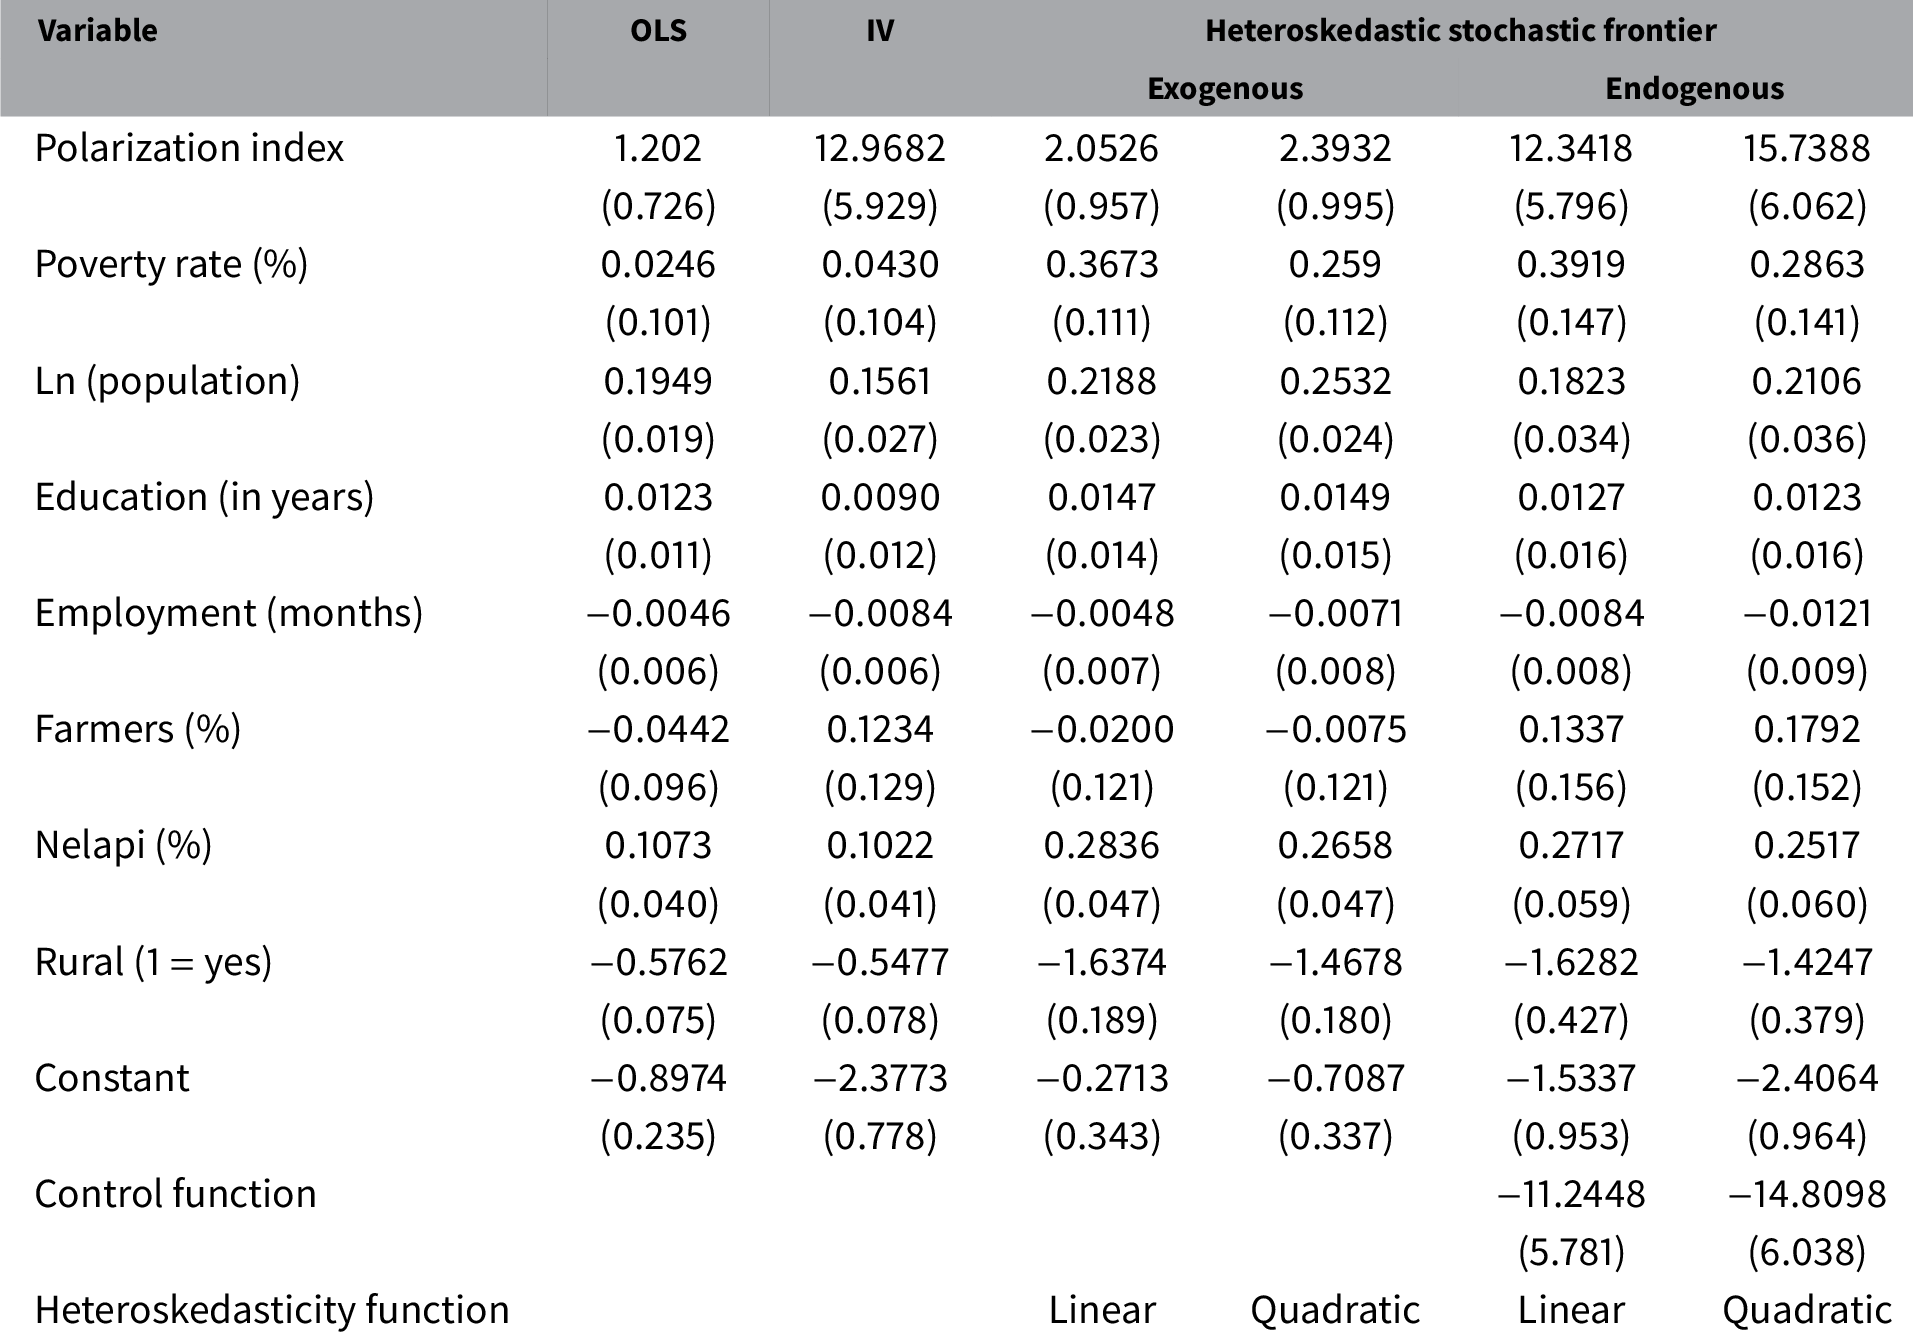
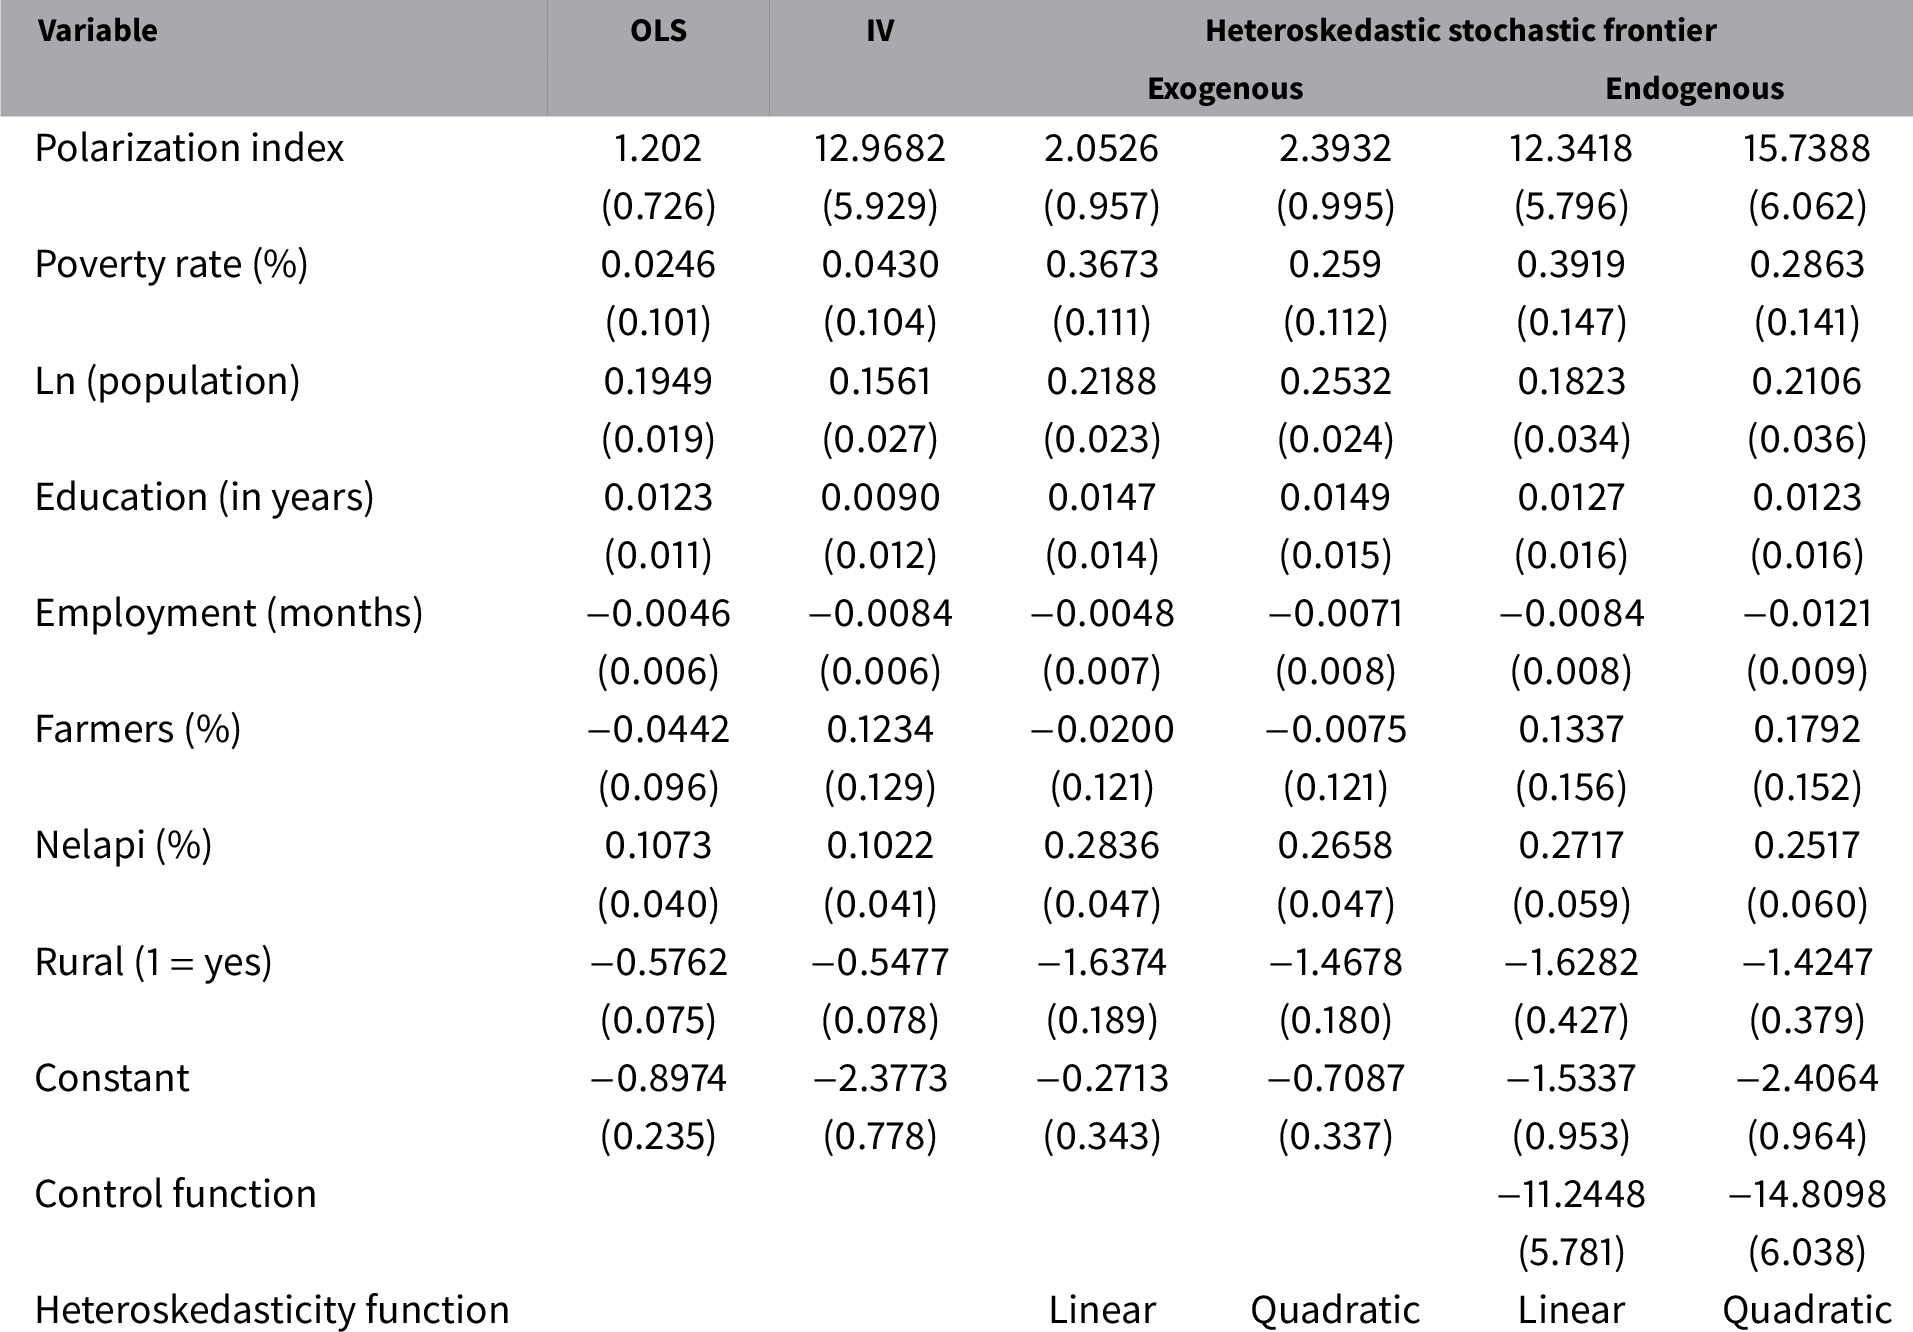
Coefficient estimates are presented in Tables 1 and 2.Footnote
13
The tables are identical except that the Gini coefficient is used to measure inequality in Table 1, whereas a polarization index is used in Table 2. The OLS and IV estimates (estimated using Two-Stage Least Squares) are identical to the extended model results in Tables 2 and 3 in Nepal et al. (Reference Nepal, Bohara and Gawande2011).Footnote
14
Pagan and Hall (Reference Pagan and Hall1983) tests of heteroskedasticity always reject the null of homoskedasticity (
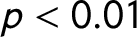 $p<0.01$
in all cases) in the original models. Similarly, we easily reject the null that the error term in the original models are not skewed (
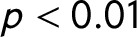 $p<0.01$
in all cases). While not shown, in our models, we find the variance of the one-sided error component depends on the poverty rate, population, share speaking Nepali as their primary language, and rural status. Moreover, the extent of measurement error is modest. Across the eight SF models, the ratio of the average variance of the idiosyncratic error to the one-sided error term varies from 4.3 to 4.7.
Determinants of killings by Nepalese Maoists: 1996–2003.

Abbreviations: IV, instrumental variable; NLLS, nonlinear least squares; OLS, ordinary least squares.
Notes: Standard errors in parentheses; obtained from 500 bootstrap repetitions for the endogenous stochastic frontier and NLLS models. Number of observations = 3,857 villages. Killings are the number killed by Maoists from 1996 to 2003. Seventy-five district fixed effects are also included. The Gini coefficient is instrumented for using the percent of households operating agricultural land, percent of households with women ownership of land, and average number of big head livestock owned by women. Heteroskedasticity refers to the variance of the one-sided error and depends on all covariates except the district fixed effects in the exogenous models and all covariates except the district fixed effects and inequality in the endogenous models.
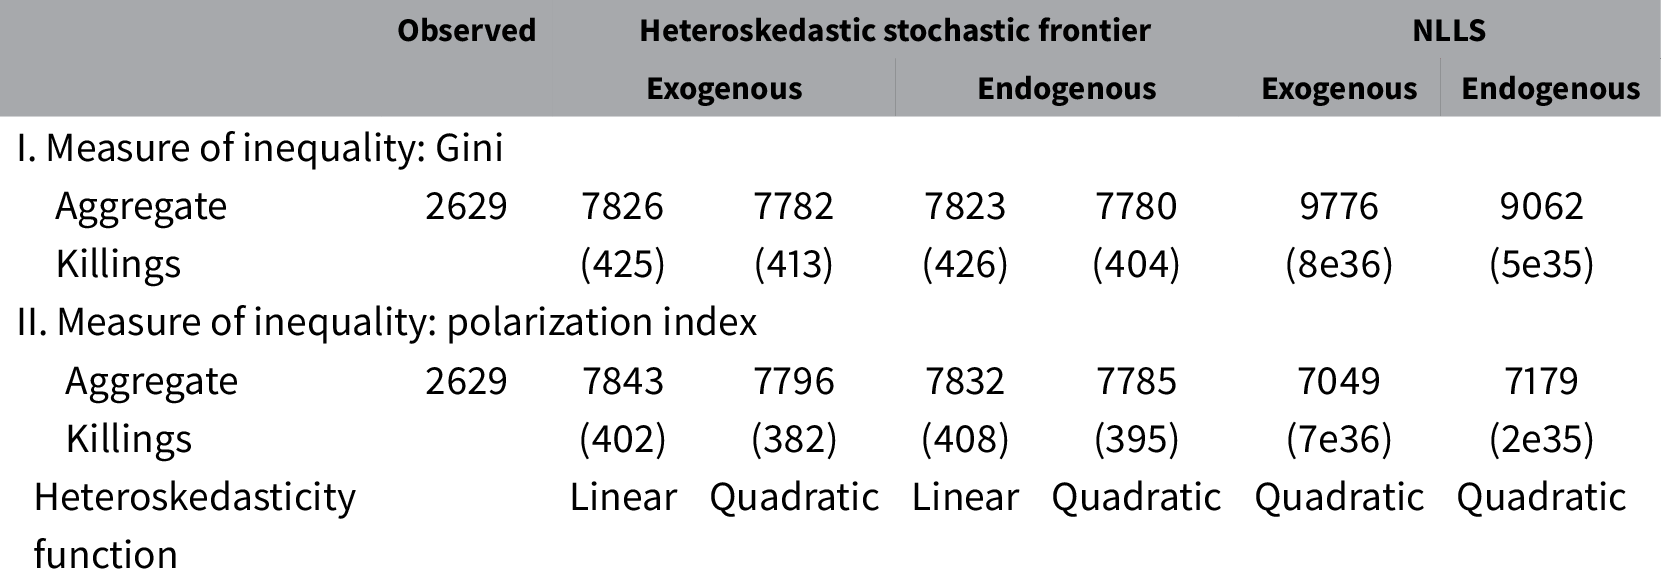
Reported and predicted killings by Nepalese Maoists: 1996–2003.

Abbreviation: NLLS, nonlinear least squares.
Notes: Standard errors in parentheses; obtained from 500 bootstrap repetitions for the endogenous stochastic frontier models. Number of observations = 3,857 villages. Aggregate killings is the number killed by Maoists from 1996 to 2003 across all villages. Results based on estimates in Tables 1 and 2. See text for further details.
When inequality is treated as exogenous, the OLS estimates differ in three important ways from those addressing measurement error. First, poverty becomes a statistically significant determinant of violence in the various SF models. A one standard deviation increase in the village-level poverty rate is associated with a 4.7% increase in the expected number of killings (using the results from the quadratic specification). Second, the impact of the percent speaking Nepali as their primary language, while statistically significant at conventional levels in the OLS and SF models, more than doubles in magnitude in the SF models (roughly 0.11 in OLS models to 0.26 in the heteroskedastic SF models). Third, rural villages experience significantly fewer killings according to the SF and NLLS models. According to the OLS estimates, rural villages experienced 43% fewer killings in expectation. This increases to more than 60% according to the heteroskedastic SF and NLLS estimates. Finally, it is worth noting that the NLLS estimates tend to be much more imprecise.
When inequality is treated as endogenous, the NLLS estimates are extremely imprecise; consistent with the much larger MSEs found in the simulations when the sample size is not overly large. However, both the SF and NLLS models reject the null of exogeneity; the coefficients on the control function are statistically significant at conventional levels in all cases. Comparing the IV and SF estimates, two important differences arise. First, the positive effects of the poverty rate and share speaking Nepali as their primary language and the negative effects of being rural continue to be of much greater magnitude in the SF models. The effects of these covariates are significantly attenuated when one-sided, heteroskedastic measurement error is ignored. In fact, the effect of poverty is close to zero and not statistically significant according to traditional IV when polarization is used to measure inequality (Table 2). When the Gini coefficient is used to measure inequality (Table 1), a one standard deviation increase in the poverty rate is associated with a 7.9% increase in expected killings according to the IV estimates. The corresponding value is 13.8% according to the quadratic heteroskedastic SF model.
Second, while the IV results indicate a statistically significant impact of inequality on killings using both measures of inequality, the impact is also greater in magnitude in the heteroskedastic SF models. According to the traditional IV estimates, a one standard deviation increase in the Gini coefficient (polarization index) leads to a 19% (14%) increase in the expected number of killings. The quadratic heteroskedastic SF model yields a corresponding estimate of 23% (17%). The NLLS estimates also suggest a larger effect of inequality, but the estimates are quite imprecise as noted above.
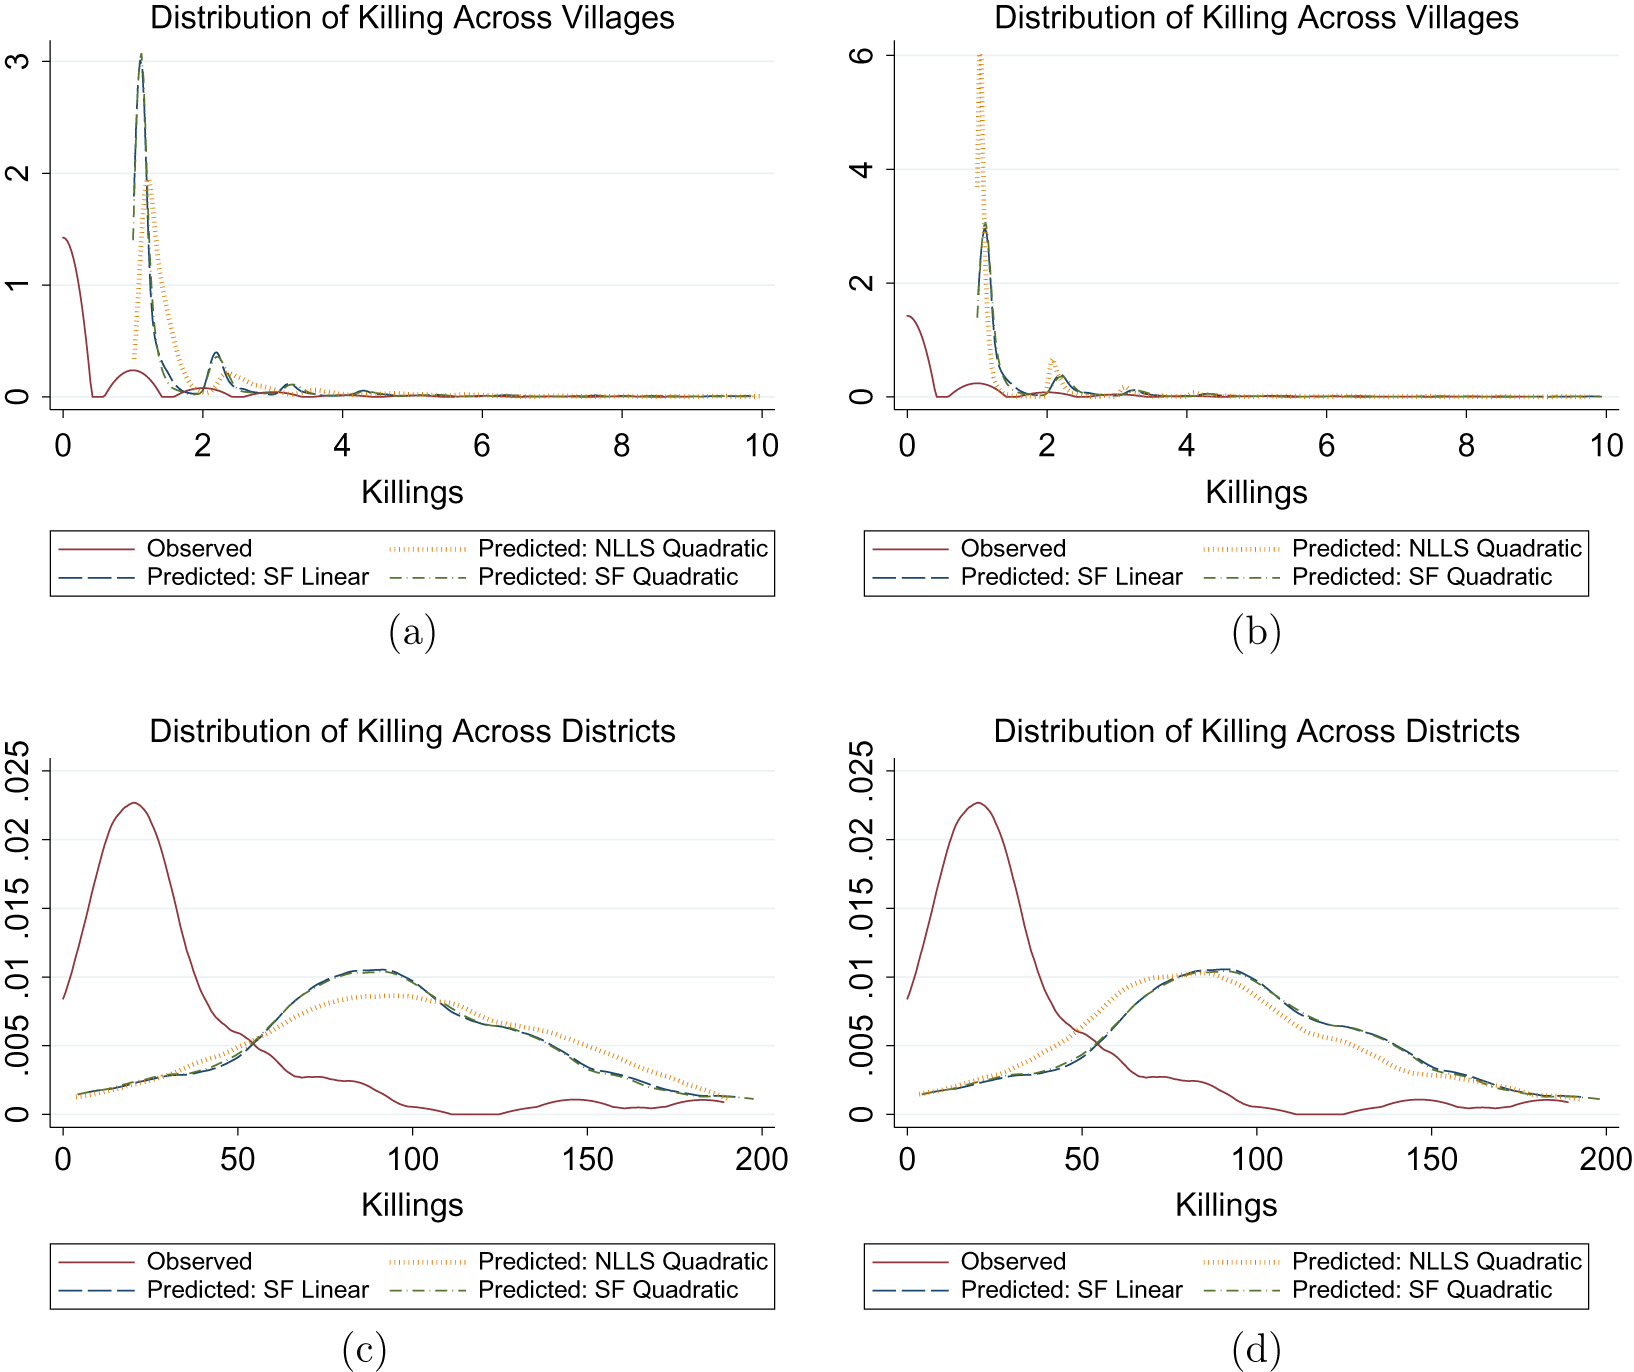
Finally, Table 3 and Figure 1 compare the observed total number of killings—in aggregate (Table 3) or across villages and districts (Figure 1)—with estimates based on the heteroskedastic SF and NLLS models. Table 3 reveals that the observed number of killings is only about one-third the estimated number of killings obtained from the heteroskedastic SF models. The NLLS models point to even more killings, but the standard errors are enormous.Footnote 15 Figure 1 reveals that the modal number of reported killings experienced by village or district level is also about one-third to one-fourth the estimated number of killings.
Distribution of observed and predicted killings. Notes: Predictions in (a) and (c) based on estimates in columns 5, 6, and 8 in Table 1, with predicted killings aggregated at the village or district level. Predictions in (b) and (d) based on estimates in columns 5, 6, and 8 in Table 2, with predicted killings aggregated at the village or district level. Kernel densities obtained using an Epanechnikov kernel and Silverman’s (1986) rule-of-thumb bandwidth. See text for further details.

In sum, while the qualitative findings in Nepal et al. (Reference Nepal, Bohara and Gawande2011) remain after accounting for one-sided heteroskedastic measurement error using a SF model, the quantitative importance of economic variables—inequality and poverty—is found to be much larger. Thus, the authors conclusion that local economic conditions are salient determinants of internal conflict is enhanced. Moreover, our estimates reveal that the reported number of killings may significantly under count the actual death toll.
4.2 Criminal Activity
Next, we revisit some of the analysis in Galiani, Rossi, and Schargrodsky (Reference Galiani, Rossi and Schargrodsky2011). Footnote 16 The study investigates the causal effect of peace time military service on subsequent criminal behavior using data from Argentina. The study is motivated by the numerous calls around the globe for conscription as a tool to combat youth criminal activity. The main estimating equation in Galiani et al. (Reference Galiani, Rossi and Schargrodsky2011) is
 $$ \begin{align} y_{ij}^{\ast }=x_{ij}\beta +\alpha _{j}+v_{ij}, \end{align} $$
where
 $y_{ij}^{\ast }$
is the crime rate of individuals in cohort i (
 $ i=1,958,\ldots ,1,962$
) with a national identification number containing the last three digits j (
 $j=000,001,\ldots ,999$
),
 $x_{ij}$
is a vector of covariates,
 $\alpha _{j}$
are cohort fixed effects, and
 $v_{ij}$
is a well-behaved error term. The observed variable,
 $y_{ij}$
, comes from individual-level administrative records. Specifically, any individual ever prosecuted for or convicted of a crime is recorded in the data. The fraction of individuals in each cohort-identification number cell with a criminal record constitutes the observed crime rate. Because of the possibility of some criminal activity going undiscovered, the true crime rate is likely to exceed the observed crime rate. Thus,
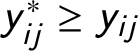 $y_{ij}^{\ast }\geq y_{ij}$
which implies that
 $s=1$
in (2). The SF model is given by
 $$ \begin{align} y_{ij}=x_{ij}\beta +\alpha _{j}-u_{ij}+v_{ij}. \end{align} $$
The set of covariates includes the fraction of each cohort-identification number cell that served in the military, the percent of Argentine-born indigenous individuals, the percent of naturalized citizens, and the percent from each of 24 districts. The sample size is 5,000 (five cohorts times 1,000 three digit endings on national identification numbers). The variance of the error term is modeled as
 $$ \begin{align} \sigma _{u_{ij}}^{2}=\exp (z_{ij}\gamma ), \end{align} $$
where
 $z_{ij}$
includes an intercept, the percent of Argentine-born indigenous individuals, the percent of naturalized citizens, and cohort fixed effects. The NLLS model is similar except that controls for district are omitted, as are the cohort fixed effects in the variance of the error term. These omissions are needed as otherwise the NLLS model does not converge.
Finally, the authors are concerned about the possible endogeneity of their primary regressor of interest, conscription. As such, they instrument for military service using a single instrument: whether the individuals with a particular combination of the final three digits of their national identification number in a particular cohort were randomly chosen, via lottery, to be draft eligible. The authors also estimate reduced form specifications, where an indicator for being draft eligible replaces the conscription variable.
Again, we address endogeneity via a control function approach with bootstrap standard errors. Specifically, (20) is augmented with the first-stage residual, becoming
 $$ \begin{align} y_{ij}=x_{ij}\beta +\alpha _{j}+\widehat{\eta }_{ij}-u_{ij}+v_{ij}, \end{align} $$
where
 $\widehat {\eta }_{ij}$
is the estimated residual from the first-stage model given by
 $$ \begin{align} x_{1ij}=w_{ij}\pi +\alpha _{j}+\eta _{ij}. \end{align} $$
In (20),
 $x_{1ij}$
represents the element of x corresponding to the conscription covariate and
 $w_{ij}$
is a vector including the excluded instrument and remaining (exogenous) elements of x.
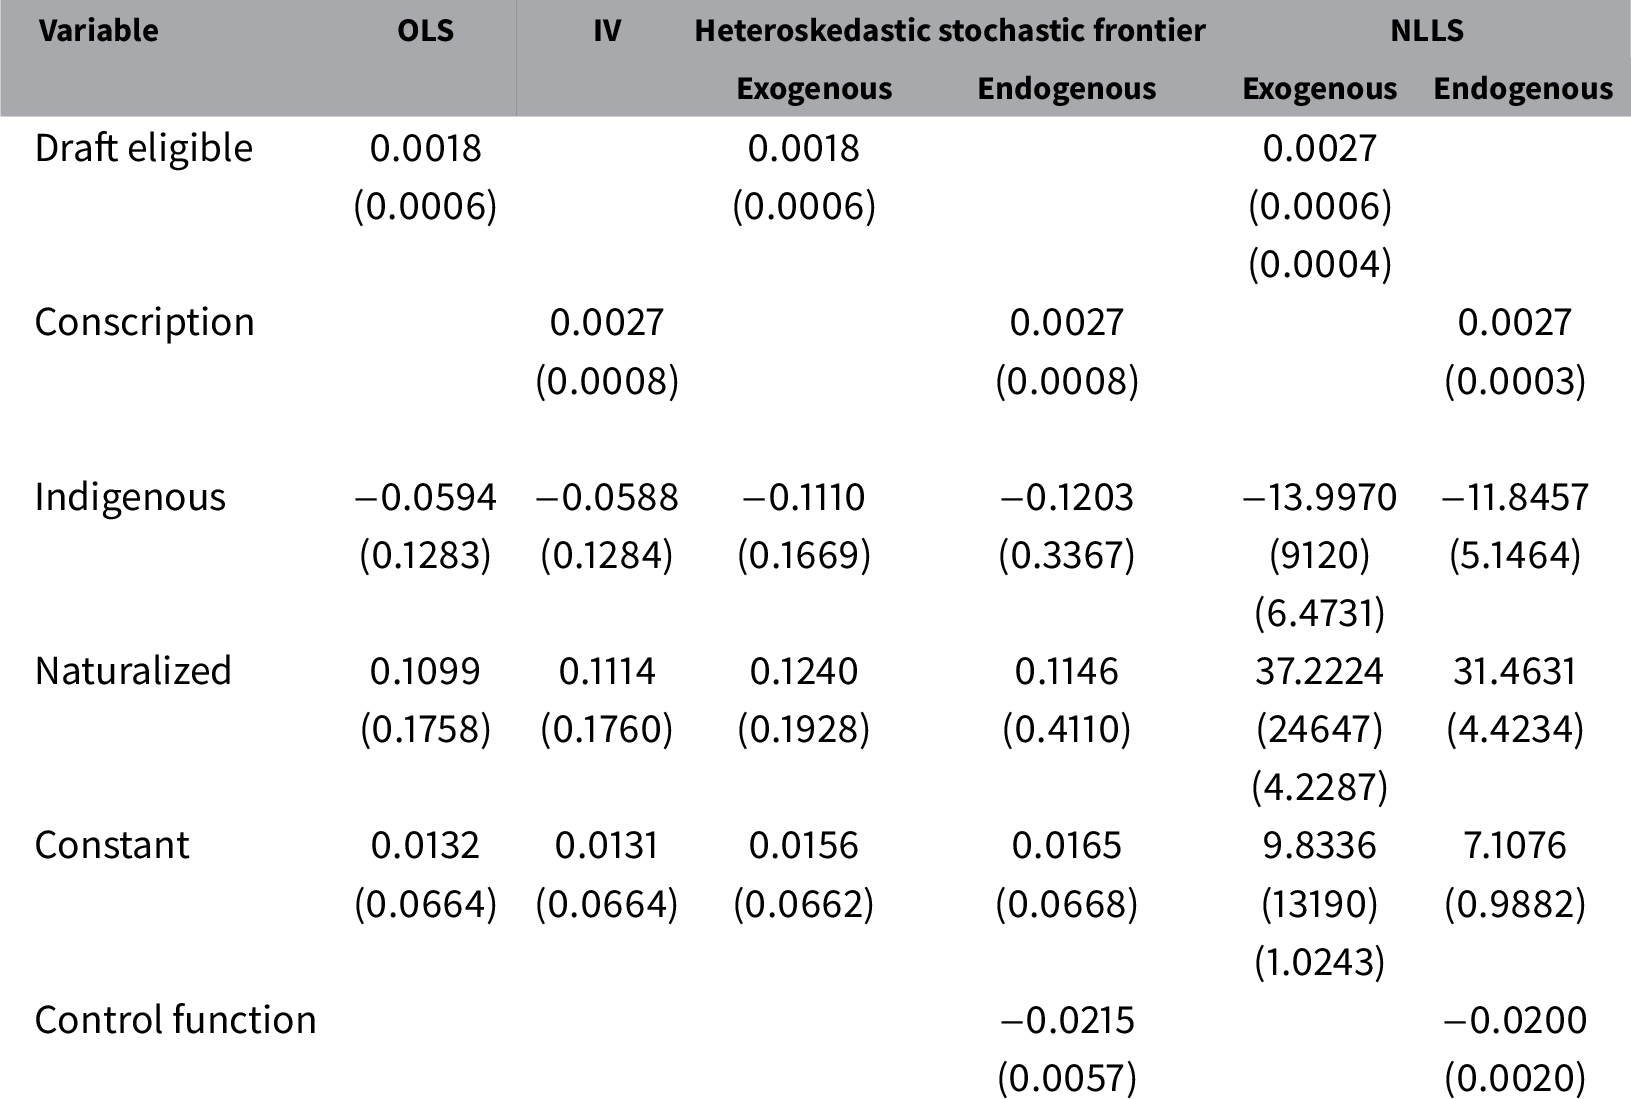
Coefficient estimates are presented in Table 4. The OLS and IV estimates are identical to columns 2 and 4 in Table 4 in Galiani et al. (Reference Galiani, Rossi and Schargrodsky2011). While not shown, the variance of the one-sided error component is found to be, at best, marginally related to the covariates included in (21). This is consistent with the results from Pagan and Hall (Reference Pagan and Hall1983) tests of heteroskedasticity applied to the original models in Galiani et al. (Reference Galiani, Rossi and Schargrodsky2011); the null of homoskedasticity is never rejected (
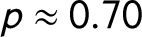 $p\approx 0.70$
in all cases). However, we easily reject the null that the error term in the original models are not skewed (
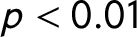 $p<0.01$
in all cases). Moreover, as shown in Galiani et al. (Reference Galiani, Rossi and Schargrodsky2011), the reduced form effect of being draft eligible or the causal effect of conscription does not change when covariates are included in the model. Together, this suggests that we do not expect the reduced form effect of being draft eligible or the causal effect of conscription to change when allowing for the possibility of one-sided measurement error. Indeed, this is what we find. This is comforting in that allowing for the possibility of one-sided, heteroskedastic measurement error does not alter the findings when, in fact, heteroskedasticity is not present or at least not believed to be problematic.
Determinants of crime rates in Argentina: 1958–1962 cohorts

Abbreviations: IV, instrumental variable; NLLS, nonlinear least squares; OLS, ordinary least squares.
Notes: All regressions also include controls for cohort. All regressions except for those estimated via NLLS also include controls for district. Robust standard errors in parentheses for the OLS, IV, and exogenous stochastic frontier models. Standard errors obtained from 500 bootstrap repetitions for the endogenous stochastic frontier and NLLS models. Robust standard errors computed as in Davidson and MacKinnon (2004) are in parentheses immediately under the point estimates for the exogenous NLLS model; standard errors from 500 bootstrap repetitions are provided beneath these for comparison. Number of observations = 5, 000. Heteroskedasticity refers to the variance of the one-sided error and depends on cohort, indigenous, and naturalized in the stochastic frontier models; heteroskedasticity of the measurement error depends on indigenous and naturalized in the NLLS models.
Specifically, the SF estimates of the reduced form effect of being draft eligible and the causal effect of conscription are identical to those in Galiani et al. (Reference Galiani, Rossi and Schargrodsky2011). Coefficient estimates on the remaining controls are also qualitatively unchanged. The NLLS estimate of the causal effect of conscription is also identical to Galiani et al. (Reference Galiani, Rossi and Schargrodsky2011). However, the NLLS estimate of the reduced form effect of being draft eligible is larger (and identical to causal effect of conscription). Finally, the NLLS estimates of other covariates in the model are vastly different from the other models. As in the previous application, this results from the more tenuous identification in the NLLS model relative to the SF model that incorporates distributional assumptions which aid identification.
4.3 Pollution
Lastly, we revisit some of the analysis in Kono (Reference Kono2017).Footnote
17
The study investigates the causal effect of country-level tariff reductions on per capita carbon dioxide (CO
 $_{2}$
) emissions. The main estimating equation in Kono (Reference Kono2017) is
 $$ \begin{align} \ln (y_{it}^{\ast })=x_{it}\beta +\alpha _{i}+v_{it}, \end{align} $$
where
 $y_{it}^{\ast }$
captures per capita CO
 $_{2}$
emissions in country i in period t (
 $t=1988,\ldots ,2013$
),
 $x_{ij}$
is a vector of covariates,
 $ \alpha _{i}$
are country fixed effects, and
 $v_{it}$
is a well-behaved error term. The observed variable,
 $y_{ij}$
, comes from the World Banks’s World Development Indicators. The World Bank states that the measure is derived from data on country-level fossil fuel consumption obtained from the United Nations Statistics Division’s World Energy Data Set, along with data from the U.S. Department of Interior’s Geological Survey on the global cement manufacturing.Footnote
18
In turn, the United Nations states that data on country-level fossil fuel consumption comes from annual questionnaires administered to “national statistical offices, ministries of energy or other authorities responsible for energy statistics in the country.”Footnote
19
In addition to the potential for countries to under-report their fossil fuel consumption for political reasons, particularly for counties that are parties to the Kyoto Protocol, the World Bank notes that the measure of CO
 $ _{2}$
emissions “excludes emissions from land use such as deforestation.”Footnote
20
Thus,
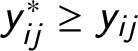 $y_{ij}^{\ast }\geq y_{ij}$
which implies that
 $s=1$
in (2). The SF model is given by
 $$ \begin{align} \ln (y_{it})=x_{it}\beta +\alpha _{i}-u_{it}+v_{it}. \end{align} $$
The set of covariates includes the average applied tariff on manufacturing goods, an indicator for being a party to the Kyoto Protocol, log per capita gross domestic product (GDP), lagged log per capita CO
 $_{2}$
emissions, and a quartic time trend. The sample is an unbalanced panel of 1,906 observations across 152 countries. The variance of the error term is modeled as
 $$ \begin{align} \sigma _{u_{it}}^{2}=\exp (z_{it}\gamma ), \end{align} $$
where
 $z_{it}$
includes an intercept, log per capita GDP and its quadratic, lagged log per capita CO
 $_{2}$
emissions and its quadratic, an indicator for being a party to the Kyoto Protocol, and three pairwise interactions between log per capita GDP, lagged log per capita CO
 $_{2}$
emissions, and the binary measure of the Kyoto Protocol. The NLLS model is identical.
Finally, the author is concerned about the possible endogeneity of their primary regressor of interest, manufacturing tariffs.Footnote 21 As such, this variable is instrumented for using two instruments: years since the conclusion of the Uruguay Round interacted with an indicator for whether country i is a World Trade Organization (WTO) member and the average tariff rate in country i’s contiguous neighbors. The sample size is 1608 in the models allowing for endogeneity.
Again, we address endogeneity via a control function approach with bootstrap standard errors. Specifically, (25) is augmented with the first-stage residual, becoming
 $$ \begin{align} \ln (y_{it})=x_{it}\beta +\alpha _{i}+\widehat{\eta }_{it}-u_{it}+v_{it}, \end{align} $$
where
 $\widehat {\eta }_{it}$
is the estimated residual from the first-stage model given by
 $$ \begin{align} x_{1it}=w_{it}\pi +\alpha _{i}+\eta _{it}. \end{align} $$
In (25),
 $x_{1it}$
represents the element of x corresponding to the tariff covariate and
 $w_{it}$
is a vector including the excluded instruments and remaining (exogenous) elements of x. Note, in the model treating manufacturing tariffs as endogenous,
 $z_{it}$
in (26) includes all the covariates from the model assuming exogeneity plus the two instruments, their quadratics, and all pairwise interactions between the covariates.
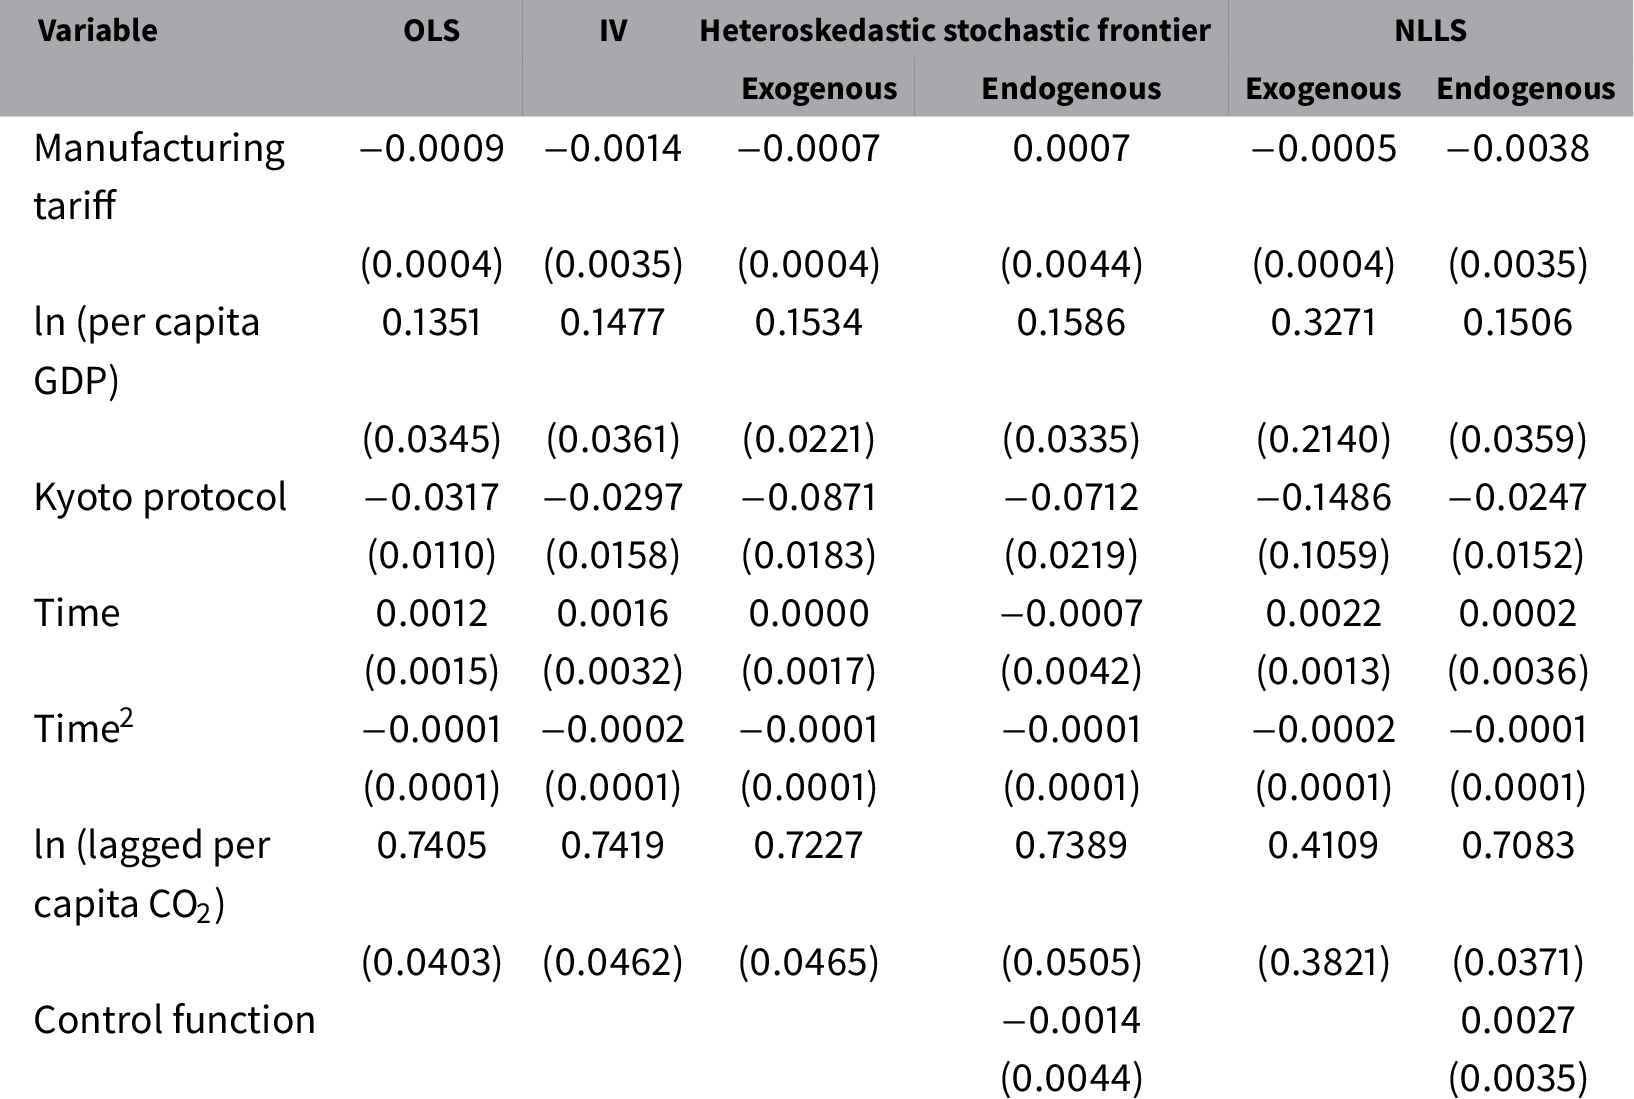
Coefficient estimates are presented in Table 5. The OLS and IV estimates are identical to columns 1 and 2 in Table 4 in Kono (Reference Kono2017). Pagan and Hall (Reference Pagan and Hall1983) tests of heteroskedasticity always reject the null of homoskedasticity (
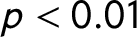 $p<0.01$
in all cases) in the original models. Similarly, we easily reject the null that the error term in the original models are not skewed (
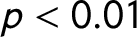 $p<0.01$
in all cases). While not shown, the variance of the one-sided error component is found to be at least marginally related to the covariates included in (26). That said, the SF estimates are mostly in agreement with Kono (Reference Kono2017). The sole exception relates to the impact of being a member of the Kyoto Protocol. Whereas Kono (Reference Kono2017) finds that members have about 3% lower per capita CO
 $_{2}$
emissions on average, the SF models indicate an 8% reduction. In contrast, while the NLLS estimates under endogeneity are similar to the IV estimates in Kono (Reference Kono2017), the NLLS estimates under exogeneity differ (although the signs of the coefficients are in agreement). As in the previous applications, this appears to arise from the more tenuous identification in the NLLS model as suggested by the larger standard errors.
Determinants of per capita carbon dioxide emissions.

Abbreviations: IV, instrumental variable; NLLS, nonlinear least squares; OLS, ordinary least squares.
Notes: All regressions also include controls for cohort. All regressions except for those estimated via NLLS also include controls for district. Clustered standard errors in parentheses for the OLS, IV, and exogenous stochastic frontier and NLLS models. Standard errors obtained from 500 bootstrap repetitions for the endogenous stochastic frontier and NLLS models. Number of observations = 1,906 in models under exogeneity and 1,608 in models under endogeneity. Heteroskedasticity refers to the variance of the one-sided error and depends on in the models under exogeneity; in the models under endogeneity.
5 Conclusion
Nonclassical measurement error in the dependent variable can be problematic in a linear regression framework, especially if it is heteroskedastic. This holds even if the measurement error is “small.” This article draws researchers’ attention to potential solutions. While it is not a panacea, the usage of SF and NLLS models should be a part of the researcher’s tool box when there is concern of asymmetric, heteroskedastic measurement error. Moreover, recent developments in the SF literature allow for semiparametric specifications of the model, as well as an assessment of the determinants of the measurement error. Future research ought to explore alternative methods of addressing skewed, systematic measurement error. In particular, research is needed to address this problem in situations where the outcome is not continuous, but rather a limited dependent variable such as a binary, multinomial, or count random variable, as these frequently appear in empirical research.
Finally, concerning recommendations for best practice, our results here point to, at a minimum, practitioners checking their residuals for both heteroskedasticity and skewness. If there is evidence of both and there is suspicion that measurement error in the dependent variable exists, then it is likely that some of the initial estimates are biased.
Acknowledgments
The authors thank Li Gan, Kishore Gawande, Ian McDonough, Robin Sickles, and seminar participants at Texas Econometrics Camp XXIII for helpful comments. The editor and three anonymous referees provided critical comments that greatly improved the paper. The usual caveat applies.
Data Availability Statement
Replication code for this article has been published in Code Ocean, a computational reproducibility platform that enables users to run the code, and can be viewed interactively at Millimet and Parmeter (Reference Millimet and Parmeter2020a). A preservation copy of the same code and data can also be accessed via Harvard Dataverse at Millimet and Parmeter (Reference Millimet and Parmeter2020b).
Supplementary Material
For supplementary material accompanying this paper, please visit https://doi.org/10.1017/pan.2020.45.