I. INTRODUCTION
Magnesium and its alloys have been extensively used as biodegradable implant materials for medical applications, Reference Roth, Schumacher, Basler, Baumert, Seitz, Evertz, Müller, Bäumer and Kietzmann1,Reference Razavi, Fathi and Meratian2 because of their good mechanical and biocompatible properties. Reference Hu, Shaokang, Zhang, Ren, Wen, Zeng and Peng3 Although the absorption rates of magnesium alloys, such as AZ31, AZ91, and MgCa, are less than that of pure magnesium, their corrosion rates must still be controlled. Reference Surmenev and Surmenev4,Reference Cao, Wang, Fu, Hu, Guan, Zhang, Wang and Zhu5 Using biocompatible coatings, such as calcium phosphate materials, on magnesium alloy surfaces can significantly reduce the corrosion rate of biodegradable implant in the body environment. Reference Surmenev and Surmenev4,Reference Fekry, Ghoneim and Ameer6 Hydroxyapatite (HA) is a bioactive material with Ca10(PO4)6(OH)2 chemical composition Reference Kiahosseini, Afshar, Larijani and Yousefpour7,Reference Ma, Wang, Zhong, Gong, Li and Jiang8 that has been widely used in dental Reference Miniach, Śliwak, Moyseowicz and Gryglewicz9 and orthopedic applications to enhance biocompatible implant materials. Reference Wei fan, An, Guo, Wei and Hou10–Reference Dorozhkin14 HA coating can be used for increasing biocompatibility, Reference Kiahosseini, Afshar, Larijani and Yousefpour15,Reference Sánchez-Arévalo, Muñoz-Ramírez, Álvarez-Camacho, Rivera-Torres, Maciel-Cerda, Montiel-Campos and Vera-Graziano16 and it prevents implant metal corrosion during the initial stages after implants. HA coating can create acceptable mechanical properties and elastic moduli that are close to the bone of the human body. Reference Dunne, Levy, Hakimi, Aghion, Twomey and Santon11,Reference Bo Niu, Wei, Shanshan, Li and Chen12,Reference Kulpetchdara, Limpichaipanit, Rujijanagul, Randorn and Chokethawai17 Considering the HA brittleness, researchers have used a combination of alternative apatite that has a similar chemical composition and inorganic phase to the bone. Reference Erzsebet Sara Bogya and Barabas18 HA nano-coating is a promising solution not only for delaying the biodegradation of magnesium alloys but also for promoting biomimetic behavior, which improves the effectiveness of orthopedic implants. In addition to controlling magnesium corrosion, HA nano-coating provides a desirable environment for rebuilding bone tissues. Reference Huawei Yang, Wang, Niu, Song, Xiong, Zheng, Wei and Lu19 Previous studies have utilized different coating methods, such as dipping method, plating, cathodic arc technique, chemical solution deposition, cold spray deposition, plasma electrolytic oxidation, and a deposition process involving sound acceleration for HA deposition on magnesium and its alloys. Reference Erzsebet Sara Bogya and Barabas18 Rojaee et al. Reference Ramin Rojaee and Raeissi20 was the first to successfully coat a nanohydroxyapatite structure on magnesium alloy AZ91 by dipping method. In this study, adhesion strength between HA and the metal substrate was only 4.2 MPa. Reference Ramin Rojaee and Raeissi20
The HA coating on the substrate can be stabilized through various strategies, such as adding methyl cellulose (MC) to the coating combination. Reference Wei fan, An, Guo, Wei and Hou10 An emerging research area is biocomposite coatings. Reference Oladzadabbasabadi, Ebadi, Nafchi, Karimd and Kiahosseini21 Introducing an intermediate layer between HA and the substrate is an effective way to distribute the intersection stress and increase the adhesion of coating onto substrate. Chitin (which has different derivatives, such as chitosan, chitosan oligosaccharides, and N-acetyl-d-glucosamine Reference Niu, Lin, Jiang, Chen, Wu, Liu, Wang and Tian22 ) as a polymer is a natural polysaccharide most prominently present in crustacean shells, such as those of crabs and shrimps, which has been used as biocompatible coating on metals. Reference Fekry, Ghoneim and Ameer6 Chitin has monoclinic structure with the space group of P21 and unit cell parameters of a = 11.25 Å, b = 4.82 Å, c = 9.72 Å, and β =113.7° for N-acetyl-d-glucosamine form. Reference Chamorro-Posada, Silva-Castro, Vázquez-Cabo, Martín-Ramos, López-Santos and Martín-Gil23
Many materials such as TiO2, phosphate, hydrotalcite and carbonate, etc. are used as coatings on magnesium alloys Reference Zhang, Bai, Fu, Zhang, Zhou, Wang, Zhu, Guan, Li and Hu24 but chitin with affordable price and availability hasn’t been used. Chitin as an intermediate layer can improve the outer layer adhesion. In this study, HA coating was applied on AZ91 magnesium alloy deposited with an intermediate chitin layer by dipping method.
II. MATERIALS AND METHODOLOGY
A. AZ91 substrate preparation
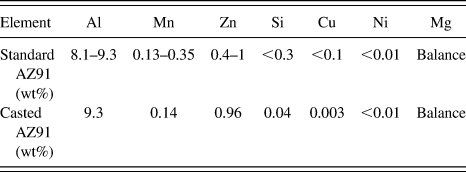
AZ91 magnesium alloy with dimensions of 20 × 5 × 1 cm was sand casted in accordance with the ASTM B80-01 standard (ASTM International, West Conshohocken, Pennsylvania). Table I shows the composition of the alloy, which was determined by a spectrometer device. The selected AZ91 substrates were cut with dimensions of 2 × 1 ×1 cm for subsequent analyses. The substrates were taken under surface preparation operation by different sand paper until the number 5000 and were finally polished. For the degreasing operation, the surface of samples were first cleaned with ethanol and then dried for 30 min in ethanol and acetone solution by ultrasound degreasing; argon was pumped as the neutral gas.
Chemical composition of standard substrate AZ91 and the used alloy (numbers are denoted by weight percentage).

B. Chitin coating deposition
To create a chitin coating, initially two solutions were prepared. For the first solution, 5 g chitin and 500 mL ethanol were poured into a beaker and stirred for 48 h to prepare a saturation solution, and for the second solution, 500 mL distilled water and 5 g carboxymethyl cellulose (CMC) were mixed and severely stirred to create a transparent and gelatinous solution. The ethanol–chitin saturation solution was added to the transparent and gelatinous solution of CMC and was rapidly stirred for 5 min. The obtained solution was passed through a Whatman filter paper to eliminate impurities. Consequently, a transparent and gelatinous solution of chitin–CMC was obtained and kept stationary for 6 h to eliminate bubbles. All of the samples were ultimately placed in a solution for 180 min, and deposition was conducted by dipping method. The chitin coating was dried for 48 h at room temperature.
C. Hydroxyapatite coating deposition
To create the HA coating on dried chitin layers, first, 500 mL of ethanol and 10 g of HA powder were poured into a beaker and stirred for 6 h to achieve an HA suspension. Then, 500 mL of distilled water was poured into the container, which was then added with 5 g of CMC powder and severely stirred to achieve a transparent and gelatinous solution. The obtained solution was passed through a Whatman filter paper to eliminate impurities and was then added to the transparent and gelatinous solution of CMC and stirred for 5 min. The samples coated with intermediate layers were placed inside the hydroxyapatite–CMC suspension, and deposition was conducted for 180, 240, 300, 360, and 420 min.
D. Analysis of deposited coatings
After the AZ91 samples were coated by chitin and HA, X-ray diffraction was performed at an angle step size of 0.02°, with a 1 s time for each stop, and in the range of 20°–80° angles for 2θ scans. To investigate the average size of the crystals and the micro strain of the coating, the Williamson–Hall equation [Eq. (1)] was used Reference Tousi, Rad, Salahi, Mobasherpour and Razavi25 :
 $$\beta \;{\rm{cos}}\;\theta = {{0.9\lambda } \over d} + 2A\varepsilon \;{\rm{sin}}\;\theta \quad .$$
In this equation, λ is the X-ray wave length (1.5406 Å), d is the crystallite size, A is fixed (usually A = 1), β is the full width at the half maximum of the XRD peaks (in radians), and θ is the Bragg angle. According to the obtained data, the diagram of β cos θ versus sin θ from existing peaks in the X-ray diffraction pattern was drawn in different angles and one straight line, with the least error coefficient passing through the drawn points. According to Eq. (1), the size of the coating crystallite size (d) was determined from the line slope of the strain and from its intercept. Reference Tousi, Rad, Salahi, Mobasherpour and Razavi25 To investigate the chemical and morphological surface factors of the coating, Fourier transform infrared spectroscopy (FTIR) and scanning electron microscope with a field emission gun (FE-SEM) were used.
An indenter penetration method was used to evaluate the adhesion of the HA/chitin coatings onto AZ91 alloy. In this technique, the brittle layers on a ductile substrate stored the elastic energy and were cracked. A conventional hardness machine with a Brinell indenter device and an optical microscope was used to evaluate the adhesion onto the substrate. This method is described in detail in the study of J.J. Kim et al. Reference Kim, Jeong, Lee and Kwon26 Although they applied this approach to DLC carbon coating, they believe that it can be applied for all brittle coatings on soft substrates. Reference Kim, Jeong, Lee and Kwon26 Therefore, this method can be used to evaluate the adhesion of the HA/chitin double layer coatings.
To evaluate the hardness and elastic modulus of the HA/chitin coatings, a Hysitron Inc. TriboScope® device with a Berkovich diamond indenter was used (Hysitron Inc., Eden Prairie, Minnesota). For this purpose, the force on the indenter was increased to 5000 μN (P max), was kept in maximum force for 5 s (holding), and finally reduced to zero (unloading). The hardness of the coating was calculated by Oliver and Pharr method, Reference Shokrieh, Hosseinkhani, Naimi-Jamal and Tourani27 as shown in Eq. (2):
 $$H = {{{P_{{\rm{Max}}}}} \over A}\quad ,$$
where P Max is the maximum vertical force on the indenter, and A is the maximum contact area between the indenter and the coating.
A potentiodynamic polarization test was used to investigate the corrosion behavior of the samples. For this purpose, a Potentiostat EG&G A-273 (Princeton Applied Research, Oak Ridge, Tennessee) and a rod platinum counter electrode with 2 mm diameter and 4 mm length were used. The potential was measured by a saturated calomel electrode. Ringer’s solution was utilized as the simulated body solution. The exposed surface of the sample to the corrosive environment was 0.28 cm2.
To obtain the best electrochemical stability, all of the samples were immersed in corrosive solution for 1 h. A potential scan rate of 1 mV/s was applied to all of the samples. The potentiodynamic polarization curve was analyzed by Tafel slope method. The corrosion potential (E corr) and the corrosion current density (I corr) were extracted.
E. Statistical analysis
ANOVA and Dunken’s Post Hoc tests were utilized to compare the means of the data compression of samples at 5% significance level. Statistical analyses were performed using SPSS software (SPSS Inc., Chicago, Illinois).
III. RESULTS AND DISCUSSION
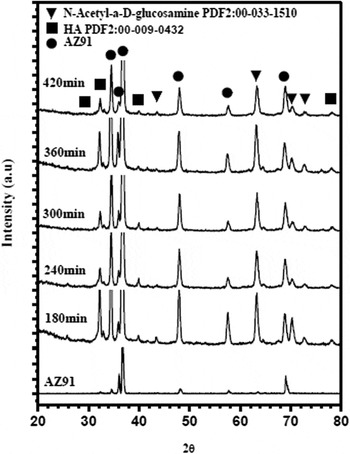
Figure 1 shows the obtained XRD results in different samples coated by HA/chitin at varying times. The relevant peaks to chitin with monoclinic structure and HA with hexagonal structure were respectively specified in accordance with the PDF2: 00-033-1510 and PDF2: 00-009-0432 standards.
Relevant peaks for XRD analysis of samples of AZ91 magnesium alloy after deposition for 180, 240, 300, 360, and 420 min.

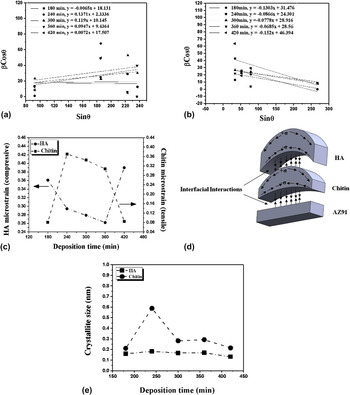
Figure 2 shows the diagram of β cos θ versus sin θ, which can reveal the crystallite size and residual strain of the chitin and HA coatings at different deposition times by Williamson–Hall method. In these figures, the diagram slope is 2ε, and its intercept is 0.9λ/d. Therefore, the residual strain (ε) and the crystallite size (d) can be obtained for each layer. Figure 2(a) shows that the chitin coating curve obtained by Williamson–Hall method has a positive slope, indicating the existence of tensile strain in the chitin crystal network. Figure 2(b) shows the Williamson–Hall diagram related to HA coating. The negative slope of the lines in this diagram is due to the compressive strain Reference Zak, Majid, Abrishami and Yousefi28 in the HA coating.
β cos θ versus sin θ plot from XRD results for (a) chitin and (b) HA coatings after 180, 240, 300, 360, and 420 min deposition, (c) effect of coating time on the micro strain of the chitin and HA crystal network, (d) schematic of the curvature and created stresses in the chitin and HA coatings, (e) effect of the coating time on the crystallite size of the chitin and HA coatings.

Figure 2(c) shows the behavior of the residual strain a crystal network with respect to the time of coating. By increasing the deposition time from 180 to 360 min, the compressive residual strain was reduced in the HA coating, whereas the tensile residual strain of the chitin coating was increased. This behavior can be justified by Stoney theory. Reference Kozuka, Kajimura, Hirano and Katayama29,Reference Feng, Huang and Rosakis30 According to this theory, if thickness of a placed coating is considerably less than that of the substrate, then Eq. (3) is established between the created stress in the coating and the curvature of the cover Reference Feng, Huang and Rosakis30 :
 $${\sigma ^{\left( f \right)}} = {{{E_{\rm{s}}}h_{\rm{s}}^2\kappa } \over {6{h_{\rm{f}}}(1 - {\nu _{\rm{s}}})}}\quad .$$
In this equation, h s and h f represent the thicknesses of the substrate and the coating, respectively; k is the coating curvature; σ(f) is the residual stress in the coating; E s and υs denote the modulus of elasticity and Poisson’s ratio of the substrate. An increase in the thickness of the coating reduced the external layer curvature, which in turn decreased the stress of the coating. As shown in Fig. 2(d), the created curvature of the two layers of coating of chitin and HA created a tensile stress on the external surface of chitin and compressive stress on its underside. A similar behavior occurred during HA coating deposition. Therefore, the effect of the HA outer layer curvature was intensified as the HA thickness was increased. As the deposition time increased from 180 min to 360 min, the compressive stress in the HA coating was reduced, and the tensile stress in the chitin layer was increased because of the adhesion between chitin and HA coating. By increasing the thickness of coating at a deposition time of 420 min, the intersection stress of two layers became sufficiently high to cause the local separation or breakage of the layers. Reference Asri, Harun, Hassan, Ghani and Buyong31 Therefore, the effect of the HA layer thickness on the interfacial stress was reduced to decrease the chitin coating tensile stress while increasing the HA coating compressive stress. In the study of Kozuka et al., Reference Kozuka, Kajimura, Hirano and Katayama29 an increase in the thickness of coating and density created the conditions for cracks in the coating, which affected the existing stress. In other words, whenever the residual strain is greater in the coating, the adhesion of layers onto each other is reduced, and the possibility of cracks in the coating is increased. Hu et al. Reference Hu, Zhang, Cui, Bai, Guan, Wang and Zhu32 and Bockmeyer et al. Reference Bockmeyer and Löbmann33 have reported that, the residual stress in deposited coatings by dipping methods increases the cracks and reduces the coating adhesion. Eq. (4), which was proposed to measure coating adhesion, can explain the behavior of the residual strain in chitin and HA coatings of different thicknesses Reference Kiahosseini, Afshar, Larijani and Yousefpour34 :
 $${\rm{EA}} = {\rm{BA}} - {\rm{IS}}\quad .$$
In this equation, IS is the internal stress, EA is the ultimate adhesion, and BA is the initial adhesion provided that residual strain is absent. Reference Kiahosseini, Afshar, Larijani and Yousefpour34 This equation is based on the value of the stress that, in most cases, as long as the force does not exceed the elastic limit, the deformation fits the force. Hooke’s Law states that the stress is proportional to the strain. Therefore, an increasing strain decreases adhesion. In this relationship, BA has a fixed initial value, which will be subtracted from the obtained value based on the residual strain. Thus, this value decreases as the strain increases.
Figure 2(e) shows the crystallite size of the chitin and HA coatings calculated by Williamson–Hall method. The crystallite size of coatings was less than 1.0 nm, indicating the existence of very fine crystals that grew at a slower rate probably because of the poor growth conditions. Given that the created coatings were evaluated prior to the heat treatment, no complete crystal structure was formed, leaving the coatings with little crystallite and amorphous-like structure. HA exists with an amorphous structure in the human bone. Reference Combes and Rey35 Thus, this structure of the HA coating can be efficiently used in the body environment.
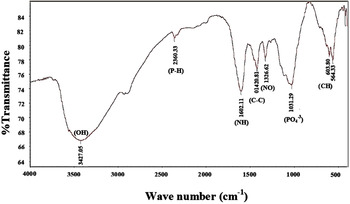
Figure 3 shows the FTIR results of the deposited layer for 300 min. The band-specific peaks and factor groups were discernible as band (OH) around 3427 cm−1 and band (PO4 −3) around 1031 cm−1, which suggest the presence of HA and chitin, band (NH) around 1603 cm−1 and band (C–C) around 1420 cm−1, which indicate the presence of chitin, band (NO) around 1326 cm−1, which shows the presence of CMC, and band (CH) around 603 cm−1, which state the presence of CMC and chitin. These factor groups were observed in all coated samples. The obtained XRD and FTIR results confirm the formation of chitin and HA coatings with chemical compositions of very fine crystals to amorphous structure.
FTIR analysis of the sputtered sample by chitin and HA on AZ91 magnesium alloy for 300 min by dipping method.

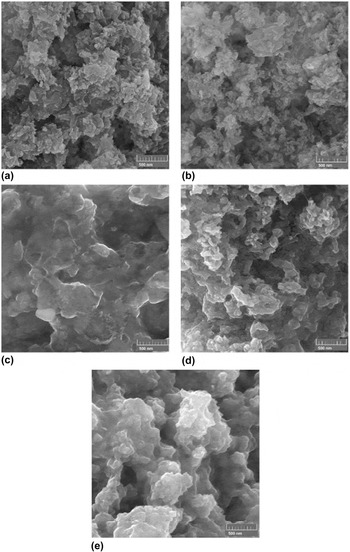
The obtained FE-SEM result (Fig. 4) indicated that by increasing the deposition time from 180 to 420 min, the grains grew and the coating density increased (porosities reduced). Increasing the coating density and the grain size increase the tensile residual strain in the coating, thereby causing cracks and reducing adhesion. The HA coating has a porous structure with interconnected pores consisting of spherical particles and stretched grains with dimensions of less than 50 nm. The HA porous structure is appropriate for engineering applications of bone tissues; so that, the interconnected porosities in coatings play an important role in cellular nutrition and waste disposal in the cells.
Images of FE-SEM at 75,000× magnification from sputtered chitin/HA coating morphology for (a) 180 min, (b) 240 min, (c) 300 min, (d) 360 min, and (e) 420 min.

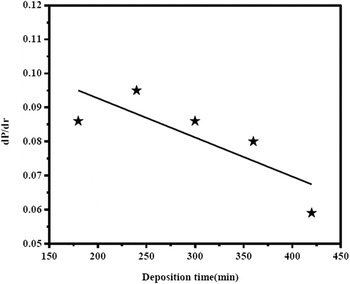
To evaluate the adhesion of coatings, the hardness test was used. The crack radius around the indentation region versus the applied load after the hardness test was measured by a micrometer installed on an optical microscope. The dP/dr ratio (P and r denote the hardness load and crack radius around the indentation region) is a coefficient related to adhesion of coatings. Figure 5 shows the variations of dP/dr with respect to the deposition time. As the thickness was increased, the interfacial stress between the layers and the substrate increased, thereby reducing the adhesion of coating onto substrate. According to the results that were investigated by FE-SEM, the grains were grown and the porosities were reduced by deposition time, and as a result, the stress in coating was increased. Therefore, the adhesion of coating is reduced by increment of thickness.
Variations of dP/dr proportional to HA/chitin coating adhesion with respect to deposition time.

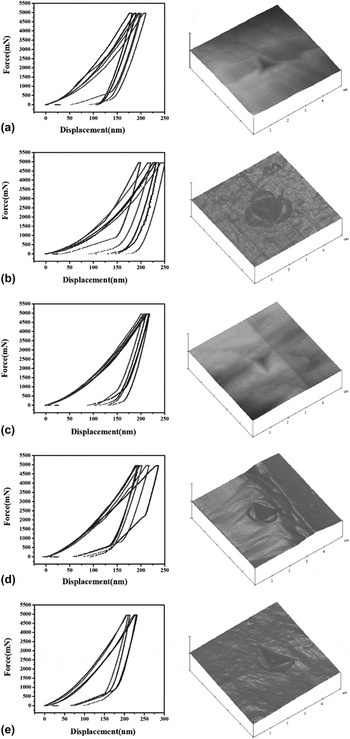
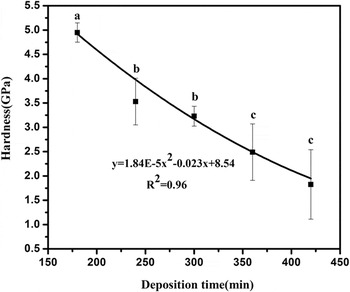
Figure 6 shows the nano-hardness test results of the HA/chitin coatings at different deposition times and the AFM images of the indenter effects on the coating. As the deposition time was increased, the dimensions of the indentation region were reduced, diminishing the hardness of the coating. Figure 7 shows the analysis of the curves for different samples. In this curve, an increase in the deposition time reduced the hardness of the coating. The results have been observed by SEM shown that, with increasing coating time, the grains were grown; consequently, the hardness of the coating was reduced. According to a study by D. Ferro et al.,
Reference Ferro, Teghil, Barinov, D’Alessio and DeMaria36
in coatings with smaller crystals (thinner coating), the grain boundary is high. Therefore, the mobility of dislocations is limited and the hardness of coating will be increased.
Reference Ferro, Teghil, Barinov, D’Alessio and DeMaria36
The Hall–patch relationship
Reference Chinizadeh and Kiahosseini37
for coatings is expressed by,
 $\sigma _{ys}^2\vskip4pt~\vskip -2pt{\raise0.7ex\hbox{$1$} \!\mathord{\left/ {\vphantom {1 h}}\right.\kern-\nulldelimiterspace}\!\lower0.7ex\hbox{$h$}}$
Reference Gerberich and Cordill38
where σys is the yield stress and h is the coating thickness. Grain size was directly related to coating thickness.
Reference Gerberich and Cordill38
Therefore, increasing the thickness and the grain size reduces the yield strength of the coating.
Results of nano-hardness test for HA/chitin coatings and AFM images from indentation region at different deposition times: (a) 180 min, (b) 240 min, (c) 300 min, (d) 360 min, (e) 420 min.

Variation of HA/chitin coatings hardness with respect to deposition time.

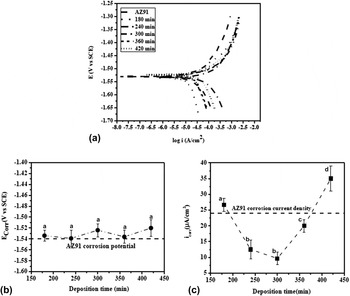
Figure 8(a) shows the potentiodynamic polarization curve of the coated samples at different deposition times. The passive behavior of these curves is not visible.
(a) Potentiodynamic polarization curves, (b) Corrosion potential curves, (c) Corrosion current density curves of AZ91 alloy coated by HA/chitin at different deposition times.

Figures 8(b) and 8(c) show that even after deposition of HA/chitin coatings as polymer-phosphate composite coatings, the corrosion potential is positive and insignificant changes can be observed, suggesting that the deposited coatings were porous. It is reported that, in polymer/phosphate composite coatings, the crosslinking of polymer chains due to the polymer and phosphate interactions is probable; therefore, the corrosion resistance can be increased. Reference Bai, Zhang, Fu, Zhang, Cui, Meng, Guan and Hu39 The corrosion current density of the coated samples at 180 and 420 min were greater than that of the uncoated substrate. Localized anodes were created on the surface probably because of the lack of complete coverage of the substrate by the HA/chitin coating at 180 min and the poor adhesion layer in the deposited sample at 420 min. Consequently, the corrosion current density was increased. When the deposition time was increased to 300 min, although the adhesion of coating was reduced, the corrosion current density was also reduced because of the increased thickness. At longer times, the protection property of coating was not good because of the decreased adhesion and the reduced thickness of the coatings due to cavities and cracks.
IV. CONCLUSION
The obtained results of the chitin/HA coating on AZ91 magnesium alloy by dipping method showed that:
-
(1) When the deposition time is increased to 360 min, the tensile residual strain is increased in the chitin coating and the compressive residual strain is decreased in HA coating.
-
(2) When the deposition time is increased to 420 min and the tensile stress in the coatings is increased, the adhesion of the two layers intersection is reduced. Consequently, the effect of the mutual forces of two layers is reduced, thereby decreasing the tensile residual strain in the chitin coating, while increasing the compressive strain in the HA coating.
-
(3) The results obtained by Williamson–Hall method reveal that the crystallite size of both coatings is very fine.
-
(4) FE-SEM indicates that the coating morphology is porous coating, and the spheroid masses of the grains increase by deposition time and are less than 50 nm for 420 min.
-
(5) By increasing the deposition time from 180 to 420 min, the hardness of the coatings can be reduced from 5 to 2 GPa.
-
(6) The corrosion current density of the deposited samples at 180 and 420 min is greater than that of the uncoated substrate because of the localized anode created by uncompleted coating and poor adhesion of coating onto substrate.
-
(7) The minimum corrosion current density is equal 10 μA/cm2 for the sample with 300 min deposition time.