





Introduction
Toxoplasma gondii is a zoonotic obligate intracellular protozoan which infects warm-blooded vertebrates. It has an indirect life cycle where wild and domestic felids are the definitive hosts, excreting oocysts in faeces (Dubey, Reference Dubey2016). Wild ruminants can get infected through ingestion of highly resistant oocysts present in water or on vegetation, making them useful indicators of the level of the contamination of the environment, while carnivorous or omnivorous species can also acquire infection through predation or scavenging of infected intermediate hosts (Gilot-Fromont et al. Reference Gilot-Fromont, Lélu, Dardé, Richomme, Aubert, Afonso, Mercier, Gotteland and Villena2012). Game species represent a potential risk to human health through the consumption of raw or undercooked game meat (Guardone et al. Reference Guardone, Armani, Mancianti and Ferroglio2022). In addition, herbivores may significantly contribute to T. gondii epidemiology as a potential source of infection for other animals, either intermediate or definitive hosts (Tsokana et al. Reference Tsokana, Sokos, Giannakopoulos, Birtsas, Valiakos, Spyrou, Athanasiou, Rodi Burriel and Billinis2020). The Food and Agriculture Organization of the United Nations (2014, FAO) identified toxoplasmosis among the 10 most important foodborne diseases (https://www.fao.org/newsroom/detail/-Top-Ten-list-of-food-borne-parasites-released/en, accessed on 27/09/2024).
Human and animal population density (both for definitive and intermediate hosts) is a key parameter influencing the prevalence of T. gondii in game species (Gauss et al. Reference Gauss, Dubey, Vidal, Ruiz, Vicente, Marco, Lavin, Gortazar and Almería2005; Beral et al. Reference Beral, Rossi, Aubert, Gasqui, Terrier, Klein, Villena, Abrial, Gilot-Fromont and Richomme2012; Barroso et al. Reference Barroso, García-Bocanegra, Acevedo, Palencia, Carro, Jiménez-ruiz, Almería, Dubey, Cano-terriza and Vicente2020) and represents a much-needed denominator for epidemiological studies and disease risk assessments (Cardoso et al. Reference Cardoso, García-Bocanegra, Acevedo, Cáceres, Alves and Gortázar2022; ENETWILD-consortium et al. Reference Gavier‐widen, Ferroglio, Smith, Gonçalves, Vada, Zanet, Gethöffer, Keuling and Staubach2023a). With a continent-wide effort, maps of wild ungulates and carnivores densities from hunting bag statistics have been produced as outputs of the ENETWILD Consortium (Illanas et al. Reference Illanas, Croft, Smith, Vicente, Blanco‐Aguiar, Scandura, Apollonio, Ferroglio and Keuling2023b; ENETWILD-consortium et al. Reference Croft, Blanco‐Aguiar, Acevedo, Illanas, Vicente, Warren and Smith2024), a network of wildlife specialists across Europe that, among several aims, also harmonizes wildlife data collection. While climatic factors such as temperature and rainfall affect oocyst survival and thereby contribute to temporal fluctuations in prevalence (Beral et al. Reference Beral, Rossi, Aubert, Gasqui, Terrier, Klein, Villena, Abrial, Gilot-Fromont and Richomme2012; Barroso et al. Reference Barroso, García-Bocanegra, Acevedo, Palencia, Carro, Jiménez-ruiz, Almería, Dubey, Cano-terriza and Vicente2020; Lizana et al. Reference Lizana, Gortázar, Muniesa, Cabezón, Martí-marco, López-ramon and Cardells2021), spatial features – including proximity to water bodies or areas used by definitive hosts – can further modulate wildlife infection risk (Almeria et al. Reference Almeria, Calvete, Pages, Gauss and Dubey2004; Barroso et al. Reference Barroso, García-Bocanegra, Acevedo, Palencia, Carro, Jiménez-ruiz, Almería, Dubey, Cano-terriza and Vicente2020).
The objective of this study was to model the spatial risk of T. gondii seropositive game animals in an alpine region lacking wild definitive hosts and with limited domestic cat presence.
Materials and methods
Study area
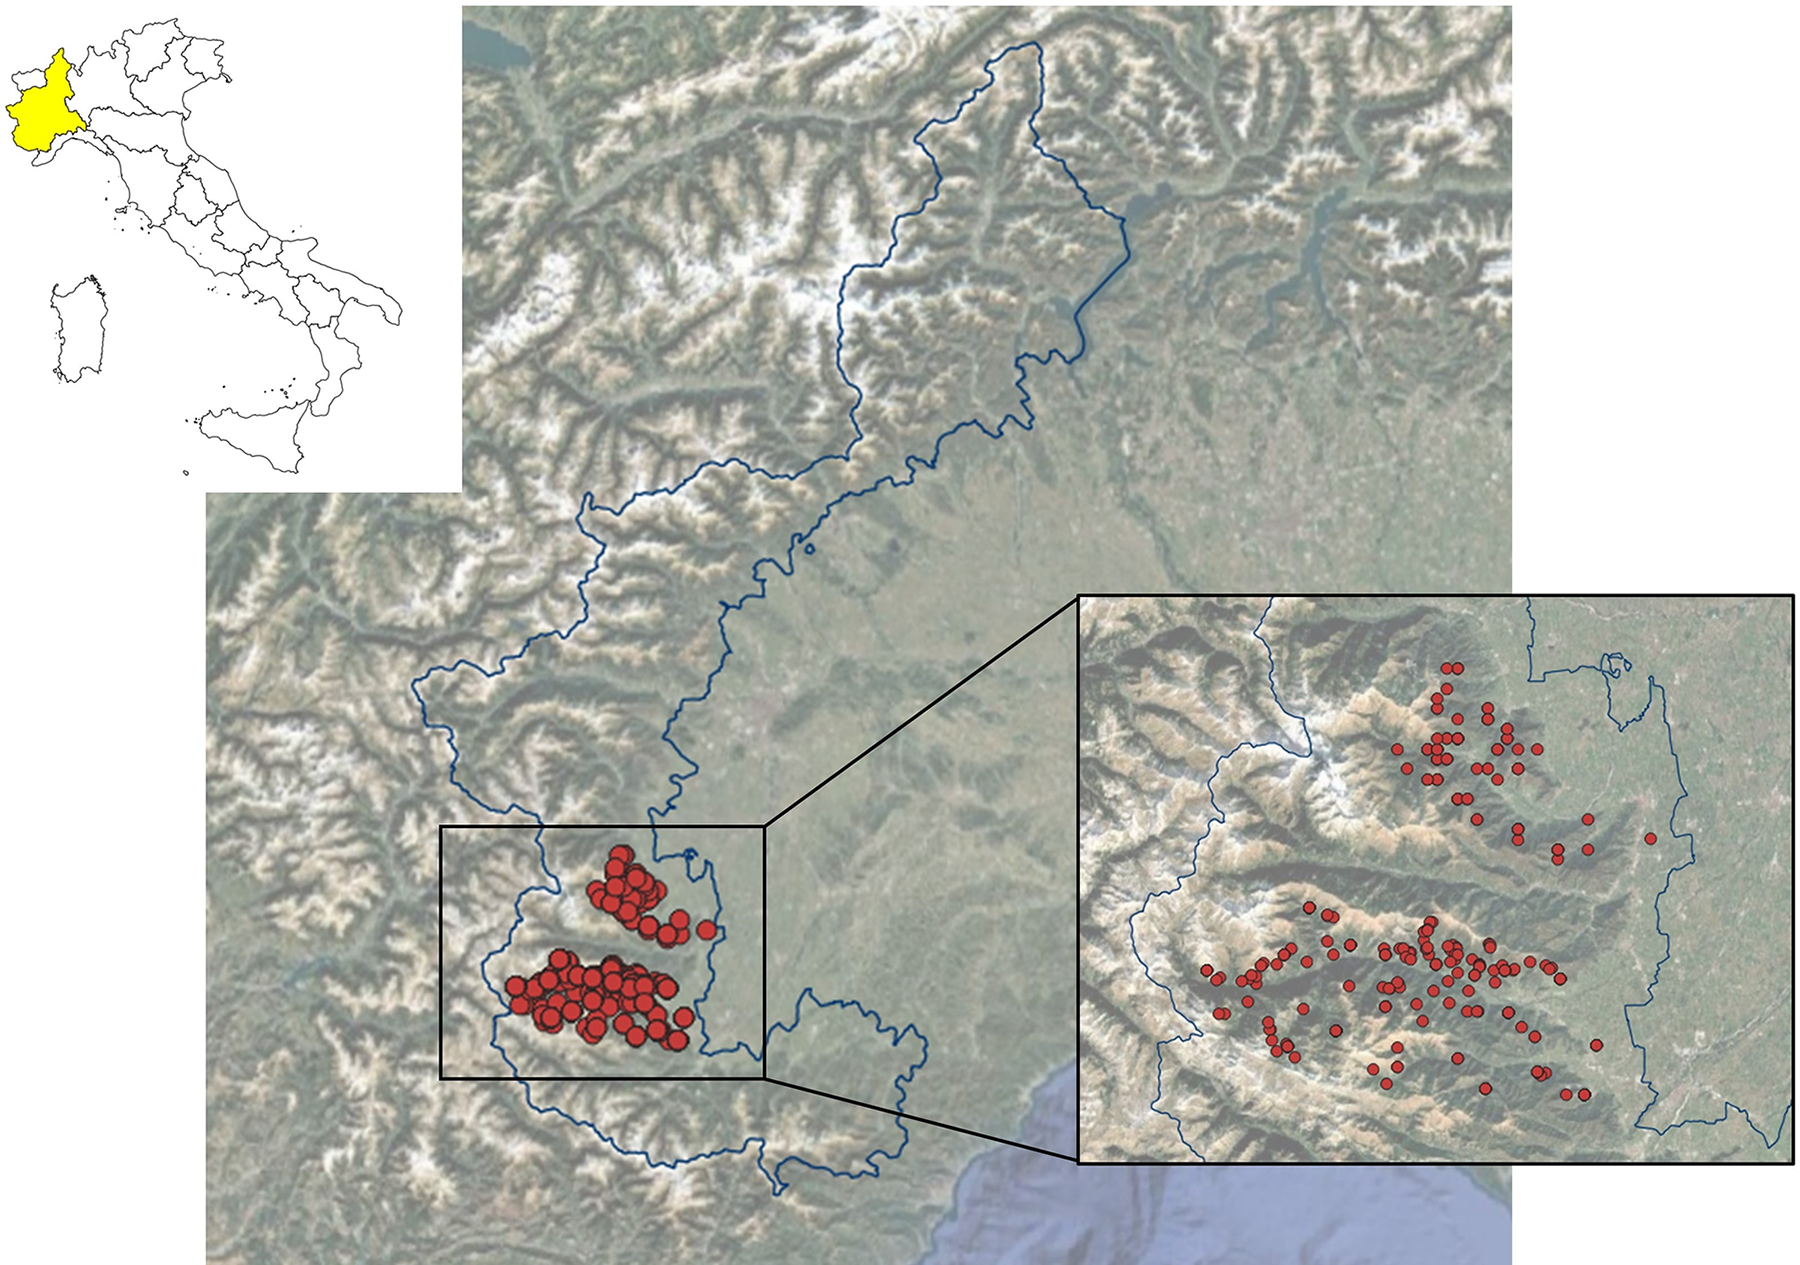
Our study area included 2 alpine hunting districts in Piedmont region, North-West Italy, CACN1 and CACN3 (Figure 1). CACN1 broadens for 38,307 ha through an alpine valley with a population density of 27.91 inhabitants/km2. CACN3 encompasses an area of 56 700 ha which registers a population density of 20.28 inhabitants/km2. Altitude ranges from 500 m a.s.l. to above 3000 m a.s.l., characterized by a continental and alpine climate. Mammal species included in the hunting plan in the study areas comprise wild ungulates (wild boar, Sus scrofa, red deer, Cervus elaphus, roe deer, Capreolus capreolus, alpine chamois, Rupicapra rupicapra), red fox (Vulpes vulpes) and European brown hare (Lepus europaeus). In both areas, domestic cat is the only definitive host for T. gondii as the European wild cat (Felis silvetris) is not reported in the study area (Gerngross et al. Reference Gerngross, Ambarli, Angelici, Anile, Campbell, Ferreras de Andres, Gil-sanchez, Götz, Jerosch and Mengüllüoglu2022). No registry is available to estimate domestic cat density, but it is expected to be scarce both because of the low density of inhabitants and land use. Climatic conditions, ecosystems, land use and wildlife management were comparable in the 2 hunting districts.
Study sampling map. In red, culling locations of the sampled animals. In blue, the boundaries of the alpine region for which predictions were elaborated.

Figure 1 Long description
A small inset map of Italy shows internal administrative boundaries and highlights one region in the northwestern part of the country. The main map is a thematic map drawn over a satellite relief basemap with mountain ridges and valleys visible. North is at the top. Two irregular areas are outlined with boundary lines, and a rectangular callout box marks a smaller area in the southwestern part of the main map. A larger inset on the right is connected to that callout box by two straight connector lines and shows a zoomed view of the same outlined area. Across the callout area and the zoomed inset, many circular point markers indicate culling locations. The markers vary in size, with both smaller and larger circles visible. In the zoomed inset, the points form two main clusters, one in the upper part of the inset and another in the lower part, with additional scattered points between and around the clusters. No legend, scale bar, north arrow, or place-name labels are visible.
Sampling and testing
Opportunistic sampling of game species hunted for human consumption (wild boar, roe deer, red deer, chamois and hare) was conducted at the game control centre during the 2022/2023 hunting season. From each wild boar, 10 g of diaphragm tissue were collected by hunting managers, in accordance with routine Trichinella surveillance, while hunters collected 10 g of lung tissue from the remaining species, given the ease of identifying and sampling pulmonary tissue in the field. Samples were immediately frozen in plastic bags at −20°C and then sent to the Department of Veterinary Sciences of the University of Torino for further analysis. Contextually, we recorded for each sampled animal: species, sex, age class and spatial coordinates of culling site.
From muscle we collected the thawing liquid (meat juice) up to 2 mL in a plastic tube, as per instruction of the sampling kit. In lungs, 2.5 g of tissue were cut into 4–5 pieces and left at room temperature for 20 min in a tube containing 2 mL of PBS at pH 7.2. The tube was agitated for 4 min and centrifuged at 800 g for 10 min. The lung pieces were removed, and the supernatant was collected and stored at −20°C (same protocol as described in: Ferroglio et al. Reference Ferroglio, Rossi and Gennero2000).
The samples were analysed for antibodies against T. gondii using a commercial indirect enzyme-linked immunosorbent assay (ELISA; ELISA ID Screen Toxoplasmosis Indirect Multi-species, IDvet, Grabels, France), following the instructions of the manufacturer for lung extract and meat juice. The samples and the controls provided in the kit were analysed in duplicate. Kit sensitivity is reported to range, for meat juice from 3.6 to 96.7% and 83.9 to 100% across different animal species, and 100% specificity.
Statistical analysis
Seroprevalence per species, with 95% confidence intervals, was calculated in R Studio (R Core Team, 2023) and statistical differences between sexes and age classes through Chi-squared test.
To the georeferenced site of culling for each animal, we associated:
1 The density of inhabitants of the municipality which included the culling site. This information was taken from 2021 national census (https://www.istat.it/statistiche-per-temi/censimenti/popolazione-e-abitazioni/risultati/, accessed on 10/05/2024). The density of inhabitants was considered as a proxy of domestic cat density, as no official registry is available for this species.
2 The density of wild boar. The density map was downloaded from the outputs of the ENETWILD Consortium, as published in the respective scientific report (ENETWILD-consortium et al. Reference Croft, Blanco‐Aguiar, Acevedo, Illanas, Vicente, Warren and Smith2024). It has a resolution of 2 × 2 km and a Europe-wide coverage. It was modelled from hunting bags statistics, observation data and camera trap monitoring. We sampled the raster value corresponding to the georeferenced point where the animal was culled in R Studio, with packages raster (Hijmans, Reference Hijmans2018) and sf (Pebesma and Bivand, Reference Pebesma and Bivand2023). In other words, we corresponded the density value of the raster for the 2 × 2 km square including the culling site coordinates.
3 The density of red fox. Red fox has been found to positively correlate with T. gondii seropositivity in wild ruminants (Barroso et al. Reference Barroso, García-Bocanegra, Acevedo, Palencia, Carro, Jiménez-ruiz, Almería, Dubey, Cano-terriza and Vicente2020). Indeed, fox population showed a lagged response to rodent density (Lindström et al. Reference Lindström, Andrén, Angelstam, Cederlund, Hörnfeldt, Jäderberg, Lemnell, Martinsson, Sköld and Swenson1994; Panek and Kamieniarz, Reference Panek and Kamieniarz2017), which are documented prey of wild boar and potential source of T. gondii infection (Schley and Roper, Reference Schley and Roper2003; Ballari and Barrios‐García, Reference Ballari and Barrios‐García2014). Similarly to the previous one, this output of the ENETWILD Consortium has a resolution of 10 × 10 km and a Europe-wide coverage (Illanas et al. Reference Illanas, Croft, Smith, Vicente, Blanco‐Aguiar, Scandura, Apollonio, Ferroglio and Keuling2023b). Raster sampling was performed as previously described.
4 The distance to the nearest human settlement. We downloaded and rasterized the Corine Land Cover shapefile downloaded from Geoportale Piemonte (https://geoportale.igr.piemonte.it/cms/, accessed on 14/05/2024) then, with the proximity tool of QGIS we created a raster where each cell represented the distance to the nearest cell with the value ‘1.1. Urbanized areas’. Raster sampling was performed as previously described.
5 Landscape fragmentation Effective Mesh Density. The Effective Mesh Density is a measure of the degree to which movement between different parts of the landscape is interrupted by a Fragmentation Geometry, defined as the presence of impervious surfaces and traffic infrastructure, including medium sized roads and larger. Higher effective mesh density values indicate greater fragmentation. Habitat fragmentation parameter influences connections and animals movement and may be related to abundance of rodents and small medium sized mammals, which serve as intermediate hosts capable of transmitting T. gondii to wild boar through predation (Holland and Bennett, Reference Holland and Bennett2010; Cho et al. Reference Cho, Lee and Rhim2022). In addition, fragmentation was expected to quantify the presence of places where infective contacts may occur between wildlife and areas frequented by cats (Richomme et al. Reference Richomme, Afonso, Tolon, Ducrot, Halos, Alliot, Perret, Thomas, Boireau and Gilot-Fromont2010). The dataset was downloaded from EEA geospatial portal (https://sdi.eea.europa.eu/catalogue/idp/api/records/98d63709-5a79-44a8-ac5b-fd9a08466bf1, accessed on 17/05/2024). The geographic coverage of the dataset is the 39 countries of the European Economic Area (EEA-39). Raster sampling was performed as described for previous variables.
To assess the relationship between these factors and the serological positivity to T. gondii, we implemented univariate and multivariate regression analyses. The serological test outcome was used as the binary response variable. The explanatory variables included sex, age (divided into 2 categories, within and over 12 months of age), human population density, wild boar density, red fox density, distance to the nearest human settlement and landscape fragmentation as measured by effective mesh density. We implemented a Linear Regression with a binomial family for the univariate analysis and a Generalized Linear Mixed Model (GLMM) with a binomial family for the multivariate analysis and the culling location as the random factor. Best GLMM was selected through Akaike Information Criterion stepwise model selection.
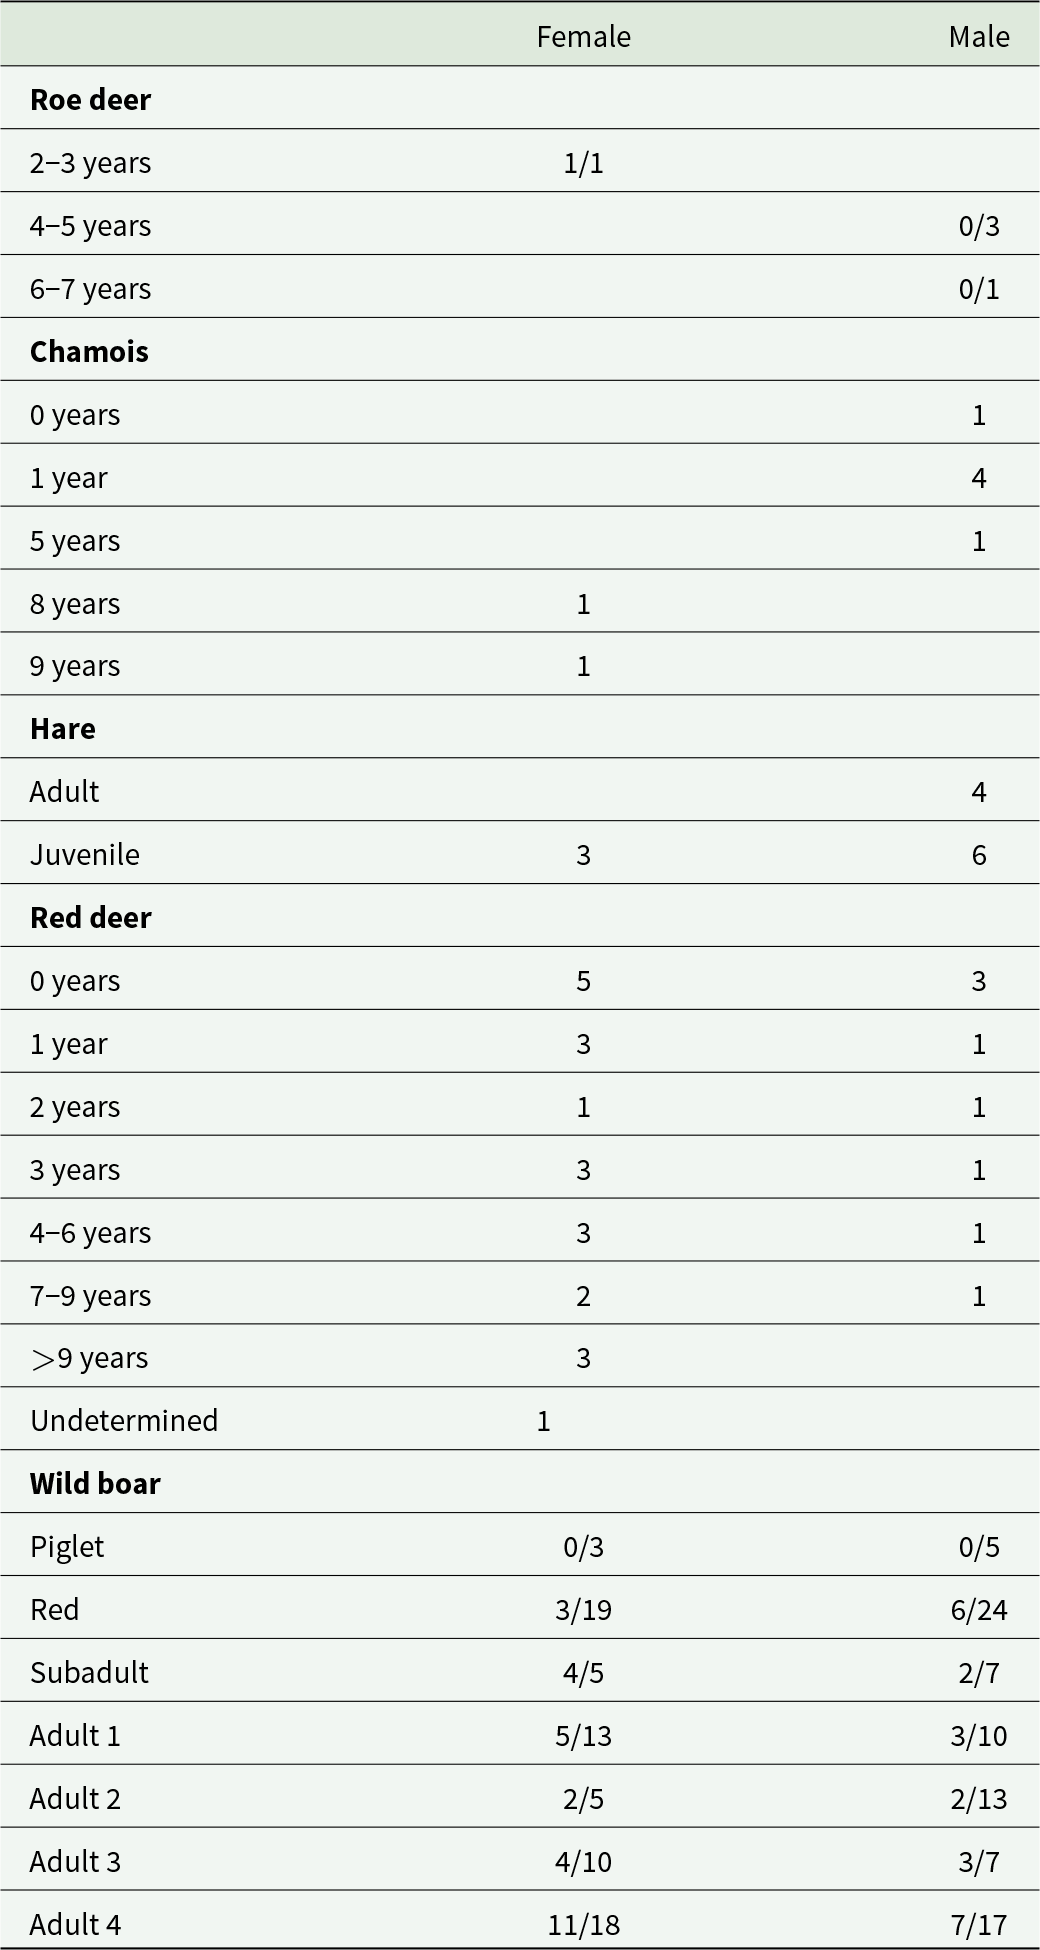
Age and sex distribution of sampled animals

Table 1 Long description
Species sampled in the study included roe deer, chamois, hare, red deer and wild boar. All age classes and sexes are represented, even though the sample size is limited in some cases. Chamois, hare and red deer did not return any positive individual, therefore the number of positives per age class and sex is indicated for roe deer and wild boar only
For the 2 species where positive samples were detected, the number of positive is the numerator, while the total number of animals tested is the denominator. Wild boar age classes: piglet (0–4 months), red (5–12 months), subadult (13–18), adult 1 (19–24), adult 2 (25–30), adult 3 (31–36) and adult 4 (>37). Age classes are attributed following official guidelines from Piedmont Regional Administration (https://www.Regione.Piemonte.It).
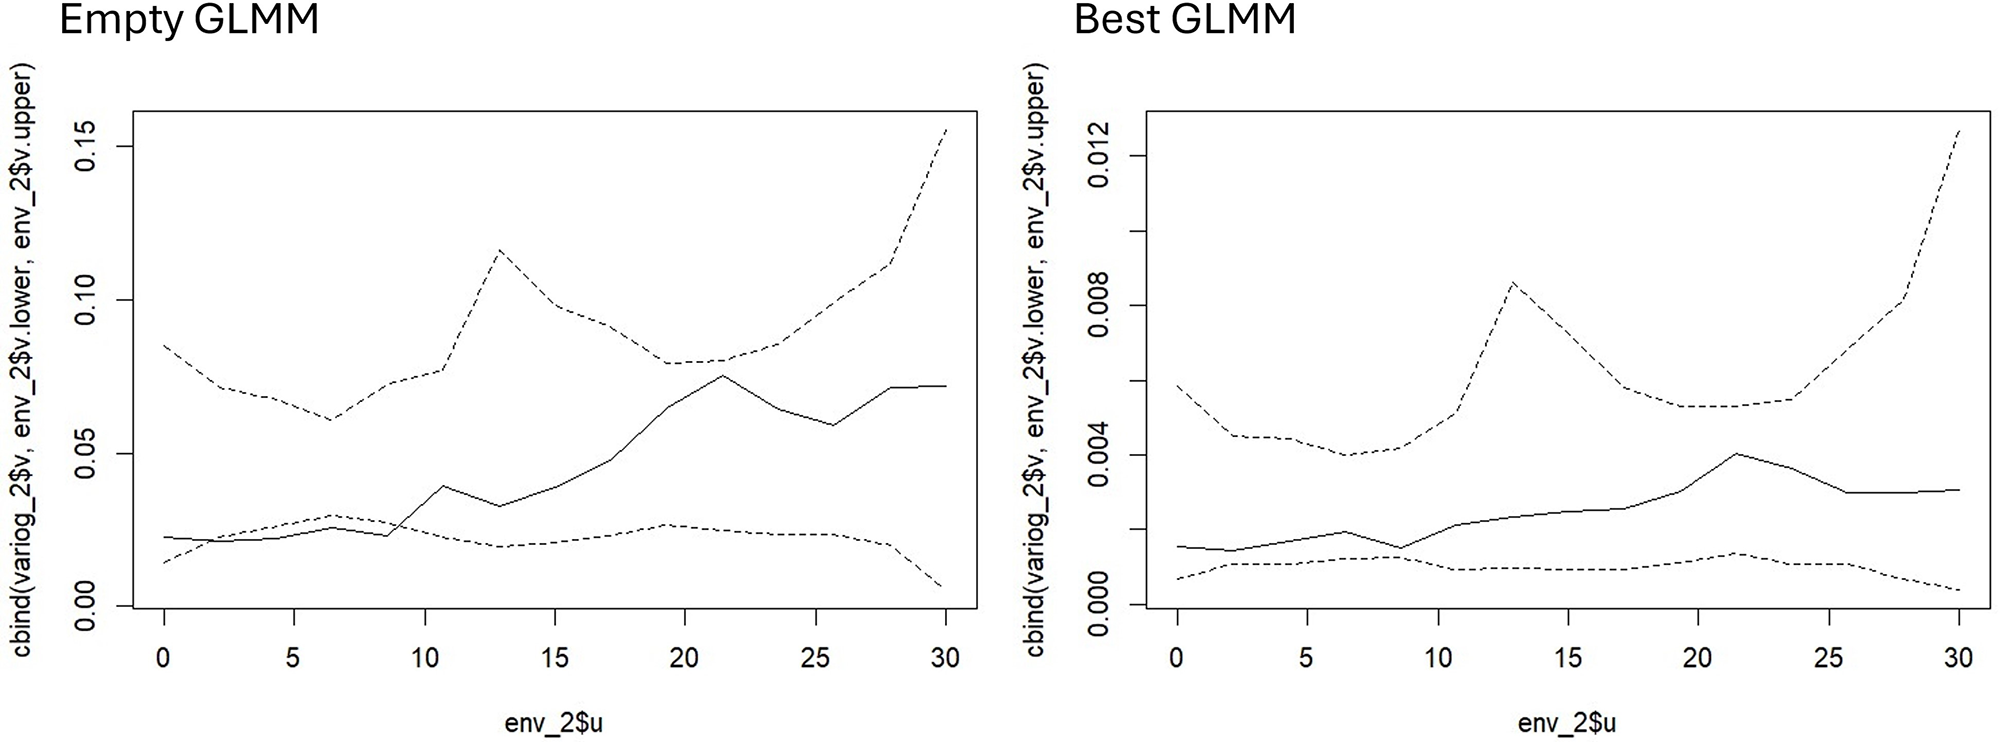
We tested models for residual spatial correlation through the empirical variogram, a tool for exploratory spatial analysis (Diggle and Giorgi, Reference Diggle and Giorgi2019). We tested both the null and the best performing model. We tested the association between predicted and actual values (Fisher’s test) and calculated the Area Under the ROC Curve (AUC) to check the ability of the model to distinguish between the positive and negative cases.
Results
We sampled a total of 225 animals, including 16 chamois, 5 roe deer, 31 red deer, 15 hare and 158 wild boar (Table 1). The total observed seroprevalence was of 24.4% (confidence intervals, 95% C.I. 19.3–30.5%). Antibodies against T. gondii were not detected in chamois, red deer or hares. Observed seroprevalence in roe deer was of 20% (1/5, 95% C.I. 3.6–62.4%), while in wild boar it reached 34.2% (54/158, 95% C.I. 27.2–41.9%). There was a statistically significant difference in seroprevalence between young and adult wild boars (Fisher’s exact test, OR = 0.14, P = 0.004) but not between sexes.
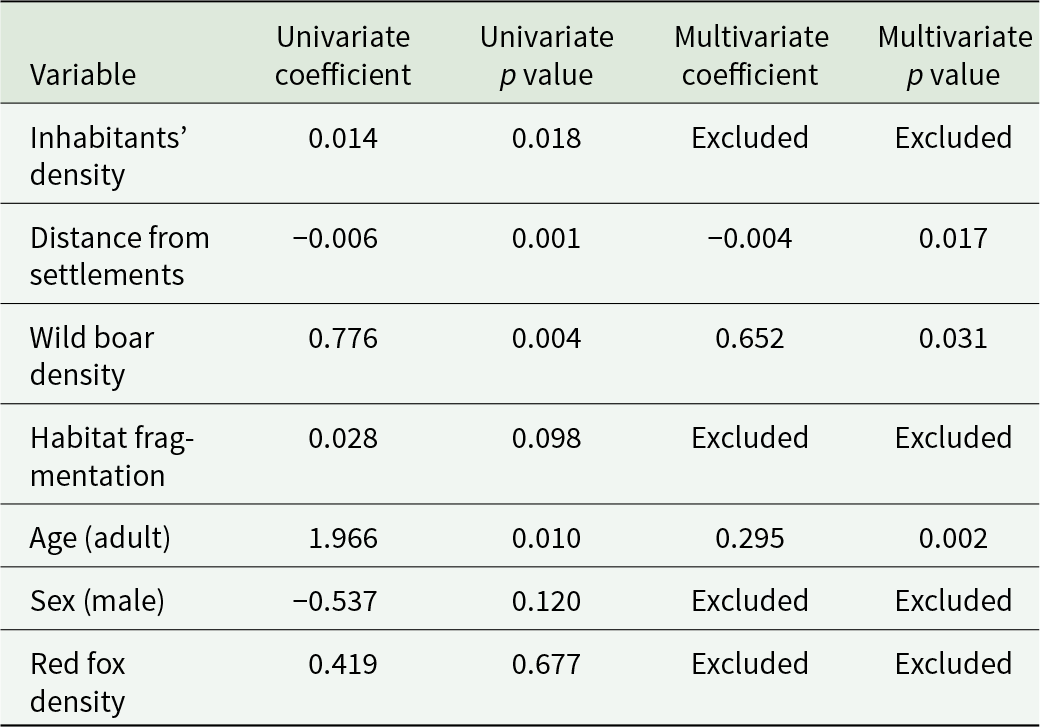
Because few individuals tested positive in species other than wild boar, regression analysis was performed only for wild boars. While most variables presented a significant coefficient in the univariate analysis (Table 2), the best GLMM incorporated wild boar density, age and distance to human settlements. A significant difference in seroprevalence was observed between the 2 hunting districts (CACN1: 51.06%, 48/94; CACN3: 9.38%, 6/64; Fisher’s exact test, p < 0.01). However, district origin was also associated with significant differences in wild boar density (p < 0.01), distance to human settlements (p < 0.01), and, to a lesser extent, age (p = 0.06). Therefore, the apparent effect of district was likely confounded by these underlying variables. Because district of origin was strongly correlated with several biologically relevant predictors, it was not retained in the multivariable analysis. All variables included in the analyses, presented a positive coefficient except the distance from human settlements (Table 2).
Coefficients and p-values of the variables in the univariate and multivariate analysis

Table 2 Long description
Out of 7 variables implemented in the analysis, 4 returned a significant coefficient to the univariate analysis. The multivariate analysis only retained 3 of those. The distance from human settlements and the animal being a male are the only 2 variables presenting a negative coefficient.
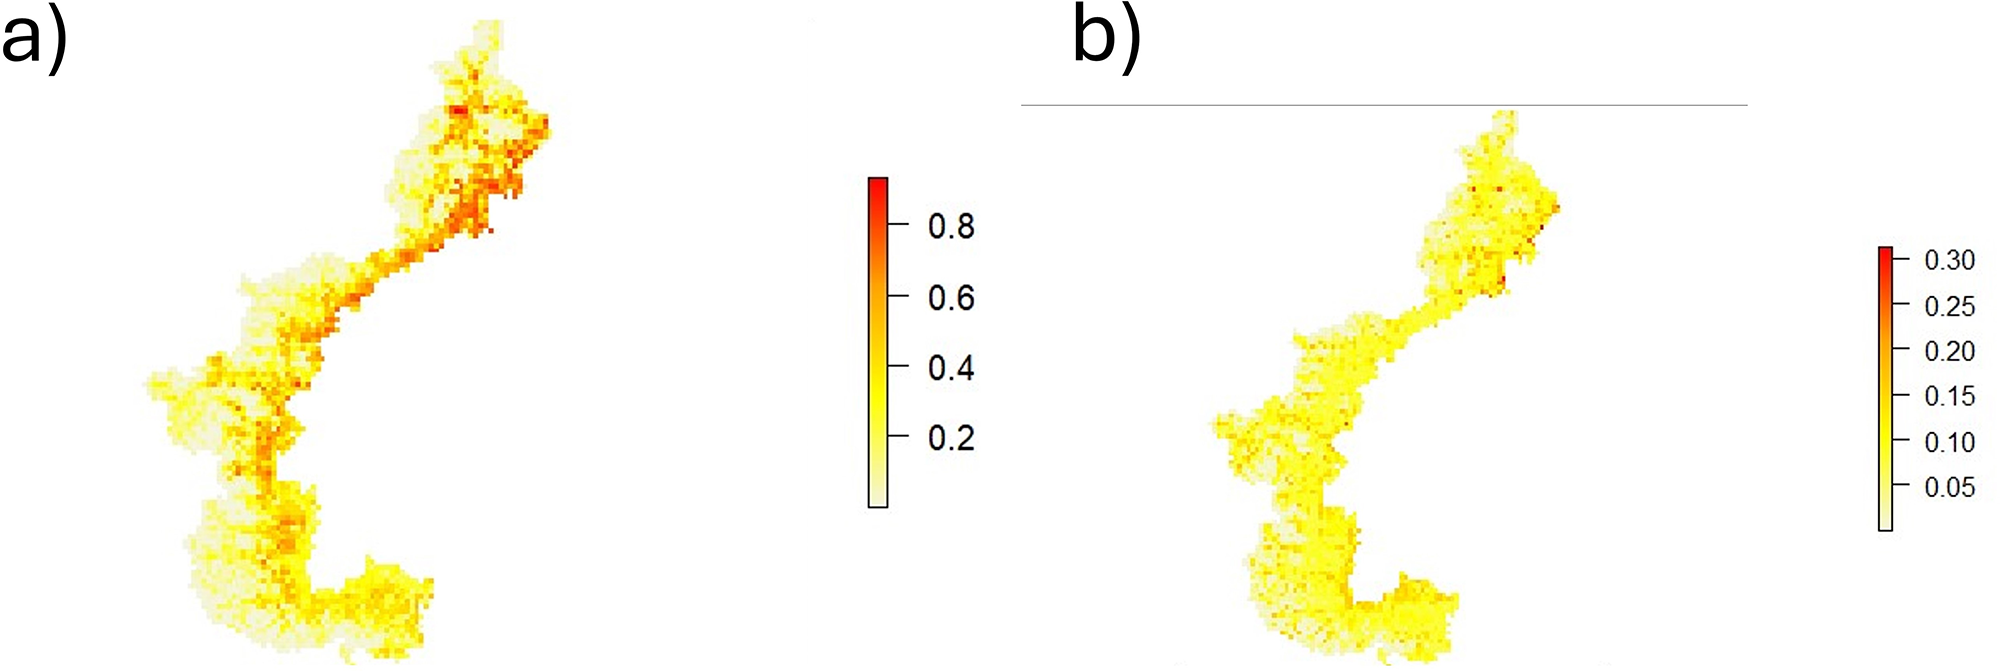
We identified correlation between actual outcomes and the predicted classification of the model (Fisher’s test p < 0.05) and an AUC of 0.75. The variables of the final model allow to explain the spatial correlation among culling locations (Figure 2). Considering model coefficients, we created a prediction map for the alpine range in Piedmont Region, which remarks that the closer to urbanized areas or more densely populated from wild boar, the higher the risk of a wild boar being positive to T. gondii (Figure 3).
Discussion
One fourth of the animals showed antibodies against T. gondii, primarily concentrated within the wild boar population. Older animals and increased boar densities were found to significantly increase the likelihood of seropositivity. Conversely, as the distance from human settlements increased, the probability of encountering a positive animal decreased.
Empirical variograms of model residuals were computed for the empty GLMM (left) and for the final selected GLMM (right). The solid line represents the empirical variogram of the observed residuals, while the dotted lines indicate simulation-based envelopes obtained under the fitted model assuming no residual spatial dependence. Evidence of residual spatial correlation is present when the empirical variogram falls outside the envelope. Spatial correlation is detected for the empty model but not for the final model, indicating that the included covariates adequately account for the spatial structure in the data.

Predicted distribution of risk for a wild boar carcass of being positive to T. gondii (a), remarking how this probability is higher closer to human settings and in areas more densely populated with wild boar. Standard error is presented (b) to better interpret the estimations. X and Y axes present the coordinates of the area.

Seroprevalences obtained in our study were consistent with other works performed in the Italian Alps. In general, prevalence in wild boar is usually higher than in other game species, even beyond the alpine region (Ferroglio et al. Reference Ferroglio, Bosio, Trisciuoglio and Zanet2014; Ebani et al. Reference Ebani, Poli, Rocchigiani, Bertelloni, Nardoni, Papini and Mancianti2016; Formenti et al. Reference Formenti, Gaffuri, Trogu, Viganò, Ferrari and Lanfranchi2016; Bier et al. Reference Bier, Stollberg, Mayer‐scholl, Johne, Nöckler and Richter2020; Bandelj et al. Reference Bandelj, Vengušt, Blagus, Vergles Rataj and Krt2021; Crotta et al. Reference Crotta, Pellicioli, Gaffuri, Trogu, Formenti, Tranquillo, Luzzago, Ferrari and Lanfranchi2022; Dini et al. Reference Dini, Morselli, Marangoni, Taddei, Maioli, Roncarati, Balboni, Dondi, Lunetta and Galuppi2023, Reference Dini, Musto, De Nigris, Bellinello, Sampieri, Merialdi, Barca, Delogu and Galuppi2024). This is likely related to feeding habits, thus confirming a trend that was observed in other European areas (Robert-Gangneux et al. Reference Robert-Gangneux, Aubert and Villena2022). Overall, in our study, we recorded a null or low seroprevalence in wild ruminants and European brown hare, with the only exception of roe deer, of which one single individual out of the 5 sampled, was positive. In Italy, prevalence in alpine chamois has been recorded as low (Formenti et al. Reference Formenti, Gaffuri, Trogu, Viganò, Ferrari and Lanfranchi2016) or even null (Ferroglio et al. Reference Ferroglio, Bosio, Trisciuoglio and Zanet2014), and similar results have been recorded in Northern Spain, in an area with limited presence of definitive hosts, comparable to our study (Escudero et al. Reference Escudero, Ribas, Almería, Gholipour, Pailler-garcía, Sastre, Ruiz-olmo, Palazón, Sayol and Espunyes2025). Regional comparisons show that seroprevalence in red and roe deer from the same area aligns with our results (Ferroglio et al. Reference Ferroglio, Bosio, Trisciuoglio and Zanet2014); however, while southern Europe tends to report lower seroprevalence overall (Fanelli et al. Reference Fanelli, Battisti, Zanet, Trisciuoglio and Ferroglio2021), substantially higher exposure levels have been recorded in both species across other European regions (Formenti et al. Reference Formenti, Trogu, Pedrotti, Gaffuri, Lanfranchi and Ferrari2015; Stensgaard et al. Reference Stensgaard, Sengupta, Chriel, Nielsen and Petersen2022; Witkowski et al. Reference Witkowski, Czopowicz, Nagy, Potarniche, Aoanei, Imomov, Mickiewicz, Welz, Szaluś-Jordanow and Kaba2015). In central Italy, seroprevalence in brown hare was of 0.9%, (Ebani et al. Reference Ebani, Poli, Rocchigiani, Bertelloni, Nardoni, Papini and Mancianti2016), but no specific information is available for the alpine region. However, a 2.08% prevalence has been detected in Eastern Cottontail Rabbits (Sylvilagus floridanus) in Northwestern Italy (Zanet et al. Reference Zanet, Palese, Trisciuoglio, Alonso and Ferroglio2013). On the other side of the alps, where wild felids such as European wild cat (Felix silvestris) or Eurasian lynx (Lynx lynx) are present (Gotteland et al. Reference Gotteland, Aubert, Gibert, Moinet, Klein, Game, Villena and Gilot-Fromont2014), seroprevalence have been registered above 40% in roe deer. Seroprevalence in wild boar obtained with our study is higher than the one recorded in other areas in Italy (Dini et al. Reference Dini, Morselli, Marangoni, Taddei, Maioli, Roncarati, Balboni, Dondi, Lunetta and Galuppi2023, Reference Dini, Musto, De Nigris, Bellinello, Sampieri, Merialdi, Barca, Delogu and Galuppi2024).
Positive associations between T. gondii seropositivity in wild boar and the density of human inhabitants have also been reported in previous studies (Beral et al. Reference Beral, Rossi, Aubert, Gasqui, Terrier, Klein, Villena, Abrial, Gilot-Fromont and Richomme2012; Barroso et al. Reference Barroso, García-Bocanegra, Acevedo, Palencia, Carro, Jiménez-ruiz, Almería, Dubey, Cano-terriza and Vicente2020; Almería et al. Reference Almería, Cano‐terriza, Prieto, Dubey, Jiménez‐martín, Castro‐scholten, Paniagua and García‐bocanegra2021; Lizana et al. Reference Lizana, Gortázar, Muniesa, Cabezón, Martí-marco, López-ramon and Cardells2021). These relationships likely reflect increased habitat overlap with domestic cats (the definitive hosts of the parasite) in areas of higher human density, as well as enhanced scavenging opportunities in areas with higher wildlife densities. Conversely, the probability of detecting a T. gondii–positive carcass decreased with increasing distance from human settlements. Although wild boar home ranges can vary substantially, from relatively small areas in females during summer (∼1 km2) to extensive ranges in males during winter (>10 km2) (Cavazza et al. Reference Cavazza, Brogi and Apollonio2024), the culling location still appears to provide a reliable spatial indicator for modelling T. gondii seroprevalence in this species. Seroprevalence in wild boars over 12 months of age was also higher than in younger specimens, thus showing how the risk of finding a positive animal increases with the age of the same, and consistent with broad-spectrum studies (Opsteegh et al. Reference Opsteegh, Swart, Fonville, Dekkers and van der Giessen2011; Rostami et al. Reference Rostami, Riahi, Fakhri, Saber, Hanifehpour, Valizadeh, Gholizadeh, Pouya and Gamble2017).
Our variogram analysis showed that the spatial correlation present in the data was successfully captured by the variables included in the model, and the model’s predictions closely aligned with the observed serological outcomes. Together with the strong predictive performance, these findings illustrate that the variables used in this study, which were partly selected also for being simple, practical, and widely accessible, offer a solid and effective basis for predicting the risk of T. gondii seropositivity in game meat. At the same time, the results clearly emphasize the critical importance of high-quality, fine-scale density data. Generating and maintaining such information requires continuous, detailed monitoring, harmonization across data sources, and supportive regulatory or cooperative frameworks. Our findings highlight that these efforts are worthwhile, as robust density data substantially enhance our ability to model and anticipate T. gondii exposure risks.
Conclusions
The positive correlation between wild boar density and T. gondii seroprevalence highlights the importance of accurate, high-resolution wildlife density data for zoonotic risk assessment. Moreover, the association between culling site and seropositivity could inform risk communication strategies for hunters and game meat handlers, though this spatial signal should be interpreted in the context of animal movement ecology and the distribution of the definitive host.
Data availability statement
Raw data are available from authors upon reasonable request.
Acknowledgements
We thank the alpine hunting districts CACN1 and CACN3, their official representatives and all affiliated hunters, for their invaluable support in collecting the samples analysed in the study.
Author contributions
Conceptualization: E.F. and S.Z. Data curation: R.V., M.G.C. and A.P. Formal analysis: R.V. Funding acquisition: E.F. Investigation: R.V., M.G.C. and A.P. Methodology: R.V., E.F. and S.Z.. Supervision: E.F. and S.Z. Visualization: R.V. Writing – original draft: RV. Writing – review and editing: R.V., S.Z., M.G.C., A.P. and E.F.
Financial support
This research was supported by the Enetwild Consortium funded by EFSA * OC/EFSA/BIOHAW/2022/01.
Competing interests
The authors declare none.
Ethical standards
All samples were collected from animals culled within authorized game management plans, in collaboration with hunters and game control centers, with whom the Department of Veterinary Sciences of the University of Turin maintains a long-standing collaboration for wildlife sample collection.


 Open access

