INTRODUCTION
Vector-borne diseases represent a large fraction of emerging and re-emerging infectious diseases (Jones et al. Reference Jones, Patel, Levy, Storeygard, Balk, Gittleman and Daszak2008), yet the role of the composition of vector communities (assemblages of distinct species) in influencing parasite transmission has received relatively little attention. Many infectious diseases are transmitted by a suite of vectors that are often closely related (e.g. congeners), and realized vector communities can vary in their species composition across a landscape. While species-level competencies, including transmissibility and longevity, can directly influence parasite transmission (Sardelis et al. Reference Sardelis, Turell, Dohm and O'Guinn2001), there are additionally emergent properties of vector communities, particularly community abundance and activity period, that may promote transmission. If species have distinct phenologies, then there is the potential for a longer window of transmission. If instead, species have similar phenologies then communities have the potential to reach greater abundances, provided interspecific competition is not too strong. Studying the effects of community composition of vectors on wildlife diseases relies on the rare combination of spatially and temporally resolved data on the vector and disease.
Haemorrhagic disease (HD) is a viral disease vectored by biting midges in the genus Culicoides (Gibbs and Greiner, Reference Gibbs and Greiner1989). It predominantly affects white-tailed deer (Odocoileus virginianus) (Nettles and Stallknecht, Reference Nettles and Stallknecht1992) and can lead to asymptomatic infection, morbidity (sickness) or mortality, with morbidity being by far the most common outcome in the Southeastern USA (Park et al. Reference Park, Magori, White and Stallknecht2013), our study region. Disease occurrence in white-tailed deer in the USA is reported annually at the county level. Additionally, Culicoides vector surveillance has been conducted in the Southeastern USA during the late 2007–2012 (Vigil et al. Reference Vigil, Grogan, Wlodowski, Parris, Edwards de Vargas, Shaw, Cleveland and Corn2014), involving over 5500 trap nights (number of traps x number of nights) that have recorded approximately 50 species in the genus. We characterize the vector communities by their overall activity period and abundance, and these metrics are related to measures of reported disease in host populations in the same locations. We find that no single species is driving patterns of disease. Additionally, while species richness (SR) is broadly positively associated with abundance, the estimated number of Culicoides individuals in a region is not predictive of levels of disease reporting. Rather, we find that communities composed of species with different phenologies (thereby generating a longer seasonal window of transmission) are associated with higher rates of disease reporting. These findings point to an important role for functional diversity of vectors in helping parasite populations invade and persist in host populations.
To lend explanatory and predictive power to the role of vector diversity in parasite transmission, we introduce a simple vector–host model where the vector population (which could be composed of one or several species) exhibits susceptible-infected (SI) dynamics and the host exhibits SIS dynamics (i.e. hosts recover back to the susceptible state); and where vectors spend a continuous fraction of the year (φ) in an active phase, including biting (i.e. transmission) and the remaining fraction (1−φ) inactive (i.e. overwintering). The model allows for the fraction φ to vary, representing vector communities composed either of species with overlapping or distinct activity periods. This framework does not assume any differences in vector species regarding their ability to transmit the parasite. The model provides predictions for how levels of infection should increase in host populations as a function of vector community phenology and abundance.
STUDY SYSTEM
The vector-borne, HD is caused by serotypes of epizootic HD virus and bluetongue virus, closely related double-stranded RNA orbiviruses (Roy, Reference Roy and Fields1996). In the USA, the disease is mainly associated with white-tailed deer (O. virginianus) (Nettles and Stallknecht, Reference Nettles and Stallknecht1992). Transmission dynamics in the southeast USA are primarily associated with morbidity in hosts (Park et al. Reference Park, Magori, White and Stallknecht2013).
Virus is transmitted between animals by biting midges in the genus Culicoides (Mellor et al. Reference Mellor, Boorman and Baylis2000). Of the approximately 150 species thought to occur in USA (Borkent and Grogan, Reference Borkent and Grogan2009) about 50 species occur in the southeast. The relative role of each species in transmitting virus is unknown, though certain species have been shown to become experimentally infected (Smith et al. Reference Smith, Stallknecht and Nettles1996). The Southeastern Cooperative Wildlife Disease Study (SCWDS) at the University of Georgia has been conducting surveys of Culicoides in the Southeastern USA since the late 2007 (Vigil et al. Reference Vigil, Grogan, Wlodowski, Parris, Edwards de Vargas, Shaw, Cleveland and Corn2014). We use these data (covering full years 2008–2012) to determine vector species presence and absence in each light trap together with overall Culicoides abundance. The light trap data are aggregated by site to estimate vector community composition and mean abundance. Following infection, host animals are infectious and then recover, after which they may become re-infected, especially by different virus strains (Stallknecht et al. Reference Stallknecht, Kellogg, Blue and Pearson1991; Gaydos et al. Reference Gaydos, Davidson, Elvinger, Howerth, Murphy and Stallknecht2002). Infected animals maintain relatively high viraemia for several weeks, meaning that activity periods of vectors need not be continuous to support transmission throughout a season, and year-round transmission may be possible in some locations.
We also make use a disease data set collated at the University of Georgia which records occurrence of white-tailed deer morbidity and mortality associated with HD at the county level from 1980-present (detailed in Park et al. Reference Park, Magori, White and Stallknecht2013). Here, we restrict our analysis to 2008–2012, in line with data on the Culicoides species identified from light trap surveys. The disease data are smoothed spatially using two-dimensional kernel density estimation (kde2d function in R package MASS), generating a non-parametric estimate of the density of disease reports across the landscape. Values from this distribution are then extracted at the geographic coordinates of the Culicoides sampling sites as a proxy measure of prevalence. Independent deer density data collected by the state departments of natural resources (DNR; Supplemental material) are used to establish that deer density is not responsible for patterns of HD, consistent with theory on vector-borne diseases proposing that, in many systems, biting rates saturate at sufficiently high host densities (Keeling and Rohani, Reference Keeling and Rohani2008).
Lastly, we use the Culicoides data to derive an estimate of the length of seasonal Culicoides activity period at each site. This is achieved by first calculating the weekly probability of detection of each Culicoides species (using all regional data). These profiles are approximately normally distributed. All weeks within 80% of the peak probability of detection are counted towards that species activity period (this is approximately 2/3 of the standard deviation). This method accounts for the fact that species themselves have different activity period durations, in addition to timing differences. The community activity period, φ, is then estimated as the proportion of weeks in the year when the community has at least one species active (Fig. A1, Supplemental material).
MODEL
To illustrate the expected relationship between vector abundance, length of seasonal transmission and host prevalence, we introduce a simple vector-host transmission model (Keeling and Rohani, Reference Keeling and Rohani2008). The vector population exhibits SI dynamics and the host population exhibits SIS dynamics (i.e. hosts recover back to the susceptible state). In addition, vectors spend a continuous fraction of the year (φ) in an active phase, including biting (i.e. transmission) and the remaining fraction (1−φ) inactive (i.e. overwintering):
 $$\displaystyle{{dS_v^ \cdot} \over {dt}} = {\lambda _v} - {\mu _v}S_v^ \cdot - \displaystyle{{b{\tau _{hv}}S_v^ \cdot {I_h}} \over {{S_h} + {I_h}}} - {\,f_ \downarrow} S_v^ \cdot + {\,f_ \uparrow} S_v^ {\circ} $$
 $$\displaystyle{{dI_v^ \cdot} \over {dt}} = \displaystyle{{b{\tau _{hv}}S_v^ \cdot {I_h}} \over {{S_h} + {I_h}}} - {\mu _v}I_v^ \cdot - {\,f_ \downarrow} I_v^ \cdot + {\,f_ \uparrow} I_v^ {\circ} $$
 $$\displaystyle{{dS_v^ {\circ}} \over {dt}} = {\,f_ \downarrow} S_v^ \cdot - {\,f_ \uparrow} S_v^ {\circ} - {\mu _v}S_v^{\circ} $$
 $$\displaystyle{{dI_v^{\circ}} \over {dt}} = {\,f_ \downarrow} I_v^\cdot - {\,f_ \uparrow} I_v^{\circ} - {\mu _v}I_v^{\circ} $$
 $$\displaystyle{{d{S_h}} \over {dt}} = {\lambda _h} - {\mu _h}{S_h} - \displaystyle{{b{\tau _{vh}}{S_h}I_v^ \cdot} \over {{S_h} + {I_h}}} + \gamma {I_h}$$
 $$\displaystyle{{d{I_h}} \over {dt}} = \displaystyle{{b{\tau _{vh}}{S_h}I_v^ \cdot} \over {{S_h} + {I_h}}} - {\mu _h}{I_h} - \gamma {I_h}$$
where closed (open) circles indicate active (inactive) vectors, and f ↑(f ↓) denotes the emergence (overwintering) rate. Dynamics of active and inactive vector states are determined by the f parameters:
 $$\eqalign{& {\,f_ \uparrow} = \left\{ {\matrix{ {{\,f_{\max}}} & {{\rm if}\;t\;\bmod \;1 \le \phi} \cr 0 & {{\rm if}\;t\;\bmod \;1 \gt \phi} \cr}} \right.\quad {\rm and} \cr & \quad {\,f_ \downarrow} = \left\{ {\matrix{ 0 & {{\rm if}\;t\;\bmod \;1 \le \phi} \cr {{\,f_{\max}}} & {{\rm if}\;t\;\bmod \;1 \gt \phi} \cr}} \right.}$$
with t measured in years (vector dynamics are illustrated in Fig. A2, Supplemental material). Parameter b is the biting rate, and τ vh and τ hv are transmission probabilities from host to vector and from vector to host, respectively. Demographics in the vector and host populations are captured via constant birth rates, λ v and λ h , and per capita mortality rates, μ v and μ h . Finally, parameter γ is the recovery rate of infected hosts back to the susceptible state.
For a vector population active year-round (i.e. φ = 1), then the basic reproductive number (Anderson and May, Reference Anderson and May1992) for the system is easily calculated from the next generation matrix (Diekmann et al. Reference Diekmann, Heesterbeek and Britton2013) (see Supplemental material):
 $${R_0} = \sqrt {\displaystyle{{{b^2}{\tau _{vh}}{\tau _{hv}}{{\widehat S}_v}} \over {({\mu _h} + \gamma ){\mu _v}{{\widehat S}_h}}}} $$
where
 ${\widehat S_x}$
represent the disease-free equilibrium population sizes for vector (x = v) and host (x = h) with values determined by
 ${\widehat S_x}$
= λ
x
/μ
x
. For a vector population that spends a fraction of the year (1−φ) inactive, the concept of a disease-free equilibrium is not defined. However, as a broad guide, we note that when vectors are active then R
0 is as defined, and is equal to zero during inactive phases. Consequently, we see that per generation parasite fitness approaches its maximum value of R
0 as φ tends to 1. From this, we conclude that there are multiple facets of parasite fitness that can increase with vector SR; aside from adding competent vectors to a community (increasing biting rates, transmissibilities and longevity), R
0 can also be increased by increasing vector abundance (
 ${\hat S_v}$
) and by adding species with distinct phenologies (increasing φ). These latter two factors may not necessarily increase independently. In the case of overlapping active phases, competition between vector species may limit their overall abundance.
RESULTS
A series of statistical models were constructed and analysed to determine which aspects of Culicoides were predictive of HD reporting, i.e. the disease density estimates obtained by kernel smoothing (HDdens). Culicoides SR is a positive predictor of HD density estimates (HDdens, which is log-transformed to meet assumptions of normality) (linear model: ln(HDdens)~SR, slope = 0·16, P < 2 × 10⁻¹⁶, R 2 = 0·3). However, SR needs to be interpreted biologically. In proposing a vector community-level explanation for disease patterns in data (i.e. length of the community-generated seasonal transmission window), it is important to consider and rule out other ways in which SR may lead to increased disease reporting. We consider three key alternative hypotheses: (i) sampling effect (Leps et al. Reference Leps, De Bello, Lavorel and Berman2006), where species-rich communities are more likely to contain functionally important species by chance, in this case species with high vectorial capacity; (ii) community abundance, where SR is simply leading to increased overall abundance; (iii) latitudinal effects, where species at lower latitudes exhibit relatively short overwintering periods.
Across all the sites where Culicoides were sampled (n = 207) there is considerable variation in disease reporting (measured by the kernel density estimate at each site). No single vector species strongly influences the level of disease reporting across sites. This was established by comparing the fit of linear models (ln(HDdens)~SR) in which each species was left out in turn. The difference in model R 2 does not point to an obvious keystone species (difference in R 2 between adjacent models ordered by R 2: min = 0·0, mean = 0·0027, max = 0·027). Additionally, average abundance of Culicoides at sites did not explain the disease kernel density estimate (linear model: ln(HDdens)~mean(abundance), P = 0·55, R 2 = 0·0018), although Culicoides abundance is related to SR in a saturating, non-linear fashion (Fig. A3, Supplemental material; Spearman rank correlation: ρ = 0·56, P < 2·2 × 10−16).
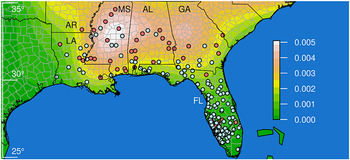
Simple mapping reveals that disease density is heterogeneous in space with localized high density in Mississippi, continuing into Alabama and Georgia (Fig. 1). Culicoides sampling sites are overlaid on this map and coloured according to the estimated length of the seasonal transmission window, φ (red = longest 25% of transmission windows, which corresponds to φ > 0·5). We acknowledge that space itself is naturally a strong predictor of such a disease density pattern (e.g. tensor product smoothed generalized additive model: ln(HDdens)~(latitude, longitude), family = Gaussian, P < 2 × 10⁻¹⁶, R 2 = 0·98). However, evidence suggests that the interpretation of the importance of space is in terms of the community-generated length of transmission window (φ) and not latitude.
Kernel density estimate of HD based on occurrence data in the Southeast USA (colourbar: highest density of records in white, lowest in green). Culicoides sampling sites are overlaid in their respective positions in the states of Arkansas (AR), Louisiana (LA), Mississippi (MS), Alabama (AL), Georgia (GA) and Florida (FL). Sampling sites are coloured according to their ranked position of estimated length of annual Culicoides community activity period, φ (red = highest 25%, cyan = remaining 75%). Longitude is indicated on the left-hand vertical axis.

Latitudinal stratification confirms that several species (n = 11) have a different temporal activity pattern in the north relative to the south (with 30° latitude demarcating north from south; Fig. A4, Kolmogorov–Smirnov tests on species-level detection week in north and south groups). The difference is generally characterized by both later emergence and earlier overwintering in the north. For the other species there was either no significant difference in the temporal activity (n = 13) or the species occurred exclusively in one of the two regions (n = 28). While latitude is predictive of disease density (linear model: ln(HDdens)~latitude, slope = 0·42, P < 2·2 × 10−16, R 2 = 0·95), it is in the opposite direction than would be expected based on species-level extended activity (since disease density is shown to be higher at high latitudes where species-level activity is relatively short, Fig. 1).
However, the community-level activity period (φ) is positively predictive of disease density (Fig. 1; linear model: ln(HDdens)~φ, slope = 3·7, P = 2·5 × 10−15, R 2 = 0·27). Each Culicoides species’ presence and absence at sites results in spatially distinct Culicoides communities. Some of these communities have a relatively short window of transmission (small φ), typically due to a high degree of overlap in phenology of member species. Conversely other communities have long windows of transmission (large φ) for the complementary reasons. The range of φ (min = 0·19, mean = 0·42, max = 0·69) means some vector communities are active for ~2 months while others are active for >8 months. The community-level window of transmission accounts for nearly 30% of variation in the disease reporting metric. In addition, it overcomes any species level reductions in activity period in relatively northern latitudes, which contain the disease hotspots. By calculating φ based on time periods when each species is within 80% of its peak probability of detection (Fig. A1, Supplemental material), we aim to conservatively estimate region-wide activity, rather than capture early emergence and late overwintering in southern latitudes (as could occur with a threshold <<80%).
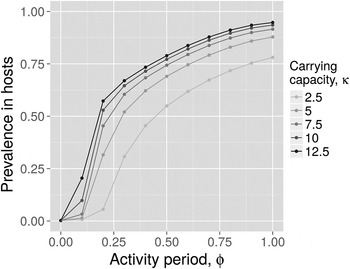
The vector–host transmission model predicts that equilibrium prevalence in the host population will increase with the length of the active vector season, φ (Fig. 2). In addition, high abundance of the vector population is also predicted to positively influence host equilibrium prevalence. As prevalence is bounded, it tends to saturate as both factors increase, and in much of the φ-parameter space, increases in community abundance exhibit strong diminishing returns on infection prevalence in host populations.
Equilibrium prevalence in host populations (y-axis, proportion of hosts infected) as a function of the fraction of the year that vectors are active (x-axis, φ) and vector abundance (vector-carrying capacity, κ, grey-scale coded). Model parameters are λ v = kμ v , μv = 2·0, f max = 100·0, λ h = 1·0, μ h = 0·2, b = 10·0, τ vh = τ hv = 1·0, γ = 1·0, φ = 0·0–1·0, κ = 2·5–12·5.

DISCUSSION
We have introduced a study system in which many species of vectors from the same genus can transmit virus to hosts, and where the competency of the vector species is largely unknown. Communities comprising species with distinct activity periods (over richness per se and over abundance) are spatially coincident with relatively high levels of disease reporting. This is a community-level effect since empirical and modelling results do not require any differences in the vector species in terms of their competency; just that they have distinct activity periods thereby generating longer transmission windows. Similar mechanisms have been put forward to explain the epidemiology of West Nile virus using a two vector species approach (Lord, Reference Lord2010). However, the role of vectors is largely absent from discussions on the disease-diversity relationship, in spite of the large impacts that vector diversity can have on parasite transmission.
While our approach is neutral with respect to assumptions about the ability of a given vector species to transmit virus, more broadly, community-driven seasonality in transmission may interact with species-level variation in vector competence creating temporal hotspots for parasite transmission. Such mechanisms have the potential to operate broadly in human and animal infectious disease systems since ecological sensitivity of vectors means that community composition is likely to turn over along environmental gradients influencing parasite transmission (Toé et al. Reference Toé, Tang, Back, Katholi and Unnasch1997; Lambin et al. Reference Lambin, Tran, Vanwambeke, Linard and Soti2010). Community abundance and the duration of seasonal transmission, in addition to vectorial capacity (Dye, Reference Dye1986), can lead to both positive and negative effects of vector SR on parasite fitness.
Awareness of the importance of functional diversity above SR is increasing (Díaz and Cabido, Reference Díaz and Cabido2001; Petchey and Gaston, Reference Petchey and Gaston2002). By far the most active areas of research concern plant communities, ecosystem services and potential responses to climate change (Tilman, Reference Tilman1997; Sala et al. Reference Sala, Chapin, Armesto, Berlow, Bloomfield, Dirzo, Huber-Sanwald, Huenneke, Jackson, Kinzig, Leemans, Lodge, Mooney, Oesterheld, Poff, Sykes, Walker, Walker and Wall2000; Cadotte et al. Reference Cadotte, Carscadden and Mirotchnick2011; Craine et al. Reference Craine, Ocheltree, Nippert, Towne, Skibbe, Kembel and Fargione2012). However, we have demonstrated that parasite transmission may also be promoted or inhibited by functional diversity, especially through the temporal activity of vector species in a community.
As in many studies of functional diversity, it is important to consider the interplay between SR and abundance. Temporal niche partitioning may facilitate the presence of multiple species since it alleviates interspecific competition (Chesson, Reference Chesson2000). Consequently, communities with longer transmission windows than those attained by any one vector species may be common. However, an increase in seasonal transmission due to SR may trade off against vector abundance, a factor that can also increase parasite transmission; communities comprising species with similar activity periods may only attain higher abundance provided interspecific competition is not too strong, as we demonstrated with our mathematical model.
The quality of the data associated with this wildlife disease have shed light on vector-borne parasites, and suggest that similar inquiries could be made in parasites of human health concern, where data collection is typically more extensive. We contend that vector species diversity should form part of the disease-diversity discussion, and recognize novel ways in which vector SR may manifest functionally, in addition to classic components of competency.
SUPPLEMENTARY MATERIAL
To view supplementary material for this article, please visit https://doi.org/S0031182015000578.
ACKNOWLEDGEMENTS
We thank David Stallknecht, Sarah Bowden, Ford Ballantyne, Laura Alexander, John Drake, Drew Kramer and JP Schmidt for comments on a draft of the manuscript.
FINANCIAL SUPPORT
The Culicoides surveys were funded through a Cooperative Agreement with the United States Department of Agriculture, Animal and Plant Health Inspection Service, Veterinary Services. AWP acknowledges funding from the McDonnell Foundation (grant number 220020193).