INTRODUCTION
Grass–clover swards are becoming increasingly popular in temperate regions as the primary feed source for ruminant production in grazing systems. Temperate pastures are generally targeted for low-cost production with high pasture utilization through animal grazing. The benefits of white clover (WC) inclusion in grass mixtures have been well documented through various studies (Luscher et al. Reference Luscher, Mueller-Harvery, Soussana, Rees and Peyraud2014; Egan et al. Reference Egan, Lynch and Hennessy2015). Perennial ryegrass and WC have been identified as a highly compatible species mixture in grazing systems with significant amounts of WC included in grass sward mixtures as a result (Wilkins & Humphreys Reference Wilkins and Humphreys2003). Grass–clover swards have an important role to play in grassland production sustainability in temperate regions, as environmental restrictions coupled with high fertilizer costs make it increasingly difficult for farmers to produce protein-rich herbage (Parsons et al. Reference Parsons, Edwards, Newton, Chapman, Caradus, Rasmussen and Rowarth2011).
White clover herbage is superior to grass as a feed source for animal production (Ulyatt Reference Ulyatt, Baker, Gawthorne, Mackintosh and Purser1985), but because of its open stoloniferous growth habit and poorer competitive ability for nutrients, it occupies a secondary position in mixed pastures dominated by more competitive grasses (Brock & Hay Reference Brock, Hay and Woodfield1996). Issues around WC competitiveness in grass mixtures have been strongly linked to management, with one of the major factors being soil nitrogen (N). Increased N fertilizer has been shown to have a negative effect on the prominence and productivity of WC in the sward (Hennessy et al. Reference Hennessy, Enriquez-Hidalgo, O'Donovan, Gilliland, Goliński, Warda and Stypiński2012). White clover may have an increased production potential for farming systems looking to apply less artificial N to the soil but remain intensive in terms of herbage production. Limited information is available regarding the effect of repetitive application of N on WC growth in mixtures (Elgersma et al. Reference Elgersma, Schlepers and Nassiri2000; Williams et al. Reference Williams, Evans, Rhodes and Abberton2003). The effect of WC inclusion on grass sward dry matter (DM) yield performance at altered N is an important aspect for on-farm usage of WC and for farming systems.
Growth pattern of perennial ryegrass and WC must be complimentary from a feed supply perspective to ensure maximum productivity can be obtained (Elgersma et al. Reference Elgersma, Schlepers and Nassiri2000). A concern regarding grass–clover swards is spring pasture supply due to the late start of WC growth, unpredictability and possibly a reduction in sward performance (Gibb Reference Gibb, Elgersma, Dijkstra and Tamminga2007). White clover growth and contribution generally peaks in early summer and autumn (Frame & Newbould Reference Frame and Newbould1986), but spring herbage remains the most economically valuable feed source to spring-calving grassland-based farmers (McEvoy et al. Reference McEvoy, O'Donovan and Shalloo2011). Low WC growth during the spring can compromise total sward herbage production (Frame & Newbould Reference Frame and Newbould1986) but N fertilizer application early in the season can overcome this issue (Frame & Boyd Reference Frame and Boyd1987). Large variations from year to year may result in unpredictable seasonal DM yield performance of grass–clover swards, which may impact negatively on total DM yield performance.
White clover contribution to DM yield is a major component of grass–clover swards. White clover proportion is one of the main drivers in grass–clover sward performance and has been shown to be consistent with the contribution to DM yield of mixed swards (Camlin Reference Camlin1981). In the most recent review in Ireland regarding the level of sward WC proportion, it is reported that average sward WC proportion is 0·05 (Nolan & Grennan Reference Nolan and Grennan1998). Harris & Thomas (Reference Harris and Thomas1973) have suggested that a WC proportion of between 0·30 and 0·50 averaged over the year is the desired agronomic level. Clark & Harris (Reference Clark, Harris and Woodfield1996) stated that by maintaining WC at levels >0·20, there potentially should be a pasture performance benefit when compared with a grass-only sward receiving the same N application. Many factors have been stated to affect WC proportion with high quantity and frequency of applied N fertilizer being negatively associated with WC proportion (Enriquez-Hidalgo Reference Enriquez-Hidalgo2014). Altering N fertilizer rates on-farm may also result in different grazing rotation intervals, as pasture growth rate may be subject to available N during the growing season. Frequent grazing has been shown to improve sward WC proportion (Harris & Thomas Reference Harris and Thomas1973; Harris Reference Harris, Baker and Williams1987; Davies Reference Davies1992; Harris & Clark Reference Harris and Clark1996; McKenzie et al. Reference McKenzie, Jacobs, Riffkin, Kearney and McCaskill2003; Phelan et al. Reference Phelan, Casey and Humphreys2013), while Svenning et al. (Reference Svenning, Røsnes and Junttila1997) and Goulas et al. (Reference Goulas, Le Dily, Teissedre, Corbel, Robin and Ourry2001) found that by employing longer defoliation intervals later in the year would lead to increased WC and total herbage production. Such factors offer an interesting perspective of WC × N interaction effects on grassland sward performance and the effects that N application and grazing frequency will have on WC productivity.
Persistence of contribution to DM yield by WC at farm level is a fundamental part of justification for WC inclusion in temperate pastures and also to ensure that pasture renewal is justified. Maintenance of high densities of perennial ryegrass tillers and WC stolons is fundamental to persistence (Edwards & Chapman Reference Edwards, Chapman and Mercer2011) and species persistency is strongly linked to how growth units respond to the frequency, severity and timing of defoliation (Harris Reference Harris1973). Previous research has examined the performance and persistence of mixed swards under a mechanized cutting regime (Davies & Evans Reference Davies and Evans1990; Gilliland & Meehan Reference Gilliland and Meehan2014), where the WC proportion is generally higher than under animal grazing (Elgersma & Hassink Reference Elgersma and Hassink1997). Assessing mixed swards’ persistence under animal grazing takes account of important animal–sward interface effects, species selection, nutrient cycling, poaching and trampling, which make findings more relevant to on-farm conditions (Evans et al. Reference Evans, Williams, Jones and Evans1998; Kleen et al. Reference Kleen, Taube and Gierus2011). Contribution to DM yield is the ultimate measure of persistence for intensive grazing swards and survival of stable populations between years is an important consideration for sward performance under animal grazing both annually and by season.
Establishing the performance of grass–clover v. grass-only swards over multiple years under animal grazing offers an accurate measure of sward performance for on-farm use, even more so when grazing and N management is altered. Identifying key management × WC interactions for DM yield performance and management effects on WC sward contribution and persistence under animal grazing offers a unique insight into sward mixture productivity. The objective of the current study was to examine the effect of differing grazing rotational lengths and level of N application on the DM yield performance of grass–clover and grass-only swards as well as on WC productivity and persistence under animal grazing.
MATERIALS AND METHODS
Experimental site, design and management
An animal grazing plot experiment was established in June 2012 at the Teagasc Animal and Grassland Innovation Centre, Fermoy, Co. Cork, Ireland (52°16′N; 8°26′W). The soil type was a free-draining acid brown earth of sandy loam-to-loam texture. Soils had a pH of 6·5 and were index 3 (scale 1–4, 1 = deficit, 4 = no response to application of nutrient) for phosphorus (P; 6·5–10 mg/l) and potassium (K; 140 mg/l). The experiment had a randomized block design with a 2×2 factorial arrangement of treatments with five replicates of 18 × 3 m plots. The four treatments were: 250 kg N/ha without WC (HN−C), 250 kg N/ha with WC (HN+C), 100 kg N/ha N without WC (LN−C) and 100 kg N/ha with WC (LN+C). Four diploid (D) and four tetraploid (T) perennial ryegrass varieties were sown: Aberchoice (D), Abercraigs (T), AstonEnergy (T), Drumbo (D), Denver (D), Glenveagh (D), Kintyre (T) and Twymax (T). Sowing rates were 37 kg/ha for the tetraploid varieties and 34 kg/ha for the diploid varieties. The medium leaf WC variety Crusader was included at 5 kg/ha. At sowing, all plots received 68, 13 and 56 kg/ha of N, P and K, respectively.
Grazing management and fertilizer application
Swards were managed by N application and grazing rotation length: High-N swards were managed on a 21-day grazing rotation (Man 1) and low-N swards were managed on a 30-day grazing rotation (Man 2) from 2013 to 2015 inclusive. Dairy cows grazed the Man 1 swards nine times in 2013, 2014 and 2015. Man 2 swards were grazed seven times in 2013, eight times in 2014 and nine times in 2015. All swards were grazed together during the first two grazing rotations in February and March, with high-N swards grazed on a 21-day grazing rotation and low-N swards grazed on a 30-day rotation thereafter until the last two grazing rotations in September and October when all swards were grazed together. All swards were monitored and grazed before the scheduled date of rotation if swards reached a pre-grazing herbage mass (HM) of 1500 kg DM/ha. The grazed area was offered on a replicate basis to dairy cows for 24–36 h dependant on animal intake to reach a target height of 4 cm. The swards were grazed at average pre-grazing sward heights of 7·8 cm (sd = 0·8), 8·6 cm (sd = 1·6) and 8·1 cm (sd = 1·1), in 2013, 2014 and 2015, respectively.
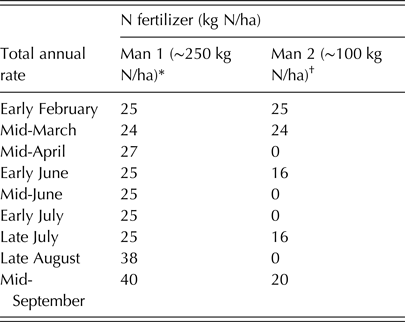
The N application strategy for each N application rate is presented in Table 1. Urea (46% N) was used for the first two applications and calcium ammonium nitrate (27% N) thereafter. All plots received 33 kg/ha/year of P and 66 kg/ha/year of K (applied as 0-10-20 N–P–K compound fertilizer), applied at the same time as the N applications to maintain soil fertility. Lime was applied at a rate of 2 t/ha to all plots in March 2014 to maintain soil pH.
Amount of nitrogen (N) fertilizer applied during the grazing season in each year of the study over 3 years

* Man 1 = 250 kg N/ha with 21-day grazing rotation.
† Man 2 = 100 kg N/ha with 30-day grazing rotation.
Sward measurements
Dry matter yield and pre- and post-grazing sward height
Pre-grazing HM (kg DM/ha >3·5 cm) was estimated before each grazing rotation for each plot by cutting a strip (~5 × 1·2 m) with a motor Etesia (Etesia UK Ltd, Warwick, UK). Harvested herbage was weighed and a sub-sample of 100 g for each cut was used to determine DM content. Seasonal yields were classified as spring (1 February to 10 April), mid-season (10 April to 6 August) and autumn (7 August onwards). White clover production (kg DM/ha) was calculated from the WC proportion at each individual pre-grazing HM assessment. Sward height was measured no more than 24 h directly before and after grazing throughout the experimental periods. Ten heights were taken across a diagonal for each plot using a rising plate meter with a steel plate (Jenquip, Fielding, New Zealand).
White clover proportion
Pre-grazing sward WC proportion (>3·5 cm) was estimated at every second grazing rotation in 2013 and every grazing rotation in 2014 and 2015 by removing a composite herbage sample (~70 g) using hand shears (Accu 60; Gardena International GmbH, Ulm, Germany). Herbage samples were selected from four random locations along a diagonal within the plot. Samples were manually separated into grass (perennial ryegrass plus any unsown grasses) and WC fractions, dried at 90 °C for 16 h and weighed to calculate sward WC proportion on a DM basis.
Tiller density and stolon mass
Three turves (10 × 10 cm) were removed at random from each plot in the spring, mid-season and autumn per grazing season to estimate grass tiller density and WC stolon mass (tiller/m2 and g DM/m2, respectively) as described by Evans et al. (Reference Evans, Williams, Jones and Evans1998). The perennial ryegrass, other unsown grass species and unsown dicotyledons were separated and counted. White clover stolons were separated from each turf, roots and leaves removed and the stolon gently washed to remove excess soil. Stolons were then dried at 40 °C for 48 h and weighed to obtain stolon DM weight.
Sward morphology
During the third, fourth and seventh grazing rotations (May, June and August, respectively), perennial ryegrass variety morphological composition was determined on two replicates of the four treatments immediately prior to grazing. Within each plot, grass samples (~40 g) were taken along a diagonal at eight points. The grass samples were cut to ground level using a scalpel blade, and the vertical structure of the sward was maintained in sample bags. The grass samples were weighed before separation into the upper and lower sward horizon: >4 and <4 cm (measured from ground level). The upper layer (>4 cm) was manually separated into leaf, pseudostem, true stem and dead. Dry matter content was determined by oven drying for 16 h at 90 °C.
Statistical analyses
All statistical analyses were carried out using PROC mixed in SAS (SAS 2011). All sward variables for DM yield production and tiller density were analysed using the following model:
 $$Y = \mu + A_i + C_k + M_j + (M_j \times C_k) + {\rm e}_{ijk}$$
where μ is the mean, A i = year effect (i = 1,2,3); C k = WC effect (k = 1,2); M j = management effect (j = 1,2); (C k × M j) is the interaction between WC and management; and e ijk is the residual error term. Non-significant terms were removed from the model. Rep was treated as a random effect.
All WC variables were analysed using the following model:
 $$Y = \mu + A_i + M_j + (A_i \times M_j) + {\rm e}_{ij}$$
where μ is the mean, A i = year effect (i = 1,2,3); M j = management effect (j = 1,2); (A i × M j ) is the interaction between year and management; and e ij is the residual error term. Non-significant terms were removed from the model. Rep was treated as a random effect.
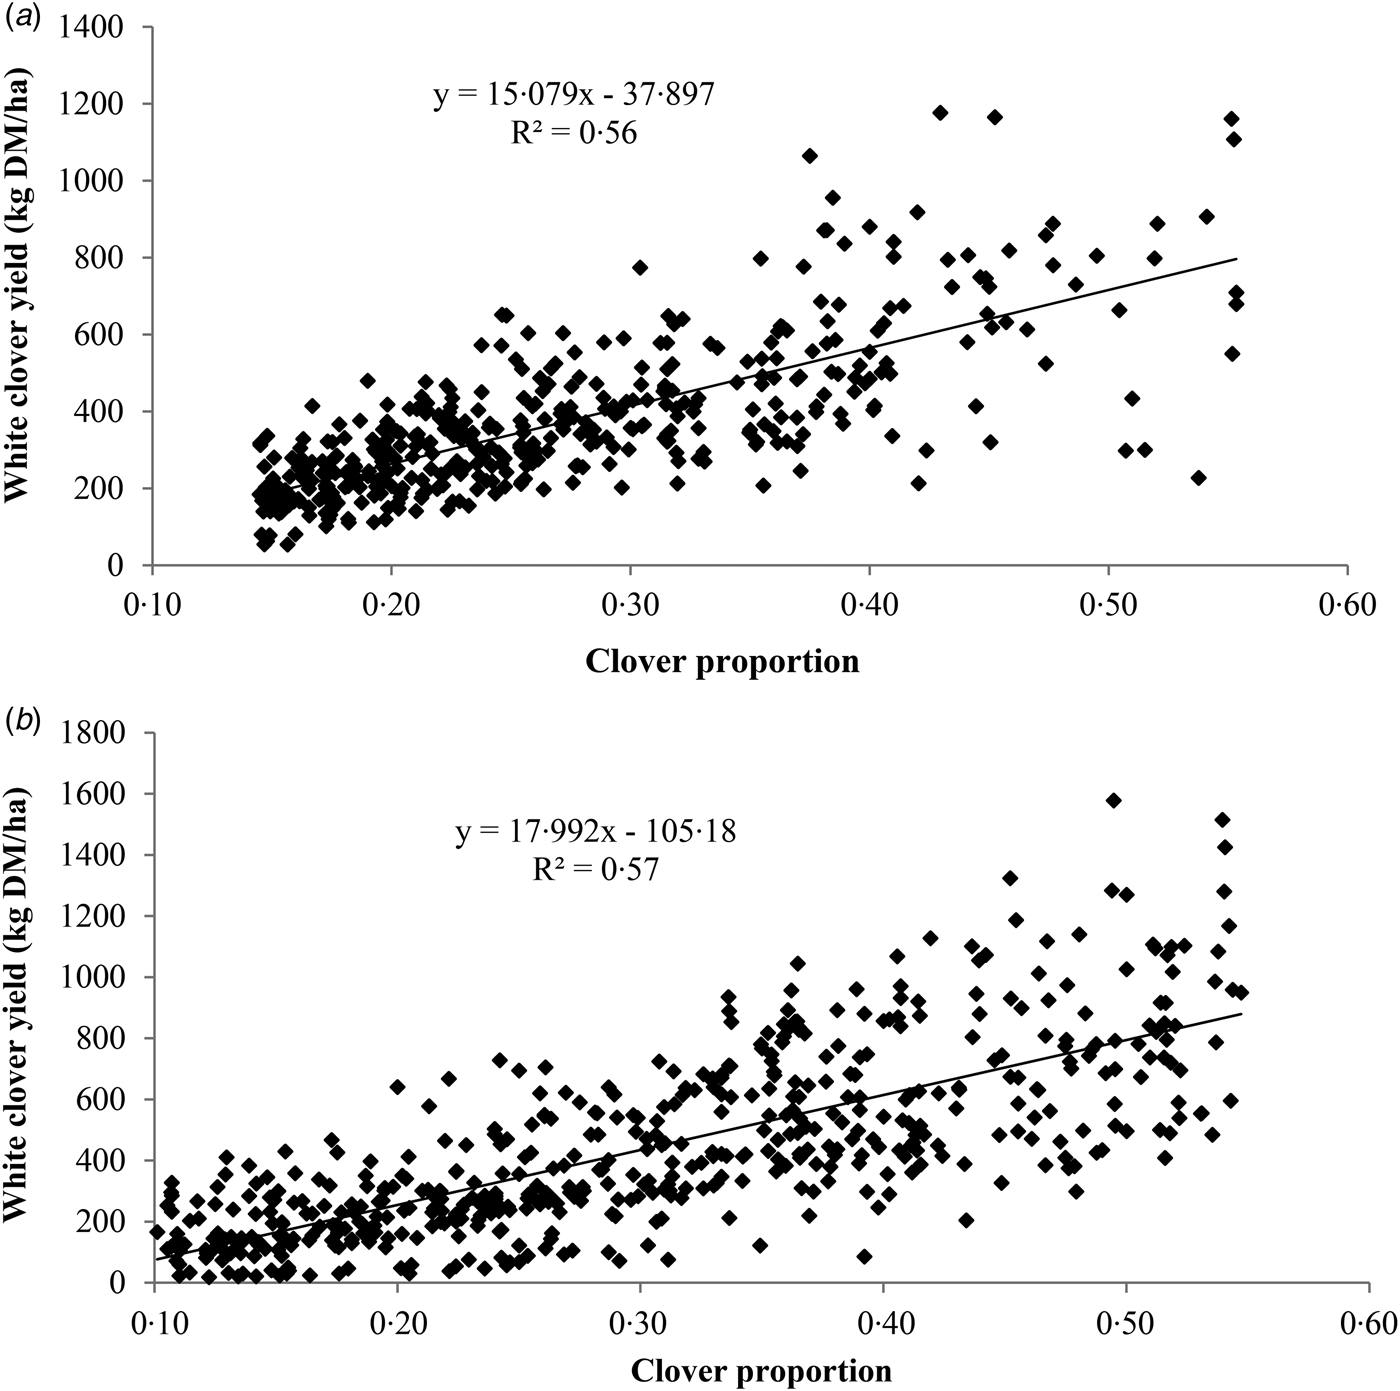
Regression models were fitted with the REG procedure in SAS (SAS 2011), to determine the relationship between WC proportion and clover DM yield from each cut of both managements from the base WC proportion of 0·15 compared with the top WC proportion of 0·55 in the data set.
RESULTS
All results discussed in this paper were interpreted over the 3 years of experimental results and are expressed as a mean.
Grass dry matter yield
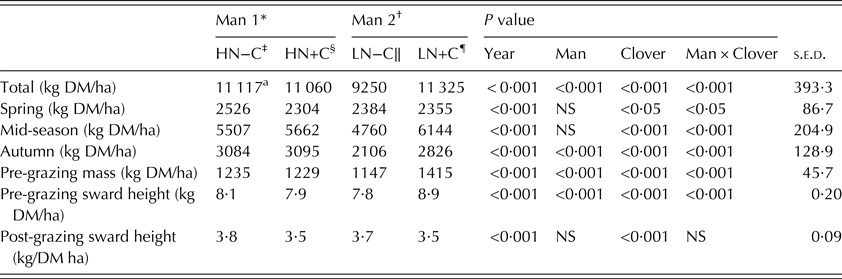
Grass DM yield performance of the examined swards is presented in Table 2. Year had a significant effect on annual DM yield of the examined swards (P < 0·001). On average, the swards yielded 8730 kg DM/ha in year 1, 11 038 kg DM/ha in year 2 and 12 296 kg DM/ha in year 3 of the experiment. Management had a significant effect (P < 0·05) on annual DM yield with Man 1 swards yielding 801 kg DM/ha more than Man 2 swards (10 288 kg DM/ha). This difference in annual yield was primarily driven from autumn yields where Man 1 swards yielded +544 kg DM/ha more (P < 0·001) than Man 2 swards (2466 kg DM/ha). The inclusion of WC significantly affected annual and seasonal yields. Mixed grass–clover swards yielded significantly more annual, mid-season and autumn (P < 0·001; +1009, +770, +336 kg DM/ha) DM yield compared with grass-only swards. Grass-only swards yielded significantly more in the spring (P < 0·05; +126 kg DM/ha).
The dry matter yield performance (annual and seasonal) and sward characteristics of grass swards sown with/without white clover at altered nitrogen and grazing rotation managements over 3 years

* Man 1 = 250 kg N/ha at 21-day grazing.
† Man 2 = 100 kg N/ha at 30-day grazing.
‡ HN−C = 250 kg N/ha at 21-day grazing rotation without white clover.
§ HN+C = 250 kg N/ha at 21-day grazing rotation with white clover.
‖ LN−C = 100 kg N/ha at 21-day grazing rotation without white clover.
¶ LN+C = 100 kg N/ha at 21-day grazing rotation with white clover; Clover = white clover.
There was a significant management × WC interaction (P < 0·001) over the 3 years for annual DM yield. The LN−C swards produced lower DM yield (−1917 kg DM/ha) than the swards of the other three treatments (11 167 kg DM/ha). Notably, LN+C produced the same annual total DM yield as swards under high N and a 21-day grazing rotation. Significant management × WC interactions occurred in the spring (P < 0·05), mid-season and autumn (P < 0·001). In spring, the HN−C grass sward produced a higher spring herbage (P < 0·05; +178 kg DM/ha) when compared with the other three swards (2348 kg DM/ha). During the mid-season growth period, the LN+C swards produced the highest DM yield (6144 kg DM/ha), followed by HN−C and HN+C (5585 kg DM/ha), and the LN−C swards produced the least DM yield (4760 kg DM/ha). The autumn period was similar to the annual yield trend between the examined swards, with LN−C producing significantly lower DM yield (P < 0·01; −896 kg DM/ha) compared with the other three treatments (3002 kg DM/ha).
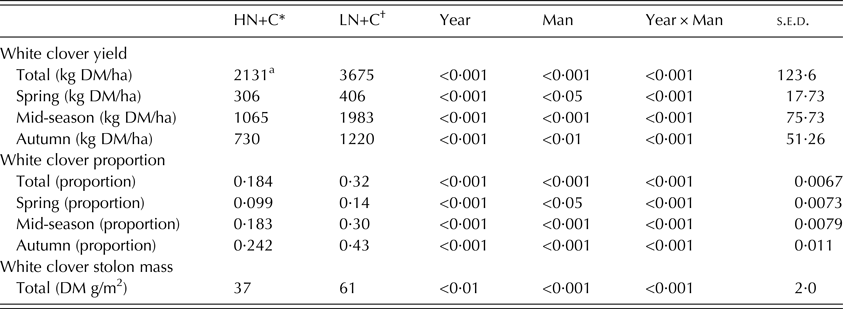
White clover DM contribution of grass–clover swards is presented in Table 3. Year had a significant effect on WC-DM yield contribution over the 3 years (P < 0·001). Total WC DM yield across the year was significantly (P < 0·001) altered by management. Man 1 swards had −1544 kg DM/ha less WC DM yield compared with the Man 2 swards (3675 kg DM/ha) over the entire grazing season. Man 2 grass–clover swards also produced higher spring (P < 0·05; +100 kg DM/ha), mid-season and autumn (P < 0·001; +918, +490 kg DM/ha) WC DM production than the Man 1 grass–clover swards during each period. For each 1% increase from 0·15 to 0·55 in WC proportion under Man 1, there was an extra 15 kg DM/ha (r2 = 0·56) of WC DM yield produced (Fig. 1(a)) with 18 kg DM/ha (r2 = 0·57) produced under Man 2 (Fig. 1(b)) for a similar per cent increase.
The relationship between DM yield of white clover and white clover proportion between ranges of 0·15 and 0·55 on grass–clover swards over 3 years. (a) High nitrogen+clover (250 kg N/ha at a 21-day grazing rotation with white clover). (b) Low nitrogen + clover (100 kg N/ha at a 30-day grazing rotation with white clover).

Effect of nitrogen and grazing management on white clover DM yield, proportion and stolon mass in grass–clover swards over 3 years

* HN+C 1 = 250 kg N/ha with 21-day grazing rotation with white clover.
† LN+C = 100 kg N/ha with 30-day grazing rotation with white clover.
White clover proportion
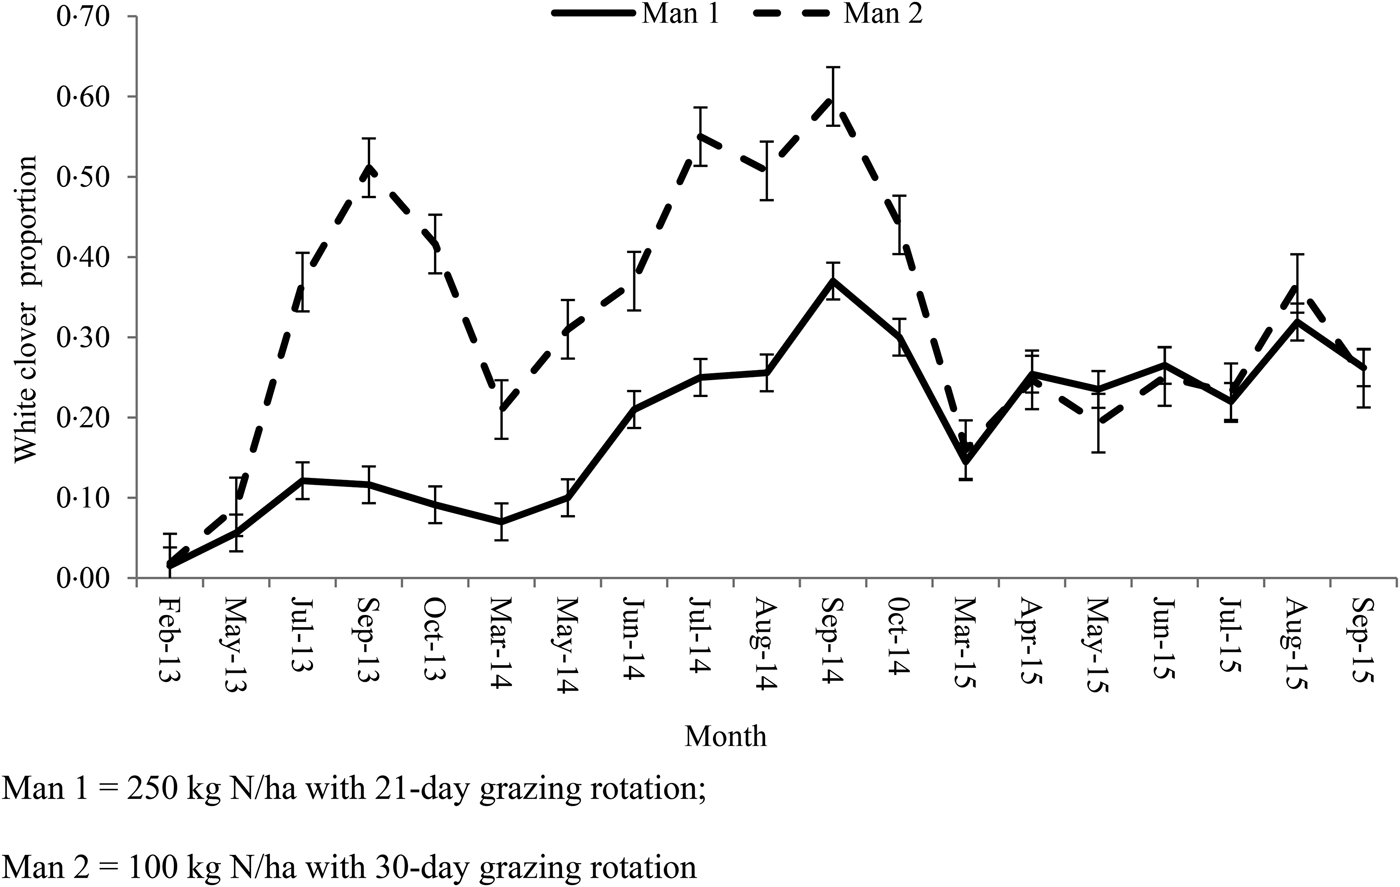
Year had a significant (P < 0·001) effect on WC proportion. Average WC proportion between the two managements was 0·19 in year 1, 0·33 in year 2 and 0·24 in year 3. This resulted in a significant year × management interaction for WC proportion (P < 0·001) occurring. The WC proportion growth habit over the 3-year experiment is displayed in Fig. 2. There was a consistent growth trend under both management regimes with Man 2 having significantly higher WC proportions in the sward during the mid-season and into the autumn of each year until year 3 where Man 2's WC proportion began to decline to the levels of the Man 1 regime for the duration of that year. When WC proportion is examined as a mean of the 3 years, management has a significant effect (P < 0·001) on annual WC proportion (Table 3). Man 1 had a mean annual WC proportion of 0·18 compared with Man 2 with a WC proportion of 0·32. Man 1 grass–clover swards had less WC proportion in spring (P < 0·05; −4·5%), mid-season and autumn (P < 0·001; −11·9%, −18·9%) than Man 2 grass–clover swards.
White clover proportion of grass–clover swards under alternating managements from 2013 to 2015.

Tiller density and stolon mass
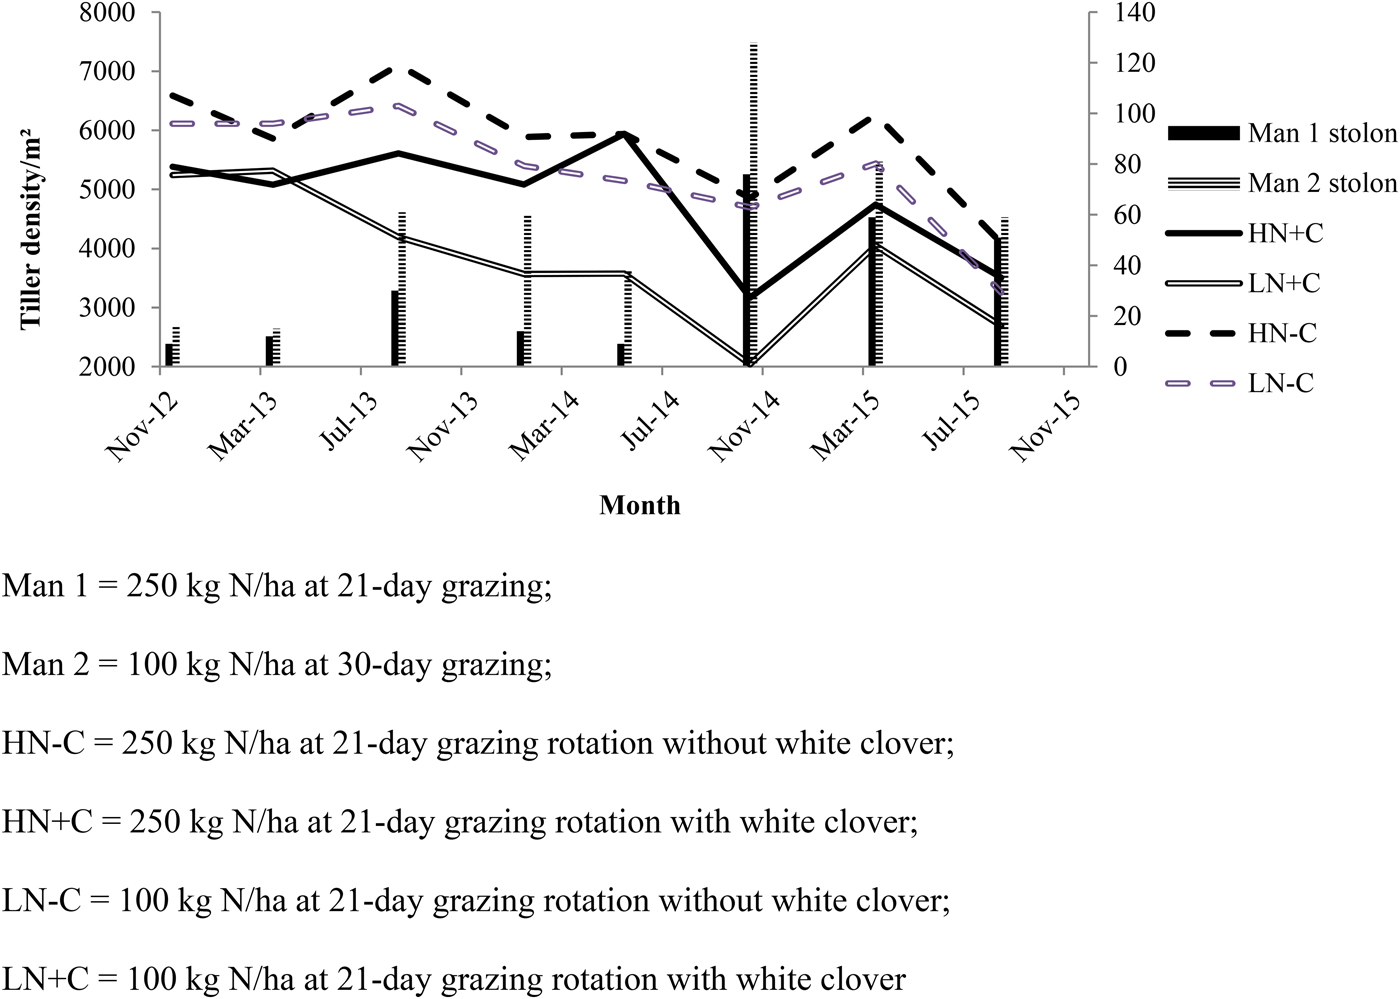
There was a significant year effect on tiller density of the examined swards (P < 0·001). In year 1, the swards averaged 5712 tillers/m2; in year 2, this reduced to 4611 tillers/m2 and declined again to a mean of 4140 tillers/m2. The tiller densities of the grass and the grass–clover swards over the 3-year experiment are displayed in Fig. 3. Swards under Man 1 had significantly more grass tillers (P < 0·001; +672 tillers/m2) than Man 2 swards (4485 tillers/m2). The introduction of WC into the grass sward significantly reduced (P < 0·001; −1330 tillers/m2) grass tiller density over the 3 years. There was a tendency (P = 0·08) for a management × WC interaction for tiller density, the HN−C swards had a tiller density of 5741 tillers/m2, followed by LN−C at 5231 tillers/m2, then by HN+C at 4572 tillers/m2 and the LN+C swards having the lowest tiller density at an average of 3740 tillers/m2. The addition of WC under Man 2 resulted in a numerically greater reduction (−1491 tillers/m2) in grass tillers compared with introducing into a grass sward under Man 1 (−1169 tillers/m2); however, magnitudes were not large enough to induce an interaction.
Tiller density of grass–clover and grass-only swards and stolon mass of grass–clover swards under alternating managements over 3 years.
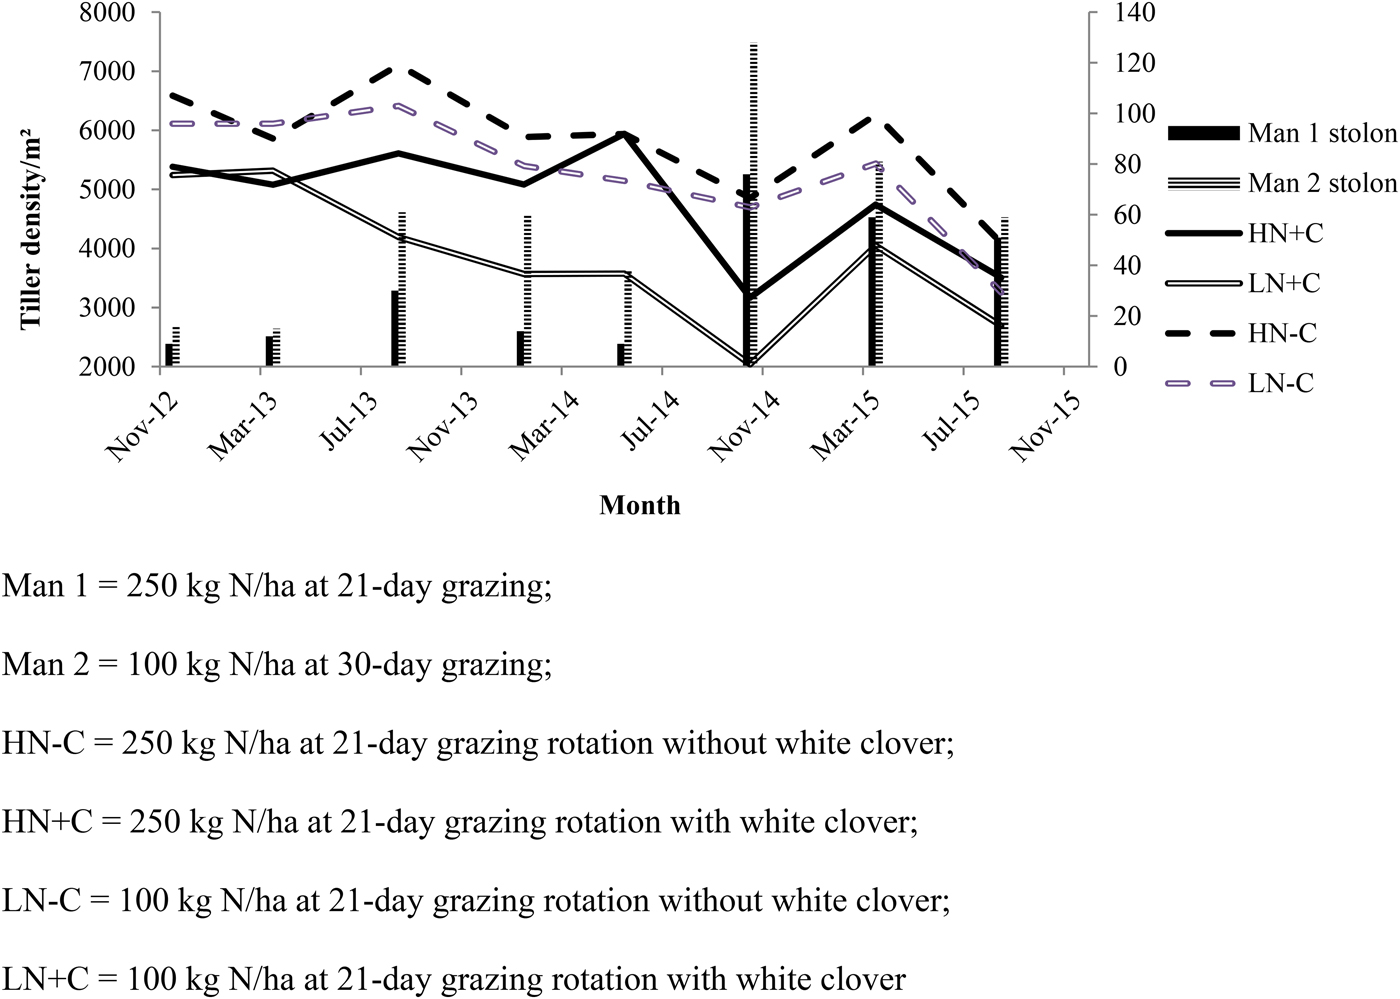
Year had a significant effect on WC stolon mass (P < 0·01). In year 1, stolon mass averaged 18·5 g/m2 between the two management regimes, and 32·6 g/m2 and 67 g/m2 in years 2 and 3, respectively. A significant interaction between year and management also occurred for stolon mass (P < 0·001) (Fig. 3). In Man 1, WC-sward stolon mass was 18, 34 and 59 g/m2 in years 1, 2 and 3, respectively, in comparison to 33, 76 and 75 g/m2 for the Man 2 WC swards. Management had a significant effect on WC stolon mass (P < 0·001), with Man 1 swards averaging 24 g/m2 less stolon mass compared with Man 2 swards over the 3 years (Table 3).
Sward morphology
There were no significant management × WC interactions for leaf, stem and dead proportions to report during any of the measurement periods (May, June and August). In May, when the swards were in a pre-reproductive growth stage, swards managed under Man 1 had significantly more leaf (P < 0·001; +6%), less pseudostem (P < 0·001; −5%), less true stem (P < 0·001; −2%) and more dead (P < 0·05; +1%) proportion than Man 2 swards (proportions of 0·63, 0·24, 0·05 and 0·08, respectively) over the 3 years.
In June, when the swards were undergoing reproductive morphological changes, Man 1 swards again had significantly more leaf (P < 0·001; +7%), more pseudostem (P < 0·01; +2%), less true stem (P < 0·001; −5%) and less dead (P < 0·001; −3%) proportion than Man 2 swards (0·54, 0·18, 0·14 and 0·14). The introduction of WC into the sward resulted in an increase in grass pseudostem proportion (P < 0·05; +2%) compared with grass-only swards (0·18). When the swards returned to a post-reproductive vegetative growth stage in August, WC had a more significant impact on the morphology of the grass. Swards incorporating WC had significantly less leaf (P < 0·001; −3%) and more pseudostem (P < 0·001; + 2%) than grass-only swards (0·84 and 0·08).
DISCUSSION
Intensification of agriculture, particularly dairy farming, has led to increased pressures on grassland pastures to provide sufficient forage of high feeding value for low-cost milk production, while remaining environmentally sustainable. Due to the removal of milk quotas in the EU and improved farm productivity incentives, the inclusion of competitive legumes in grassland pastures has been identified as a viable component of ruminant production in modern dairy farming (Woodfield & Clark Reference Woodfield and Clark2009). The DM yield performance of grass swards grown with or without WC using differing N fertilization and grazing rotation strategies was assessed over three animal grazing seasons. The inclusion of clover under reduced N input, employing a longer grazing rotational interval, resulted in significant herbage production on a par with swards receiving substantially higher levels of N and grazed more frequently over 3 years. This experiment is highly representative of the sward types and managements employed in temperate grazing systems, so the findings of the current work have important implications for the grassland industry in temperate maritime climates.
Dry matter yield performance
Nitrogen is the greatest driver of sward productivity in temperate grasslands (Frame & Newbould Reference Frame and Newbould1986; Whitehead Reference Whitehead1995) and has been the focus of many experiments involving mixed sward herbage production (Ledgard et al. Reference Ledgard, Sprosen, Steele and West1995; Harris & Clark Reference Harris and Clark1996). In the current study, higher N application resulted in a higher annual and autumn DM yield sward performance, which was expected (Ledgard et al. Reference Ledgard, Sprosen, Steele and West1995; Hennessy et al. Reference Hennessy, O'Donovan, French and Laidlaw2008). No management effect was seen in the spring period, due to N application or grazing rotation remaining similar between management regimes. Mid-season herbage production was not significantly affected by management, with the greatest difference occurring in autumn. Higher N fertilizer use in autumn increased herbage production, as soil temperatures declined and pasture growth was reduced. This is an important finding for the N application strategy of farms seeking to extend their grazing season. Increasing annual N application by 150 kg N/ha resulted in an additional 8% in annual DM production or 5 kg DM/ha per additional kg N applied. This response to N was lower than responses of up to 15·7 kg DM recorded by O'Donovan et al. (Reference O'Donovan, Delaby, Stakelum and Dillon2004) at the same site; however, that study did not include WC in the swards.
Inclusion of WC significantly increased annual, mid-season and autumn herbage production in comparison to grass-only swards over the 3 years, similar to previous findings (Kirwan et al. Reference Kirwan, Luscher, Sebastia, Finn, Collins, Porqueddu, Helgadottir, Baadshaug, Brophy, Coran, Dalmannsdóttir, Delgado, Elgersma, Fothergill, Frankow-Lindberg, Golinski, Grieu, Gustavsson, Höglind, Huguenin-Elie, Iliadis, Jørgensen, Kadziuliene, Karyotis, Lunnan, Malengier, Maltoni, Meyer, Nyfeler, Nykanen-Kurki, Parente, Smit, Thumm and Connolly2007; Enriquez-Hidalgo Reference Enriquez-Hidalgo2014). Spring growth on the grass–clover swards varied between years, making it more unpredictable than grass-only swards for spring growth (Frame & Newbould Reference Frame and Newbould1986; Andrews et al. Reference Andrews, Scholefield, Abberton, McKenzie, Hodge and Raven2007); lower clover spring growth has been indicated to compromise spring herbage production on perennial ryegrass/clover swards (Frame & Newbould Reference Frame and Newbould1986). Spring herbage availability is the most economically important to a spring-calving pasture-based system (McEvoy et al. Reference McEvoy, O'Donovan and Shalloo2011), which is an important consideration for the usage of grass–clover swards for these systems and needs to be recognized economically across commercial grassland farms. The contribution of WC to DM yield in the mid-season and autumn was significant in the sward mixtures, which is in line with the seasonal growth pattern of clover (Harris & Clark Reference Harris and Clark1996; Andrews et al. Reference Andrews, Scholefield, Abberton, McKenzie, Hodge and Raven2007); however, such contributions generally occur when grass growth rates are already sufficient to support livestock capacity when fertilized adequately.
Significant management × WC interaction occurred for annual DM yield of the examined swards and this interaction was maintained for each season. Such interactions were driven from contribution of WC to sward productivity being reduced under a higher N input, short rotation management regime, relative to the low N, longer rotation treatment. This finding was in line with previous reports (Enriquez-Hidalgo Reference Enriquez-Hidalgo2014). White clover proportion has been shown to have significant impact on N fixation (Kristensen et al. Reference Kristensen, Høgh-Jensen and Kristensen1995), with lower N swards benefiting most in additional DM yield. A reduced contribution to total DM yield by WC was associated with reduced WC proportion at high N rates (Camlin Reference Camlin1981). Egan et al. (Reference Egan, Lynch and Hennessy2015) also found a similar result at the same site over 2 years on a larger farm scale experiment, where perennial ryegrass/WC swards did not produce significantly more herbage than grass-only swards under high N rates, but under lower N input, the grass–clover sward's WC contribution to cumulative DM yield was much greater. In contrast, McCarthy et al. (Reference McCarthy, Dineen, Guy, Coughlan and Gilliland2015) demonstrated that WC contribution to additional DM yield in sward mixtures can be significant under high N fertilizer rates, but this was at significantly higher WC proportions of close to 0·40 at a different site. The findings of the current experiment and previous research indicate that WC proportion in the sward has a significant impact on contribution to DM yield of grass clover. Previous reports have stated a WC proportion of about 0·20 is necessary to achieve improved yield performance; however, in intensive grassland farming proportions of >0·30 annual sward WC at higher N fertilization may be necessary to realize mixed sward production potential.
White clover proportion
White clover proportion is a major driver in sward performance for grass–clover mixtures and competition within the sward between species will have significant effects on DM yield performance (Camlin Reference Camlin1981; Luscher et al. Reference Luscher, Mueller-Harvery, Soussana, Rees and Peyraud2014). The effect of N on sward WC proportion in the current work was clear and was in agreement with previous findings in the literature. Under higher N fertilizer use, the competitive nature of grass restricted WC proportion to magnitudes below the target for desirable agronomic performance (0·20; Clark & Harris Reference Clark, Harris and Woodfield1996) over the 3 years. The detrimental N fertilizer effect on sward WC proportion has been attributed to the reduction in light quantity and quality available for WC (Thompson Reference Thompson1995; Hoglind & Frankow-Lindberg Reference Hoglind and Frankow-Lindberg1998). Low-N swards received less N, applied less frequently over a longer grazing rotation length. This gave an added competitive advantage to WC plants with a reduced number of less competitive grass tillers (Frame & Boyd Reference Frame and Boyd1987; Yu et al. Reference Yu, Nan and Matthew2008; Phelan et al. Reference Phelan, Casey and Humphreys2013), allowing WC plants to establish and multiply at a faster rate in the mixed sward.
Some authors have suggested that spring is the main time when WC growth can be depressed by N application (Ledgard et al. Reference Ledgard, Sprosen, Steele and West1995; Harris & Clark. Reference Harris and Clark1996), with N applications during spring supressing sward WC proportion and production later in the year (Laidlaw Reference Laidlaw1984; Frame & Boyd Reference Frame and Boyd1987; Hoglind & Frankow-Lindberg Reference Hoglind and Frankow-Lindberg1998). Within the current experiment, there was no clear sign of spring N application affecting WC proportion into the remainder of the year. This was in agreement with other research stating that small amounts of N fertilizer can improve WC growth without compromising N fixation (Crush et al. Reference Crush, Cosgrove and Brougham1982). Similarly, Davies (Reference Davies1992) suggested that doses up to 60 kg N/ha will have a minimal effect on WC if they are applied in early spring. In fact, repeated concentrated N application at short intervals was the greatest suppressant of WC proportion in the current study, which was evident from the WC proportion pattern after the spring into the mid-season and autumn. Such effects of N fertilizer usage on WC proportion would be expected, but evaluation under animal grazing offers an added insight into WC productivity under farm conditions. Further research may be required to establish improved management strategies to ensure productivity of grass–clover swards is maximized throughout each season.
Persistence of white clover
There has been limited research into the impact of annual variability in WC proportion on annual and long-term pasture productivity (Ledgard et al. Reference Ledgard, Sprosen, Penno and Rajendram2001). Persistence of pastures is strongly linked to how growth units respond to the frequency, severity and timing of defoliation (Harris Reference Harris1973) with management techniques in mixed swards playing an important role in maintenance of sward WC proportion (Tow & Lazenby Reference Tow and Lazenby2001). In the current experiment, a longer grazing interval throughout the entire grazing season coupled with reduced N fertilizer usage resulted in significant WC proportions in the swards of >0·50 during peak times (mid-season) for the first 2 years of experimentation. In the third year, WC proportion and DM contribution declined significantly under this management regime, similar to findings of Frame & Boyd (Reference Frame and Boyd1987) and Wilman & Hollington (Reference Wilman and Hollington1985). This decline in WC proportion could be related to elevated WC proportion and biological N fixation (BNF) in the first two grazing seasons increasing soil N over time to the point of its own decline in proportion and BNF (Ledgard & Steele Reference Ledgard and Steele1992; Haystead Reference Haystead, Davies, Baker, Grant and Laidlaw1993). An increased grazing interval, leading to the highest pre-grazing HM over the 3 years, may have made WC plants susceptible to canopy shading effects and had a detrimental effect on persistence. The decline in WC stolon mass was not as severe as the decline in WC proportion under low N, suggesting that WC proportion may recover over time and return to productive levels once soil N levels decrease due to grass uptake (Schwinning & Parsons Reference Schwinning and Parsons1996).
In contrast to this, under the high N short grazing rotation management, despite sward WC proportion remaining lower on average, it persisted better over the 3 years. Frequent grazing has been shown to improve sward WC proportion (Harris & Thomas Reference Harris and Thomas1973; Harris Reference Harris, Baker and Williams1987; Davies Reference Davies1992; Harris & Clark Reference Harris and Clark1996; McKenzie et al. Reference McKenzie, Jacobs, Riffkin, Kearney and McCaskill2003; Phelan et al. Reference Phelan, Casey and Humphreys2013) by enhanced radiation penetration through the canopy (Black et al. Reference Black, Laidlaw, Moot and O'Kiely2009). In the current experiment, frequent grazing helped to minimize the N application effects on WC persistence over 3 years (Harris & Clark Reference Harris and Clark1996). Despite a stable WC proportion under this management, WC contribution to yield remained poor. Since swards of an annual WC content of around 0·20 are not enough to enhance the overall DM productivity or feeding value of a mixed sward (Andrews et al. Reference Andrews, Scholefield, Abberton, McKenzie, Hodge and Raven2007), the role of WC inclusion has in intensive N input grazed swards remains questionable if WC proportion cannot be increased. Persistence of WC, subject to management, must be further examined beyond a 3-year timeframe to make comprehensive recommendations regarding the productivity of grass–clover swards at commercial farm level. Current evaluation at research level surrounding farm system production of grass–clover swards will offer insight into lifetime productivity of WC in swards; however, evaluation at national farm level would provide a definite measure of WC persistence.
Sward morphology
Sward morphology, namely leaf and stem fractions, has been identified as an important aspect of a grazing sward, with distinctive morphological traits having significant effects on sward utilization and animal performance of grass swards (Gowen et al. Reference Gowen, O'Donovan, Casey, Rath, Delaby and Stakelum2003). Increased N application has been shown to increase tiller density but also the number of tillers per plant, which leads to greater leaf availability (Harris & Clark Reference Harris and Clark1996). In general, increased N fertilizer usage at shorter grazing intervals increased leaf proportion and reduced stem fractions of the grazed swards during the pre-heading and heading growth periods. This increased leaf proportion may be due to a combination of higher N availability and a shorter regrowth interval, which would minimize the development of standing stem. The inclusion of WC in the post-heading period (August), when WC proportion reached its peak, resulted in grass tillers of lower leaf and higher stem proportion. This may be due to increased competition for light within the sward canopy due to an increased number of WC leaves, resulting in ryegrass tillers being out-competed for leaf area within the canopy for light interception. There was no management × WC interaction for leaf, stem or dead proportion within the current study, confirming that perennial ryegrass morphology will remain unchanged regardless of management and WC inclusion combinations.
Considerations for the benefits of WC inclusion in grass in swards must take N use and grazing rotation into account to maximize production benefits associated with WC. Results from the current study indicate that greatest DM yield performance will be obtained from WC over 3 years when chemical N fertilizer inputs are maintained at low levels and grazing rotation is close to 30 days. This offers much potential to low input sustainable production systems. Other research in this area has yielded similar findings (Egan et al. Reference Egan, Lynch and Hennessy2015). When selecting a management strategy for lifetime productivity of such swards, it remains unclear of how WC will perform and persist in a mixed sward for a period >3 years under low N fertilizer inputs at longer grazing intervals.
CONCLUSION AND IMPLICATIONS
The results from the current study indicate that DM yield performance of grass swards are significantly increased when WC is introduced under a low N extended grazing rotation. White clover inclusion in grass swards at higher N input and shorter grazing interval has minimal effect on DM yield productivity with WC proportion remaining below desired agronomic levels. Variations in WC productivity into the final year of the experiment indicate that persistence of significant contribution to DM yield by WC under low N at longer grazing intervals remains unclear after 3 years. Such variations in WC proportion highlight the importance of careful management of WC swards to improve productive sward lifespan. Recommendations around WC incorporation in grass swards under low input scenarios need careful consideration for the persistence of pasture performance >3 years with further experimentation necessary to make definitive conclusions.
The authors would like to express their gratitude to M. Feeney, A. McGrath, P. O'Connor, R. Fitzgerald and J.P. Murphy for their technical assistance, as well as the Moorepark farm staff for their care of the experimental animals.