I. INTRODUCTION
Fe–Mn–Si alloys have attracted extensive attention over the past three decades, as they are promising materials for civil applications, such as pipe joints and dampers due to their unique shape memory effect, good damping capacity, and low cost over other shape memory alloys (SMAs). Reference Stanford and Dunne1–Reference Koyama, Sawaguchi and Tsuzaki5 Recent research reveals that Fe–Mn–Si alloys are a type of potential degradable biomaterial used for cardiovascular stents, because of their good biocompatibility, degradability, high mechanical performance, and low hemolysis percentage. Reference Xu, Hodgson and Cao6–Reference Xu, Hodgson and Cao8 Traditionally, Fe–Mn–Si alloys are fabricated by casting, followed by a series of thermomechanical treatments. To date only few publications have reported on the fabrication of Fe–Mn–Si alloys using powder metallurgy (PM). This is because PM routes are difficult to achieve fully dense alloys and the presence of porosity may affect the shape memory effect and mechanical properties of these alloys. However, the presence of porosity may not be always adverse; in some cases the porous microstructure is preferable because the porous biodegradable materials exhibit a few advantages. Firstly, the pores in PM Fe–Mn–Si alloys give rise to a higher degradation rate, as compared to their pore-free counterparts prepared by casting because of the larger surface area created by the pores. Secondly, the mechanical and physical properties, such as strength and stiffness can be adjusted via the amount of porosity and the pore characteristics.
According to the Ellingham diagram, Reference Miller, Vandome and John9 both alloying elements Mn and Si exhibit high sensitivity to oxygen. Sintering Fe–Mn–Si alloys under high vacuum is one of the solutions to prevent the reaction of Mn and Si with oxygen. However, the sublimation of Mn during sintering Fe–Mn–Si alloys with high Mn concentration (≥20 wt%) in vacuum is an issue that cannot be neglected, as Mn presents a high vapor pressure at high sintering temperatures. Reference Šalak, Selecka and Bureš10 The sublimation of Mn affects the composition of the sintered Fe–Mn-based alloys, and hence their mechanical and corrosion properties. Therefore, it is important to investigate the sublimation behavior of Mn in Fe–Mn based alloys during vacuum sintering and the resulting microstructure in the sintered compacts. Moreover, the investigation on the sublimation/evaporation of elemental Mn in Mn steels or Fe-based alloys is very scarce. Currently, the available references on the evaporation/sublimation of Mn focus on alloys with low Mn content (≤5 wt%). Reference Hryha, Dudrova and Nyborg11,Reference Hryha, Gierl, Nyborg, Danninger and Dudrova12 In other words, Mn evaporation/sublimation behavior in steels/Fe-based alloys with high Mn content (≥5 wt%) is still uncertain. In this paper, the ternary Fe–28Mn–3Si (in wt%) powder mixtures were sintered at different temperatures under a high vacuum of 5 × 10⁻³ Pa. We compared, for the first time, the mass loss of the sintered Fe–Mn–Si compacts containing high Mn content (≥20 wt%). In addition, we discussed the effects of mechanical milling (MM) and sintering temperatures on the sublimation behavior of Mn in the sintered compacts.
II. CALCULATION OF PARTIAL PRESSURE
The activity of element i (denoted as a i ) is directly related to chemical potential, and is described as:
 $${a_i} = \exp \left( {{{{\mu _i} - \mu _i^0} \over {RT}}} \right)\quad ,$$
where μ
i
is the chemical potential of i in a certain state,
 $\mu _i^0$
is the chemical potential of i in the standard state, R is the gas constant, T is the temperature in Kelvin. Therefore, the activity is 1 for a pure element in the standard state.
The chemical potential of element i is calculated from the Gibbs energy:
 $${\mu _i} = {\left( {{{{\partial _G}} \over {{\partial _n}_i}}} \right)_{T,P,{n_j}(j \ne i)}}\quad ,$$
where the temperature (T), pressure (P), and composition of other elements are constants.
At equilibrium, μ i is the same value for all the phases. For instance, the following relationship is fulfilled for a three-phase equilibrium (α + β + γ phases) in a ternary A–B–C system:
 $$\mu _i^\alpha = \mu _i^\beta = \mu _i^\gamma \quad .$$
The Gibbs energy of a solution phase (ϕ) in a ternary A–B–C system can be described by the Redlich–Kister polynomial Reference Redlich and Kister13 :
 $${}^0G_{\rm{m}}^\varphi = {x_{\rm{A}}}{}^0G_{\rm{A}}^\varphi + {x_{\rm{B}}}{}^0G_{\rm{B}}^\varphi + {x_{\rm{C}}}{}^0G_{\rm{C}}^\varphi + RT\left( {{x_{\rm{A}}}\ln {x_{\rm{A}}} + {x_{\rm{B}}}\ln {x_{\rm{B}}} + {x_{\rm{C}}}\ln {x_{\rm{C}}}} \right) + {x_{\rm{A}}}{x_{\rm{B}}}L_{{\rm{A,B}}}^\varphi + {x_{\rm{B}}}{x_{\rm{C}}}L_{{\rm{B,C}}}^\varphi + {x_{\rm{A}}}{x_{\rm{C}}}L_{{\rm{A,C}}}^\varphi + {}^0G_{{\rm{A,B,C}}}^\varphi + {}^\Delta {G_{{\rm{mag}}}}$$
where x
i
is the molar fraction of element i,
 ${}_{}^0G_i^\varphi$
is Gibbs energy at the standard state, the terms
 $L_{i,j}^\varphi$
(i, j = A, B, C) are the interaction parameters from the binary systems,
 ${}_{}^0G_{{\rm{A,B,C}}}^\varphi$
is the excess Gibbs energy and
 $^0{G_{{\rm{mag}}}}$
is the magnetic contribution to the Gibbs energy.
The Gibbs energies of all phases in the ternary Fe–Mn–Si system have been determined using the CALPHAD method Reference Saunders and Miodownik14 in Ref. Reference Forsberg and Ågren15. These data were used to calculate the activities of Fe, Mn, Si of the ternary Fe–Mn–Si alloys in this work.
The sublimation rate of an element in the alloy is determined by its equilibrium partial pressure
 $\left( {P_i^{\rm{p}}} \right)$
, as:
 $$P_i^{\rm{p}} = {a_i} \cdot {P_i}\quad .$$
Where
 ${P_i}$
is the equilibrium vapor pressure of a pure element i. The values of
 ${P_{{\rm{Fe}}}}$
,
 ${P_{{\rm{Mn}}}},$
and
 ${P_{{\rm{Si}}}}$
, as a function of temperature, are given in the following three relations.
Reference Lide16
 $$\log {P_{{\rm{Fe}}}} = 12.106 - 21723/T + 0.4536\log T - 0.5846/{T^{ - 3}}\quad .$$
 $$\log {P_{{\rm{Mn}}}} = 17.811 - 15097/T - 1.7896\log T\quad .$$
 $$\log {P_{{\rm{Si}}}} = 12.325 - 19720/T\quad .$$
The sublimation rate of an element was calculated using Langmuir theory Reference Jones and Mackay17–Reference Chen, Cao, He, Shen and Gao19 :
 $${N_i} = - {K_{\rm{L}}} \cdot \varepsilon \cdot p_i^{\rm{p}} \cdot \sqrt {{{{M_i}} \mathord{\left/ {\vphantom {{{M_i}} T}} \right. \kern-\nulldelimiterspace} T}} \quad ,$$
where N
i
is the sublimation rate [g/(cm2 s)] of component i, K
L is Langmuir constant, ε is the condensation coefficient depending on the materials, for metals ε = 1,
 $p_i^{\rm{p}}$
is the partial pressure (Pa) of element i in the alloy system, M
i
is the molecular weight (g mol−1) of component i, and T is the absolute temperature in K.
III. EXPERIMENTAL
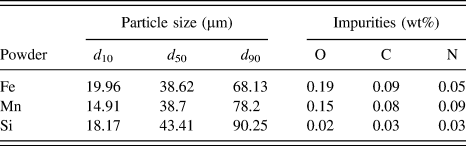
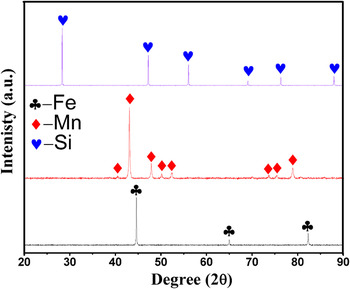
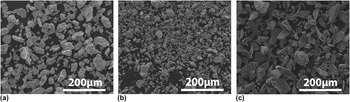
Three elemental powders were selected as the starting materials in this study: Fe (99.7% purity), Mn (99.7% purity), and Si (99.9% purity). Table I reveals that the mean particle sizes of Fe, Mn, and Si powders are 38.6, 38.7, and 43.4 μm, respectively. XRD patterns (Fig. 1) reveal that all powders present a single phase. The morphologies of these particles are shown in Fig. 2, where Fe powder is of irregular shape while Mn and Si powders exhibit an angular shape.
Particle size and main impurities of the starting powder.

X-ray diffraction patterns of the starting metal powders.

Morphologies of the starting powders (a) Fe, (b) Mn and (c) Si.

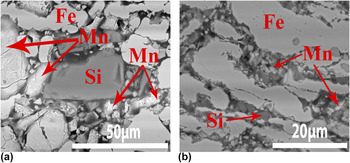
Powder mixtures with a nominal composition of 69 wt% Fe, 28 wt% Mn, and 3 wt% Si were used in our study. Two types of powder mixtures were prepared. One was performed with mechanical milling (MM) for 5 h using a planetary ball mill (Pulverisette 6, Fritsch, Idar-Oberstein, Germany) under Ar protection to avoid the oxidation of the powders. Detailed information on the MM parameters was shown in our previous work. Reference Xu, Hodgson and Cao6 In brief, the MM was carried out in a stainless steel vial with a ball-to-powder ratio of 5:1 and a rotation speed of 275 rpm. It is noted that the milling process was conducted in a dry environment. In other words, no lubrication or process control agents were used during the MM process. The other was a blended powder mixture (BE), which was gently blended for 10 h without ball milling. Figure 3 presents the morphology of both the BE and MM green compacts. As shown in Fig. 3, the particle size of Mn and Si in the MM powder mixture was reduced to ∼5 μm, significantly smaller compared to their BE counterparts (∼38 μm). The Fe particles were elongated via mechanical milling [Fig. 3(b)].
SEM micrographs of the Fe–Mn–Si green compacts: (a) BE powder mixture, (b) MM powder mixture.

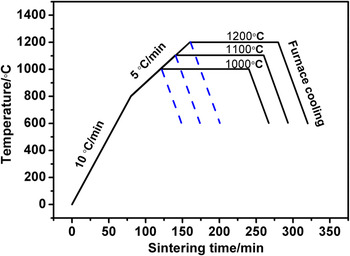
Both BE and MM powder mixtures were pressed into cylindrical discs 15 mm in diameter and 3.5 mm thick in a single-action steel die under a pressure of 400 MPa at room temperature. All of these green compacts were then sintered in a high vacuum furnace at 5 × 10⁻³ Pa, followed by furnace cooling. Figure 4 illustrates the temperature profile. The heating rate was set at 10 °C/min from room temperature to 800 °C, and 5 °C/min from 800 °C to the sintering temperature. The average furnace cooling rate is ∼60 °C/min if the temperature is above 600 °C. A total of six batches of samples were sintered at three temperatures including 1000, 1100, and 1200 °C. In detail, three batches of the samples were heated to the final temperatures (1000, 1100, and 1200 °C) and terminated without isothermal holding. Another three batches were further isothermally held for 3 h at 1000 °C, 1100 °C, and 1200 °C, respectively.
Temperature profile for vacuum sintering.

Open porosities of all the sintered compacts were measured by Archimedes principle, as specified in the ASTM B962-13 standard. Microstructure was observed using a scanning electron microscope (Quanta 200F, FEI Company, Hillsboro, Oregon) equipped with an X-ray energy dispersive spectrometer (EDS) attachment. Phase constituents were examined with X-ray diffraction (Bruker D2 Phaser, Bruker Corporation, Karlsruhe, Germany). The weight of both the green compacts and sintered compacts was measured with a high precision electronic balance. The weight loss is defined as (m 0 − m 1)/m 0, where m 0 is the original weight of the green compacts, while m 1 is the final weight of the samples after sintering.
IV. RESULTS
A. Weight loss and composition change
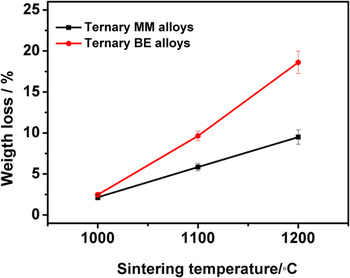
Figure 5 shows the weight loss of the samples sintered at the three temperatures for 3 h. The weight loss of the compacts sintered at 1000 °C is low (∼2.7%). However, increasing temperature results in a significant weight loss. For example, the weight loss of the BE compacts sintered at 1200 °C is ∼18.6%, ∼7-fold higher than that sintered at 1000 °C. It is also noted that the weight loss of the BE compacts is much larger than their MM counterparts sintered at the same temperature if the temperature is ≥1100 °C. For instance, the weight loss of the BE compacts sintered at 1200 °C is 18.6%, while that of the MM compacts is only approximately 9.5%.
Weight loss of the Fe–28Mn–3Si sintered at three temperatures for 3 h.

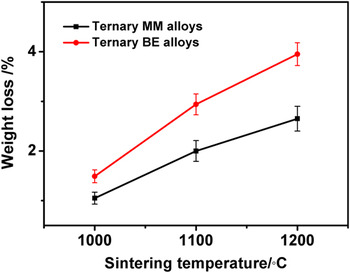
Figure 6 shows the weight loss of the Fe–28Mn–3Si compacts that were heated to the prescribed temperatures but without isothermal holding. As shown in Fig. 6, the weight loss shows a similar trend to those isothermally held for 3 h in that the weight loss of the MM compacts is lower than the BE compacts. However, for these compacts with no isothermal holding the weight loss is significantly lower; in all these compacts, the weight loss is no more than 3.6 wt% at all temperatures. The highest weight loss of ∼3.55% is observed in the BE compacts sintered at 1200 °C, which is only 1/5 of the BE compacts isothermally held for 3 h at the same temperature. This reveals that the weight loss mainly occurred during the isothermal holding stage.
Weight loss of the Fe–Mn–Si compacts heated between 1000 and 1200 °C with no isothermal holding.

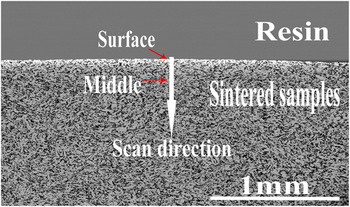
To identify the compositional distribution of Fe, Mn, and Si in the sintered ternary alloys, EDS line scans were conducted on a polished cross-section, as shown in Fig. 7.
Morphology of the cross-section of the Fe–28Mn–3Si compacts sintered at 1000 °C.

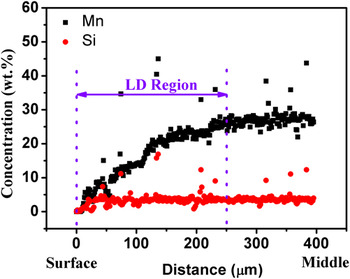
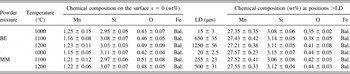
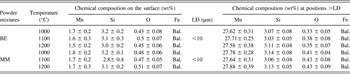
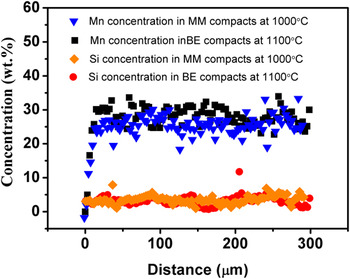
Figure 8 presents the Mn and Si line scan profile of the MM compacts sintered at 1100 °C for 3 h. We define the scan distance (x) recorded from the surface (x = 0) as the distance (x) from the surface. As shown in Fig. 8, the Mn content increases parabolically with the increase of the distance (x) from the surface, until Mn content approaches and stabilizes at ∼27 wt%. The Si content, however, fluctuates at ∼3.1 wt% in the same region (Fig. 8), which is in agreement with its nominal composition (3 wt%). The above results demonstrate that an obvious Mn depletion region exists on the surface layer of the sintered compacts. We define the length of this Mn depletion region from the surface to the location where the Mn content reaches its bulk composition as LD. As shown in Table II, LD varies with sintering temperature and the characteristics of the powder mixtures. LD of both the BE and MM compacts sintered at 1000 °C is very short, less than 15 μm. When the sintering temperature increases to ≥1100 °C, both the BE and MM compacts demonstrate temperature-dependent LD. For example, the LD value of the BE compacts sintered at 1100 and 1200 °C is ∼650 and ∼1200 μm, 43-fold and 80-fold higher than the BE compacts sintered at 1000 °C. It is also noted that mechanical milling reduces largely the value of LD, by comparing the MM compacts to the BE compacts sintered at the same temperature. For instance, the LD of the 1200 °C sintered MM compacts is approximately 500 μm, only ∼40% of their BE compacts. Table III and Fig. 9 show the chemical composition on the surface of the sintered samples with no isothermal holding, and the EDS line scan result of the cross-section of the samples with no isothermal holding, respectively. The Mn content on the surface of the sintered samples with no isothermal holding depletes seriously to less than 1.3 wt%, which is similar to that of the samples sintered for 3 h. However, the LD of the samples with no isothermal holding is very short as compared to the compacts sintered for 3 h. It is also noted that the EDS line scan profile (see Fig. 9) reveals that a relatively homogeneous distribution of Fe, Mn, and Si has obtained in the samples with no isothermal holding.
Mn and Si concentration in the cross-section of MM Fe–Mn–Si alloys sintered at 1100 °C for 3 h.

The average chemical composition of the ternary Fe–Mn–Si alloys sintered for 3 h at different temperatures.

The average chemical composition the ternary Fe–Mn–Si alloys sintered at different temperatures without isothermal holding.

Mn and Si concentration in the sintered ternary Fe–Mn–Si alloys with no isothermal holding at different temperatures.

B. Phase evolution of Fe–28Mn–3Si compacts
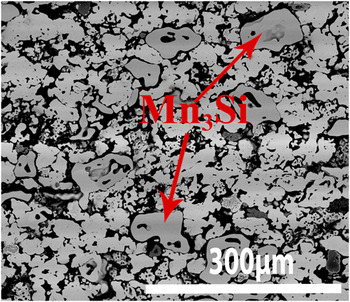
Figure 10 shows the XRD patterns recorded at the center of the cross-section (≥LD) of the compacts sintered at 1000, 1100, and 1200 °C for 3 h. It is clear that γ-austenite is the predominant phase in all the sintered compacts in addition to a minor ε-martensite. An exception is observed in the 1000 °C-sintered BE compacts in which an additional minor Mn3Si phase was also identified, and the morphology of the Mn3Si phase is shown in Fig. 11. The formation of the Mn3Si phase may be a combined consequence of the coarsening Si particles and the inhomogeneous powder mixing in the ternary BE green compacts, which is supported by Figs. 3(a) and 3(b). The surface of both the BE and MM compacts presents a single α-Fe phase in all the sintered samples, as shown in Fig. 12.
XRD patterns recorded at the center of the sample cross section (≥LD) of the ternary Fe–28Mn–3Si alloys sintered for 3 h at different sintering temperatures. (a) BE compact sintered at 1000 °C, (b) BE compact sintered at 1100 °C, (c) BE compact sintered at 1200 °C, (d) MM compact sintered at 1000 °C, (e) MM compact sintered at 1100 °C, (f) MM compact sintered at 1200 °C.

SEM micrograph of the ternary BE Fe–Mn–Si compacts sintered for 3 h at 1000 °C.

XRD results recorded on the surface (x = 0) of the ternary Fe–28Mn–3Si alloys sintered for 3 h at different sintering temperatures. (a) BE compact sintered at 1000 °C, (b) BE compact sintered at 1200 °C, (c) MM compact sintered at 1000 °C, (d) MM compact sintered at 1200 °C.

C. Open porosity
The open porosity, as shown in Fig. 13, decreases with sintering temperature. Each BE compact has a significantly higher open porosity than its MM counterpart sintered at the same temperature. The sintering temperature has less influence on the open porosities of the BE sintered compacts. For instance, the BE compacts presents an open porosity of ∼29% if sintering at 1200 °C while 34.5% if sintering at 1000 °C. By contrast, the open porosity in the MM compacts largely depends on the sintering temperature. For example, the open porosity decreases drastically from ∼25% if the compact are sintered at 1000 °C, to only ∼7.5% if sintered at 1200 °C.
Open porosities of the Fe–28Mn–3Si compacts sintered from both BE and MM powder mixture as a function of sintering temperature.

V. DISCUSSION
A. Effect of sintering temperature on the weight loss
As shown in Figs. 5 and 6, the weight loss of both the BE and MM compacts increases significantly with the sintering temperature. Table II and Fig. 8 demonstrate that the chemical compositions of the sintered compacts at a distance from the surface ≥LD are in good agreement to their nominal compositions. This reveals that limited weight loss occurs in the region ≥LD. In other words, the weight loss of the sintered compacts mainly happens in the region <LD. According to the ternary Fe–Mn–Si phase diagrams Reference Effenberg and Ilyenko20 and the XRD results, these compositions (1 wt% < Mn concentration < 28 wt%, Si concentration = ∼3.1 wt%) in the region <LD are in solid state if the sintering temperature is ≤1200 °C. Therefore, the weight loss of the compacts in this study is caused by the sublimation of the components during sintering.
As shown in Fig. 8 and Table II, the Mn concentration in all the sintered compacts increases parabolically with the increase of the distance (x) from the surface (x = 0) until it stabilizes at ∼27 wt% when the distance (x) was ≥LD. Moreover, the Si concentration fixes at a value of ∼3.1 wt% in all the sintered compacts, regardless of the temperature and the distance from the surface. In this case, the change of Fe concentration in LD region can be considered as a function of Mn concentration in the ternary Fe–Mn–Si compact.
Figure 14 is the calculated partial pressure (P) of Fe, Mn, and Si in the LD region of the ternary Fe–Mn–Si as a function of Mn concentration (1 wt% ≤ Mn concentration ≤ 28 wt%) based on the calculation theory in Sec. II.
Partial pressures of Fe, Mn and Si in Fe–Mn–Si alloys at different temperatures as a function of Mn concentration.

We use Langmuir theory Reference Jones and Mackay17–Reference Chen, Cao, He, Shen and Gao19 to illustrate the effect of temperatures on the sublimation rate of the sintered samples in theory. In our case, K L and ε are constants. The sublimation rate of element i is therefore a function of sintering temperature, according to Eq. (9).
Figure 15 presents the calculated sublimation rate of each element in the ternary Fe–Mn–Si system at different temperatures as a function of Mn concentration. Figure 15 reveals that the sublimation rate of all elements increases with the sintering temperature at any specific composition. Taking the composition containing 3 wt% Mn and 3 wt% Si for example, the sublimation rate of Fe, Mn, and Si at 1200 °C increases by ∼206, 24, and 450 times compared to their counterparts sintered at 1000 °C. Consequently, the weight loss of all the sintered alloys increases with sintering temperature.
Calculated sublimation rates of Fe, Mn and Si in the ternary Fe–Mn–Si system at different sintering temperatures as a function of Mn concentration.

B. Comparison on the sublimation rate of Fe, Mn, and Si in the system
The composition data summarized in Tables II and III clearly shows that Mn has been lost via sublimation during sintering. It is then speculated that the weight loss is mainly caused by the sublimation of Mn. In a porous solid material system, the weight loss via sublimation occurs on both the sample surface (x = 0) and also the walls (x > 0) of the open pores. We discuss that the sublimation occurs on both the surface (x = 0) and the open pore walls (x > 0) to confirm the hypothesis.
The chemical composition data in Table III and the EDS line scan results in Fig. 9 demonstrates that the Mn content on the surface decreases to a low stable content (∼1.3 wt%) before the start of the isothermal holding. Moreover, a comparison of the weight loss of the samples sintered for 3 h to that with no isothermal holding shows that the weight loss mainly occurs at isothermal holding stage. Based on the above results, it is concluded that the sublimation could be approximately considered to start at the isothermal holding stage. Thus, the chemical composition of the samples on the surface at any sintering stages could be approximately considered to be the surface chemical composition (Mn: ∼1.3 wt%, Si: 3 wt% and Fe: Bal.) of the sintered samples with no isothermal holding.
Figure 15 reveals that the sublimation rate of each element at the chemical composition (Mn: ∼1.3 wt%, Si: 3 wt% and Fe: Bal.) belonging to the surface is significantly different. At a certain temperature, e.g., 1100 °C, the sublimation rate of Mn is ∼34 times high than Fe and ∼105 times than Si. Moreover, based on Fig. 15, the partial pressure of Mn on the sample surface ranges from ∼0.025 to ∼0.7 Pa, much higher than the vacuum pressure in the furnace (5 × 10⁻³ pa). This indicates that Mn sublimates almost freely at all sintering temperatures. By contrast, the partial pressure of Si (<5.9 × 10⁻⁶ Pa) in the surface at all sintering temperatures is three orders of magnitude lower than the vacuum pressure in the furnace. It is therefore the sublimation of Si in Fe–Mn–Si alloys is negligible. This is also supported by the data from Table II. As shown in Table II, the Si concentration in the ternary Fe–Mn–Si alloys sintered at all temperatures stabilizes at ∼3.1 wt%, which is in good agreement to the nominal Si content (3 wt%) in the green compacts. As for Fe, the partial pressure of Fe at temperatures ≤1100 °C is ≤0.004 Pa, which is merely lower than the furnace pressure (0.005 Pa). This suggests that the sublimation of Fe on the surface is significantly suppressed at temperatures ≤1100 °C. At the temperature of 1200 °C, the Fe partial pressure is 0.5 Pa, which is slightly higher than the pressure of the vacuum chamber. This reveals that Fe sublimates freely in vacuum chamber when sintering at 1200 °C. However, considering the high ratio of the sublimation rate of Mn to Fe (∼34) in ternary system, the sublimation rate of Fe is much lower than Mn. Thus, the weight loss on the surface of the ternary Fe–Mn–Si compacts sintered at between 1000 and 1200 °C is mainly caused by the sublimation of Mn. This calculation is in good agreement to the data listed in Tables II and III.
An element is sublimed from the material’s surface. In this regard, the walls of open pores in the interior of the sintered compacts (the distance from the surface x > 0) are the sublimation sites at high temperatures.
As for the sublimation of Si on the walls of the open pores, the data in Fig. 14 shows that the partial pressure of Si in the ternary compacts, regardless of temperature and distance from the surface (x), is much lower than the pressure (∼5 × 10⁻³ Pa) in the furnace during sintering. This reveals that the Si sublimation is completely suppressed in the open pores.
Figure 14 shows that the vapor pressure of Fe in the ternary alloys decreases with the increase of the distance from the surface x (0 < x ≤ LD). This reveals that a negative concentration gradient of Fe vapor pressure forms in the open pores of the sintered compacts. According to Fick’s first law, a negative concentration gradient of Fe vapor prevents the flowing of Fe vapor from the interior area to the vacuum chamber, and therefore inhibits the sublimation of Fe in the open pores.
On the other hand, the Mn concentration increases with the increase of the distance from the surface (x = 0) until stabilizing at ∼27 wt% when the distance from the surface is beyond LD as shown in Fig. 8 and Table II. Consequently, this leads to a parabolic increase of the partial pressure of Mn as a function of the distance from the surface x (0 < x ≤ LD) in LD region, as shown in Fig. 14. This promotes the sublimation of Mn vapor as Mn vapor enables to flow from the interior area to the vacuum chamber due to the concentration gradient of Mn vapor according to Fick’s first law. Therefore, the weight loss in the open pores is caused by the sublimation of Mn vapor.
It should be noted that the above discussion in relation to the sublimation of all the elements is based on the condition that all Mn and Si elements are dissolved in Fe matrix during isothermal holding (i.e., under the fully alloyed conditions). The XRD (Fig. 16) and EDS line scan results (Fig. 9) confirm that Mn and Si powders have completely dissolved in Fe matrix and formed γ-austenite, when the MM and BE compacts were sintered at 1000 °C and 1100 °C respectively (both compacts were sintered at temperatures with no isothermal holding). In other words, complete alloying has been achieved at the initial stage of isothermal holding. Therefore the discussion on the sublimation rate based on Eq. (9) is applicable to the isothermal holding stage. Nevertheless, it cannot be excluded that part of the Fe, Mn, and Si elements may sublime in their elemental form, particularly at relatively low temperatures during temperature ramp. The calculated vapor pressures of the Fe, Mn, and Si in their elemental form based on Eqs. (6)–(8) at 1000 °C, are 2.8 × 10⁻⁴, 2.5 and 6.8 × 10⁻⁴ Pa, respectively. The vapor pressures of Fe and Si elements at 1000 °C are approximately one order of magnitude lower than the pressure in the vacuum chamber (5 × 10⁻³ Pa), while that of Mn element is much higher than the pressure in the vacuum chamber at the same temperature. This indicates that the sublimation of Fe and Si elements is suppressed at the temperature ≤1000 °C, and Mn element is the main sublimation source to contribute to the weight loss of the sintered BE samples at 1000 °C. Furthermore, the calculated vapor pressure of Mn at 700, 800, and 900 °C is 8.86 × 10⁻⁴, 2.08 × 10⁻², and 0.28 Pa. This suggests that the sublimation of Mn in its element form starts at a temperature between 700 and 800 °C. However, the sublimation rate of Mn is very difficult to determine during the temperature ramp due to the uncertain ratio of Mn in elemental form. In the future, in situ high temperature phase identification such as neutron diffraction and synchrotron techniques may be useful to identify the ratio of the possible phases in the compacts during temperature ramp stage.
XRD patterns recorded at the center of the sample cross-section (≥LD) of the sintered ternary Fe–28Mn–3Si alloys with no isothermal holding. (a) MM compact sintered at 1000 °C, (b) BE compact sintered at 1100 °C.

C. Effect of open porosity on the weight loss
Figure 5 demonstrates that the weight loss of MM alloys is much less than their BE counterparts sintered at the same temperature. The lower weight loss caused by a less Mn sublimation may be a combined consequence of the lower open porosities in the sintered MM alloys and reduced free surface areas for the Mn powder particles in the MM powder mixtures.
Mechanical milling (MM) makes great contribution to pore elimination during sintering as MM effectively refines particle size. This is evidenced by Fig. 3. Smaller particles provide larger driving force to promote the pore elimination as a result of the higher surface energy of the MM powder mixture. Reference German21 Therefore, the open porosity of MM alloys is significantly lower than their BE counterparts sintered at the same temperature.
As discussed in Sec. V. B, the sublimation rate of Mn in the ternary Fe–Mn–Si system is dominant over that of Fe and Si. Therefore, we only discuss the sublimation of Mn in this section.
Open pores are regarded as flowing channel to transform the Mn vapor from the interior area of the compacts to the vacuum chamber due to the concentration gradient of Mn vapor, as discussed in Sec. V. B.
The BE alloys present a higher open porosities compared to their MM counterparts. This is supported by both Fig. 13 and the SEM micrographs shown in Fig. 17. The higher open porosities in the BE alloys provide both larger areas of solid–gas interface and more flowing channel to accelerate the sublimation of Mn on the walls of open pores in the ternary Fe–Mn–Si compacts. Consequently, the weight loss of Mn is significantly faster in the BE compacts than their MM compacts sintered at the same temperature.
SEM micrographs of the Fe–Mn–Si compacts sintered for 3 h: (a) BE alloy at 1100 °C, (b) BE alloy at 1200 °C, (c) MM alloy at 1100 °C, (d) MM alloy at 1200 °C.

In addition, reduced surface exposure areas for the Mn powder particles in the MM powder mixtures may also contribute to the lower Mn sublimation rate in the MM alloys. During mechanical milling, the brittle Mn particles are embedded in ductile Fe matrix. Reference Suryanarayana22 This leads to reduced surface areas for the Mn particles in the MM powder mixtures. Thus, the sublimation sites for Mn particles decrease due to less surface areas of Mn particles directly exposed to the vacuum environment during sintering. Consequently, the Mn sublimation rate of the MM alloys is smaller than their BE counterparts.
D. Formation mechanism of LD region
As shown in Table II and Fig. 8, LD region exhibits in all the sintered Fe–Mn–Si compacts. However, the length of the LD region is various depending on the sintering temperature and open porosities.
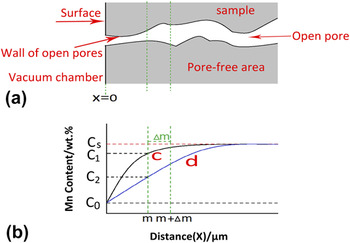
To illustrate the effects of sintering temperature and open porosity on the formation of LD region, a model is sketched, as shown in Fig. 18. In the pore-free area of the ternary Fe–Mn–Si compacts, the sublimation of an element only occurs on the surface (x = 0) of the compacts directly exposed to the vacuum chamber. The sublimation of Mn on the surface (x = 0) results in the formation of Mn concentration gradient in the Fe–Mn–Si compacts. Consequently, the LD region forms in the sintered alloys, as a function of holding time t [Curve c in Fig. 18 (b)].
The formation mechanism of LD in the sintered Fe–Mn–Si alloys as a function of distance (x) from the surface at a certain isothermal time t (the beginning time of isothermal holding < t < the terminal time of isothermal holding, the total isothermal holding time is 3 h) during isothermal holding. (a) is the cross-sectional sketch of the porous Fe–Mn–Si compacts; (b) shows the change of Mn concentration as a function of distance from the surface of the porous Fe–Mn–Si compacts at a certain isothermal holding time t, Curve c and d in (b) shows the change of Mn concentration of the sintered Fe–Mn–Si compacts in the pore-free area and open pore area at a certain isothermal holding time t, respectively. C0 is the Mn concentration on the surface (x = 0) at the beginning of the isothermal holding stage, C 1 and C 2 is the Mn concentration of the compacts in pore-free area and open pore area at a distance from the surface x = m at a certain isothermal holding time t, respectively. C s is the initial Mn concentration (∼28 wt%) without sublimation of Mn.

As shown in Fig. 15, the sublimation rate of Mn on the surface (x = 0) in both the BE and MM compacts increases with the increase of sintering temperature. Moreover, the rise of sintering temperature remarkably increases the diffusivity of Mn atoms in the Fe–Mn–Si alloys based on Arrhenius equation. Reference German21 In other words, the increase of sintering temperature leads to more Mn atoms diffusing from the interior region (x > 0) to the surface (x = 0). Consequently, the increase of sintering temperature results in the increase of LD region in pore-free areas due to the significant increase of Mn sublimation rate on the surface (x = 0) and the diffusivity of Mn atoms.
In addition to that, the open pores affect the LD as well. As discussed in Sec. V. B, the open pores significantly accelerate the sublimation of Mn due to the extra area of the interface created by walls of open pores. When the distance from the surface is x = m (0 < m < LD) in the sintered alloys, the Mn concentration [Curve c in Fig. 18(b)] in the Fe–Mn–Si compacts is only determined by temperature-induced sublimation of Mn on the surface (x = 0) if no pores exist in the compacts. However, if open pores exist in the compacts, Mn sublimates on the walls of the open pores, and exits into the vacuum chamber via the open pores. Consequently, Mn concentration (C 2) at the position x (x = m, 0 < m ≤ LD) on the walls of the open pores is lower than that (C 1) in the pore-free alloys at the same position and isothermal holding time t. In this case, the slope of the curve-d at the position x = m is higher than the curve-c at the same position, as illustrated in Fig. 18(b). Thus, a higher Mn concentration gradient forms in the porous compacts at position x = m compared to the pore-free compacts at the same position and isothermal holding time t. This accelerates the diffusion of Mn atoms at the position x = m. In our case, the BE compacts presents much higher open porosities, compared to their MM counterparts. The higher porosities in BE compacts provide more sites to form curve-d shown in Fig. 18(b). This accelerates the formation of LD region. Thus, the length of LD region in BE alloys is much longer than their MM counterparts sintering for 3 h at the same temperature. Interestingly, the XRD results imply that a single α-Fe phase (see Fig. 12) forms on the top surface of the LD region in all the sintered alloys. This is due to a severe sublimation of Mn on the surface (x = 0). The EDS results shown in Table II demonstrate that Mn concentration on the surface (x = 0) is less than 1.3 wt%. This composition corresponds to a typical α-Fe phase based on ternary phase diagram of Fe–Mn–Si alloy, Reference Zheng, Lu, He, Cui and Li23 which further confirms the XRD results.
It is noted that the Mn concentration in all the sintered compacts stabilizes at ∼27 wt% when the distance from the surface is larger than LD. In other words, the Mn concentration in the sintered compacts is only ∼1 wt% lower than the nominal composition (28 wt%) in the green compacts. This reveals that the sublimation of Mn in the sintered alloys at distance larger than LD is very limited. This is caused by a stable Mn equilibrium partial pressure due to a homogeneous Mn concentration (27 wt%) at the region beyond LD. The stable equilibrium partial pressure of Mn in the open pores means that no concentration gradient of Mn partial pressure exists in the open pores. This suppresses the sublimation of Mn at the locations ≥LD in the Fe–Mn–Si compacts. Consequently, the Mn concentration in the positions with distance larger than LD was stable at ∼27 wt%. This composition corresponds to γ-austenite based on the XRD results (Fig. 10) and the phase diagram of the ternary Fe–Mn–Si alloys. Reference Raghavan24
VI. CONCLUSIONS
This work investigated the effects of sintering temperature and mechanical milling (MM) on the sublimation behavior of the sintered Fe–28Mn–3Si powder compacts. The key results of this study are summarized below.
-
(1) The phase on the surface (x = 0) of the sintered compacts is α-Fe. The predominant phase for all the sintered alloys is γ-austenite. A small amount of Mn3Si phase is identified in the sintered BE Fe–Mn–Si compacts at 1000 °C.
-
(2) The open porosities of the BE alloys are significantly higher than their MM counterparts. The open porosities of the BE alloys ranges from 33.5 to 29% depending on the sintering temperature, while that of the MM alloys reduce remarkably from 25% at 1000 °C to 7.6% at 1200 °C.
-
(3) The weight loss of all the sintered compacts is mainly caused by the sublimation of Mn. The weight loss of all the sintered alloys increases significantly with the increase of sintering temperature. The weight loss of the MM alloys is much lower than their BE counterparts.
-
(4) The Mn concentration gradually increases with the increase of the distance from the surface until it stabilizes at ∼27 wt% when the distance from the surface is ≥LD. The length of the LD in the sintered alloys depends on a combined consequence of the sintering temperature and the characteristics of the powder mixtures. The LD increases significantly with the increase of sintering temperature. The LD of the MM alloys is much shorter than their BE counterparts.
ACKNOWLEDGMENTS
China Scholarship Council (CSC) is acknowledged for providing a doctoral scholarship to Zhigang Xu to study his PhD at the University of Auckland. Thanks Keke Chang from Materials Chemistry at RWTH Aachen University in Germany, for his assistance to thermodynamic calculation.