1. Introduction
The main goal of most public pension reforms implemented in many countries over the last decades has been to improve government finances in the long run. They are a policy response to population ageing, which will increase problems of fiscal sustainability of welfare states. Most pension reforms have been designed to strengthen government finances by encouraging employment, and thereby tax revenues, in order to mitigate unpopular benefit cuts.Footnote 1 In particular, a key objective has been to increase the effective retirement age. At the same time, the reforms have typically tried to maintain much of the redistributive effects built into the former public pension systems. These goals and concerns also characterize the Norwegian pension reform implemented in 2011. The purpose of this paper is to assess as realistically as possible to what extent the Norwegian reform is likely to improve government finances in the long run.
A long run perspective on the fiscal reform effects is particularly relevant for Norway, because the government finances look impressively solid in a short and medium-term perspective, as opposed to most other OECD economies. This reflects the fiscal rule implemented in 2001, which implies that the large government petroleum revenues are saved in a sovereign wealth fund. The fund assets passed 2.3 times GDP by the end of 2014. However, the projections in this paper show that also Norway faces severe fiscal sustainability problems in the long run, since ageing combined with prolongation of the present welfare schemes implies that government expenditures will outgrow the tax bases after 2025.Footnote 2 At the same time, the solid government finances have allowed Norway to emphasize the long run properties of the new public pension system to a stronger degree than countries already struggling with strained government finances.
A profound analysis of pension reforms is a demanding modelling task because it should integrate three types of effects.Footnote 3 First, huge amounts of details are required to provide an operational and relevant description of the reform elements, such as e.g., threshold values, coordination with occupational private pension schemes, special arrangements for low-income groups, temporary rules phased out during transition periods and other exceptions from main principles. In addition the model should capture the heterogeneity of individual earning profiles and other aspects of individual life courses. Such details are not only important for the re-distributional properties of the system, but also for accurate computations of the aggregate public pension expenditures. Dynamic Microsimulation (DMS) models provide such details, which make them frequently used by the authorities to compute effects on individual benefits and public pension expenditures. Flood (Reference Flood, Harding and Gupta2007), Morrison (Reference Morrison, Harding and Gupta2007), Blanchet and Minez (Reference Blanchet, Minez, Zaidi, Harding and Williamson2009) and Leombruni and Mosca (Reference Leombruni, Mosca, Dekkers, Keegan and O'Donoghue2014) are but a few examples of studies using DMS models to estimate mechanical pension reform effects. Norwegian studies in this tradition include Fredriksen and Stølen (Reference Fredriksen, Stølen, Harding and Gupta2007, Reference Fredriksen and Stølen2011 and Reference Fredriksen, Stølen, Dekkers, Keegan and O'Donoghue2014). The Norwegian authorities have also used DMS models in the reform preparations. This practice seems to be an exception compared with pension reform preparations in other countries.
Second, realistic estimates should capture that pension reforms indeed intend to affect behaviour, notably labour supply. A vast empirical literature has studied how pension schemes affect labour supply, especially through retirement; see Gruber and Wise (Reference Gruber and Wise2004) for a comprehensive overview. In their summary of 12 comparable microeconometric country studies, Gruber and Wise conclude that the pension system has a ‘strong effect on retirement’. Possible effects on labour supply are therefore also included in several of the DMS models in addition to the mechanical effects. This is also the case for the Norwegian DMS-analyses mentioned above. Analyses of observed patterns in the first years after the Norwegian pension reform confirm significant reform effects on the age of retirement; see Hernæs et al. (Reference Hernæs, Markussen, Piggott and Røed2016).
Third, the mechanical and the behavioural responses to plausible pension reforms are likely to be strong enough to cause significant general equilibrium repercussions in a long run perspective, motivating the use of Computable General Equilibrium (CGE) models in pension reform analyses. A good illustration of the potential power of equilibrium effects is Coile and Gruber (Reference Coile and Gruber2003). Their estimated effects on the budget deficit of a US Social Security reform reflect just the expansion of tax bases, whereas actuarial mechanisms leave expenditures almost unaffected. In a study of a Norwegian pension reform proposal, also Holmøy and Stensnes (Reference Holmøy and Stensnes2008) find a stronger fiscal contribution from expansion of tax bases than from lower pension expenditures. Beetsma et al. (Reference Beetsma, Bettendorf and Broer2003) and Bovenberg and Knaap (Reference Bovenberg and Knaap2005) use CGE models with overlapping generations (OLG) in the tradition pioneered by Auerbach and Kotlikoff (Reference Auerbach and Kotlikoff1987) to assess budget and economic consequences of stylized pension reforms in the Netherlands. Fehr (Reference Fehr2009) surveys the use of stochastic CGE models in analyses of population ageing and pension reforms. Relatively recent topics in this literature include the transition between steady states, uncertainty and risk sharing, social efficiency effects, as well as inter- and intra-generational income distribution effects. Papers addressing these issues include e.g., Conesa and Krueger (Reference Conesa and Krueger1999), Krueger and Kubler (Reference Krueger and Kubler2006), Nishiyama and Smetters (Reference Nishiyama and Smetters2007), Fehr and Habermann (Reference Fehr and Habermann2008), Harenberg and Ludwig (Reference Harenberg and Ludwig2014). Fehr et al. (Reference Fehr, Habermann and Kindermann2008) introduce hyperbolic discounting in an analysis of the welfare effects of the German social security system. Hirte (Reference Hirte2002) introduced optimal retirement in an OLG model. Such behaviour is also included in the analyses of stylized pension reforms in Eisensee (Reference Eisensee2006), Fehr et al. (Reference Fehr, Kallweit and Kindermann2012) and Imrohoroglu and Kitao (Reference Imrohoroglu and Kitao2012), as well as in the studies of Spanish pension reform in Díaz-Giménez and Díaz-Saavedra (Reference Díaz-Giménez and Díaz-Saavedra2009) and Sánchez Martín (Reference Sánchez Martín2010). Imrohoroglu and Kitao (Reference Imrohoroglu and Kitao2012) introduce both optimal retirement and benefit claiming in a dynamic stochastic OLG-CGE model of the US economy. Galaasen (Reference Galaasen2014a, Reference Galaasenb) uses the same modelling approach in a study of the Norwegian pension reform of 2011.
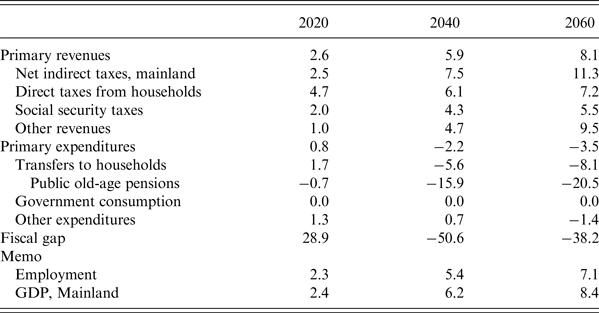
This study of the fiscal effects of the Norwegian pension reform of 2011 takes the three abovementioned types of effects into account by combining a detailed DMS model with a CGE model.Footnote 4 Since our DMS model captures all details in the former and the new pension system, as well as an almost complete representation of the relevant population heterogeneity, we are able to produce more accurate estimates of the public pension expenditures than pure CGE analyses, contingent on individual age-earnings profiles. Whereas most of the papers referred to above study stylized reforms, the ability to account for details allows us to address the effects of an actual pension reform. Our CGE model is designed to capture those mechanisms that are most important in analyses of long run fiscal effects. In particular, it provides a rather detailed determination of the bases for direct taxes levied on households and the business sector, as well as indirect taxes. Our paper shares the same main purpose and approach as Holmøy and Stensnes (Reference Holmøy and Stensnes2008), but differs from the latter and other previous Norwegian reform studies by analysing the implemented reform rather than reform proposals, by providing another set of sensitivity analyses, and by considering other mechanisms for neutralizing the fiscal reform effects through tax adjustments. As in Holmøy and Stensnes (Reference Holmøy and Stensnes2008), changes in government revenues through adjustments of the bases of indirect and business taxes, are the most important general equilibrium effects included in the present analysis. From Table 3 it is evident that the percentage reform effects deviate quite a lot between different income components and a CGE model is necessary to capture these effects properly.
The paper is organised as follows: Section 2 provides a brief overview of the main elements of the present Norwegian pension system and the implemented reform. Section 3 describes the microsimulation and the CGE models. Section 4 discusses the effects of the reform on total employment. Section 5 discusses the overall reform effects on government finances. Section 6 analyses the robustness of the reform effects with respect to assumptions on longevity, labour supply responses, withdrawal of benefits, and the degree of protecting the former disabled old-age pensioners from the actuarial mechanisms built into the new pension system. Section 7 concludes.
2. The Norwegian public pension reform
2.1. The former system
The old National Insurance System was established in 1967. Over time this public pension system has developed as a mandatory, defined benefit, pay-as-you-go pension system. Christensen et al. (Reference Christensen, Fredriksen, Lien, Stølen, Holzmann, Palmer and Robalino2012) and Fredriksen and Stølen (Reference Fredriksen, Stølen, Dekkers, Keegan and O'Donoghue2014) describe its main elements. Although the new system was implemented in 2011, the accrual of entitlements is still entirely based on the rules from the old system for new cohorts of pensioners born up to 1953. The new rules for accrual of entitlements will gradually be phased in for cohorts born between 1954 and 1963. In the old system the accrual of entitlements for old-age benefits were determined according to the formula:
 $${\rm Pension}\;{\rm benefit = universal}\;{\rm benefit}\;{\rm +} \;{\rm max(special}\;{\rm supplement,}\;{\rm income}\;{\rm benefit)}{\rm.} $$
The income benefit is based on pension entitlements accrued through labour market earnings after 1967. In addition, imputed pension entitlements are granted to parents caring for young children and recipients of social security benefits compensating for unemployment, sickness, rehabilitation, and disability. Both entitlements and benefits have in principle been wage indexed, although practice in past periods has tended to fall somewhat short of this intention. In the stylised case where an individual earns the average wage for 40 years, the after-tax replacement ratio of the public old age benefit is about 65%.Footnote 5
Some of the elements for accrual of pension entitlements according to the old system are made more actuarial after the reform. Most important is full accumulation of entitlements between the average wage level and 115% of this level with the new system against only 1/3 with the old. There is also some contribution from the abolishment of the rule according to which a full benefit requires 40 years of accumulation, and the best-years rule saying that entitlements will only be calculated using the 20 years with highest earnings. On average, these non-linear elements resulted in a relatively weak income dependency of pension benefits with the old system. Simulations with the microsimulation model used in this paper, show that the new system for accrual of entitlements at average reduces the overall marginal tax rate on labour incomes by 15.7 percentage points with the new system against 10 percentage points with the old, see Stensnes (Reference Stensnes2007). Moreover, this income dependency is hard to compute ex ante, and varies highly across individuals, which probably weakens the labour supply incentive of the income dependency.
With the former system the formal retirement age was 67 years up to 2010. But about 60% of the (still) employed at the age of 62 were entitled to an early retirement from this age. In addition roughly 40% of the population received disability benefits at the age of 67. Disability pension and early retirement thus imply that the present effective retirement age has averaged about 60 years in Norway. Note that early retirement through these arrangements did not reduce future pension benefits at any point in time with the old system, neither because of a shorter period of labour market earnings nor through a longer period as pensioner. Both disability pensioners and early retirees obtained entitlements as if they remained working until the age of 67.
2.2. Key reform elements
Except for the rules for accumulation of entitlements, the main elements of the new system were implemented from 2011. In addition to the general description of the pension system in Christensen et al. (Reference Christensen, Fredriksen, Lien, Stølen, Holzmann, Palmer and Robalino2012) and Fredriksen and Stølen (Reference Fredriksen, Stølen, Dekkers, Keegan and O'Donoghue2014), the new system is described in more detail in Fredriksen and Stølen (Reference Fredriksen and Stølen2011). The new system continues to be a defined benefit system financed on a pay-as-you-go basis. The reform is designed to reduce the long run growth in future government pension expenditures and to stimulate labour supply, maintaining most of the distributional properties of the old system. The most important reform elements are:
1. The pension benefit continues to include two components, a minimum income guarantee and an earnings-based benefit. At implementation the minimum benefit was maintained at the same level as in the old system. Contrary to the former system, where the special supplement was means-tested by 100% against the income benefit, the means-testing of the guarantee pension is reduced to 80%. The new indexation rules imply that the guarantee benefit is indexed by wage growth adjusted for growth in life expectancy.
2. Most of the expenditure risk associated with increases in longevity is shifted from tax payers onto each cohort of pensioners through an actuarial mechanism. The new system converts the implicit pension wealth of accumulated entitlements into an annuity over the average expected remaining lifetime. An increase in the expected number of retirement years reduces the annual benefit such that the present value of total pension benefits is nearly invariant to changes in current remaining life expectancy and retirement age. This is an implementation of what Lindbeck (Reference Lindbeck2006) identifies as an ‘automatic rule mimicking the functioning of actuarially fair private income insurance systems’.Footnote 6
3. In the private sector the statutory retirement age and former early retirement arrangements were phased out and replaced with a flexible retirement age from the age of 62 years, available to everyone who has accumulated enough entitlements to achieve a greater pension than the minimum pension. The life expectancy adjustment mechanism described in point 2 intends to stimulate labour supply by increasing the individual cost of early retirement. If life expectancy increases by 1 year, an additional 8 months of labour market participation will be needed to maintain the annual benefit.
4. Labour supply is also stimulated by a stronger dependency between earnings and old-age pension benefits. Both the limits of 40 years to obtain maximum benefits and the ‘20 best years count rule’ are abolished. The annual accumulation of entitlements is basically 18.1% of labour incomes below a threshold of approximately 115% of average labour incomes.
5. The income dependent entitlements are indexed by wage growth until retirement. After retirement pension benefits in payments are indexed by an average of wages and consumer prices.Footnote 7
Disability pensioners are transferred to old age pensions at the age of 67. By introducing a weaker life expectancy adjustment for earlier disabled, the reform may strengthen the incentives to retire as a disability pensioner. Our analysis takes the observed rates of transition into disability as given.
An agreement on the intended inclusion of the early retirement scheme in the new actuarial system was obtained for the private sector in the negotiations between the labour market organizations in 2008. However, the same agreement has not achieved in the public sector. Here, the old early retirement scheme has been preserved between ages 62 and 66, whereas the principles from the new actuarial system are implemented from the age of 67 with a guarantee that the replacement rate shall not drop below 66% for cohorts born up to 1958 retiring at that age. Thus, the incentives to delay retirement are weaker for employees in the public sector than in the private sector, and the total effect on labour supply will be somewhat weaker than predicted by the Norwegian Pension Commission (NOU 2004:1).
The cuts in expenditures as a result of the reform are caused by the actuarial life expectancy adjustment, and the less generous indexation of benefits in payment. To the extent that postponed retirement counteracts the reduction of average annual benefits, the fiscal improvement will also be stimulated by increased tax revenues.
3. Modelling framework
Our ambition of providing realistic estimates of the total fiscal effects of a fully specified pension reform imposes four fundamental requirements: First, accounting for system complexity requires an accurate description of most elements in the former and the new pension systems. Specifically, one must account for the complex interplay between minimum guarantees and earnings-dependent pensions. Second, a detailed description of population heterogeneity with respect to age and income is necessary for accurate calculations of individual and aggregate pension entitlements and benefits. In particular, the increasing trend of female labour supply implies a surge in the future old-age entitlements of women. Third, the simulations should take into account that changes in employment affect most non-petroleum tax bases. The main point of using a CGE model is to clarify and quantify how close these tax bases are linked to employment in the business sector. In particular, the CGE model is necessary in order to calculate how changes in employment affect the revenues collected from indirect and business taxation, which amounted to 36% of the non-petroleum primary government revenues in 2013. To our knowledge, microsimulation analyses of pension reform have not been designed to account for effects on revenues from non-personal taxes. Fourth, analyses of fiscal effects of pension reform require a long-run perspective, both because they address long run demographic changes and because the relevance of many behavioural and equilibrium effects is stronger in the long run. The integrated micro–macro model framework used in this paper is designed to meet these requirements. Admittedly, it is complex, but a more simple and transparent model framework would necessarily produce less realistic estimates.
3.1. The DMS model
Tax and pension systems are typically detailed and complex and individuals may face different rules. Accordingly, there are substantial aggregation problems when calculating the total effect on government budgets of changes in tax or pension systems. Microsimulation models overcome these problems; see e.g., Orcutt et al. (Reference Orcutt, Merz and Quinke1986). The basic idea in microsimulation modelling is to represent a socio-economic system by a sample of decision units (e.g., persons), and then model the behaviour of these primary units. Contrary to what is possible in aggregate models, specifying one or a few representative agents, micro simulation models allow an exact description of all details in e.g., the tax and/or the pension system. Such models have become increasingly used over the last decades to support governments with analyses of tax and pension reforms, as well as other policy changes intended to affect the personal incomes of specific groups.
The model used in this paper, MOSART, is a DMS model, which has been developed over several years at Statistics Norway; see Fredriksen (Reference Fredriksen1998) for documentation of an earlier version. MOSART is especially designed to analyse mechanical effects on individual pension entitlements, benefits, and government pension expenditures of changes in the Norwegian public pension system. The model simulates the life courses for the entire Norwegian population. Events, i.e., transitions between states over the life course, depend on individual characteristics, and the transition probabilities have been estimated from observations in a recent period. MOSART emphasizes events that are relevant for individuals’ accumulation of public pension entitlements, including migration, deaths, births, marriages, divorces, educational activities, retirement, and labour force participation. The model includes an accurate description of pension rules and captures all relevant heterogeneity of individual age-earnings profiles.
With the MOSART model it is thus possible to simulate the effect from the pension reform on future old-age benefits for every individual. By summing up we obtain the total effect on government old-age pension expenditures. Compared with more aggregate analyses, microsimulation accounts much more accurately for the heterogeneity of how individuals are affected by the reform. Especially this is the case for effects on labour supply further discussed below. Total direct effects on labour supply and old-age pension expenditures from the microsimulation model are used as exogenous input in the CGE calculations of the effects on all tax revenues, and other variables relevant for the complete fiscal effects. The microsimulation model also computes reform effects on other government cash transfers to households. In particular, we account for changes in the number of disability pensioners and their benefits.
3.2. The CGE model
The value-added of using the CGE model in this paper is to provide consistent and detailed accounts of the changes in government revenues and expenditures, and how the various budget components are affected by changes in employment, old-age pensioners, disability pensioners and other beneficiaries of welfare transfers. The model also captures a multitude of other variables which affect the government finances, including e.g., population ageing, world prices and production of crude oil and natural gas, the return to the financial wealth accumulated in the government pension fund, productivity growth, and the quality of tax financed services. However, variations in the exogenous assumptions about these variables do no basically alter the fiscal effects of a partial pension reform.
The CGE model (DEMEC) portrays the Norwegian economy as a standard small open economy; see Holmøy and Strøm (Reference Holmøy and Strøm2012a, Reference Holmøy and Strømb). All agents face exogenous world prices of exports and imports and an exogenous world interest rate. Goods and factors are perfectly mobile between industries. All production functions exhibit constant returns to scale. Productivity growth is exogenous and labour augmenting in all industries. All markets are perfectly competitive and clear in all periods. These assumptions imply that the prices of primary production factors are determined by world prices and productivity parameters in the industries exposed to competition from foreign producers. Labour is the only primary production factor in the model. Perfect competition implies that producer prices of both traded and non-traded goods equal marginal costs, which equal unit cost due to constant returns to scale. Consequently, in this long run model relative prices are invariant to changes in employment and other variables affected by the pension reform. General equilibrium implies that total employment is determined by labour supply, which is exogenous in DEMEC, but endogenous in MOSART. A section below explains in detail the labour supply responses to the pension reform.
The properties of the CGE model imply that aggregate consumption possibilities are restricted by employment, productivity growth and a national budget constraint on the accumulation of net foreign wealth. We assume that the national financial savings equal the central government financial savings. The financial savings of the central government obeys a strict interpretation of the fiscal rule introduced in 2001. This rule implies: (1) all the cash flow from production of oil and gas collected by the central government are saved in a separate sovereign wealth fund called the Government Pension Fund; (2) the non-petroleum primary deficit equals the expected real rate of return on the assets. We assume this rate to stay constant at 3.5% in our simulation period.Footnote 8 Given the exogenous path of government petroleum revenues, these two implications determine directly the time path of the government budget constraint.Footnote 9
The model does not capture private savings decisions based on intertemporal optimization. The basic assumptions regarding private savings is that the majority of those affected by the pension reform postpone retirement in order to keep the annual benefit at the pre-reform level. However, for our purposes the main job of the CGE model is to calculate the effect on tax bases, especially the bases of all indirect taxes and subsidies, as well as the corporate tax bases. Contrary to taxes on labour income and pension benefits, the revenues from indirect and corporate taxation cannot be determined without a consistent model of the total economy since they depend on the level and composition of the total production. The revenues from indirect and business taxation amounted to 36% of the non-petroleum primary government revenues in 2013. Including the payroll tax, this share becomes 54%.Footnote 10 We have given priority to account for the constraints on these tax bases implied by (i) the government employment share (there are no indirect nor corporate taxes on government production), (ii) the industry specific production functions, and (iii) the net imports consistent with long run external balance. Compared with these constraints, changes in the time profile of aggregate private consumption, caused by adjustments of individual savings, are likely to be of modest importance.
We assume that the government budget constraint is met by endogenous pay-as-you-go adjustments of a lump-sum tax/transfer. This assumption is of course not made for the sake of realism. It is justified for two reasons. First, endogenous lump-sum tax adjustments make the pure reform effects most transparent, and these effects are the main issue of this paper. Endogenous adjustments of other tax rates would affect tax bases and government expenditures through equilibrium effects on relative prices. These effects would be hard to distinguish from the pure pension reform effects. Second, any selection of endogenous tax rates would be somewhat arbitrary, and we would risk that our analyses would stimulate discussions about tax reforms rather than the pension reform.
3.3. Key assumptions
The projections of pension entitlements and benefits are based on detailed information for the entire Norwegian population up to 2010 and adjustments based on aggregate observations up to 2013. Most transition probabilities in MOSART are based on observed averages from 2008 to 2012. The CGE model is calibrated to the National Accounts of 2010, and the course of the main macroeconomic aggregates are in line with observations till 2013.
The demographic projections are taken from the official projections; see Statistics Norway (2014) and Tønnessen et al. (Reference Tønnessen, Syse and Aase2014). Statistics Norway considers the medium alternatives with respect to assumptions on fertility, mortality and migration to be most realistic. These assumptions imply that the number of those aged 20–66 divided by the number of those 67 and older decrease from 4.8 in 2010 to 2.5 in 2060. The baby boom after World War II contributes to the strong decrease in this ratio in the nearest decades, whereas increased longevity drives the long run reduction. From 2013 till 2060 the life expectancy of new-borns increases by 6.9 years for men and 5.6 years for women. For the effects of the pension reform, the conditional remaining expected life expectancy at the age 62 is particularly relevant. From 2013 till 2060 the increases for men and women are, respectively, 5.7 and 4.3 years. The increase in the old-age dependency ratio is somewhat mitigated by immigration, which has been much higher after 2004 than in earlier years.
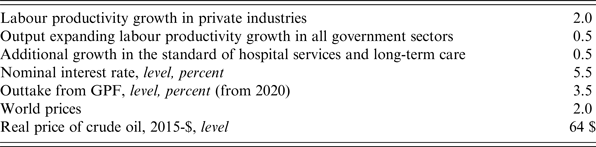
Except from effects caused by the pension reform, we assume that both average future participation rates and working hours remain at their present levels in all population groups defined by gender, age and education. An increase in the average education levels contributes to a modest growth in participation and working hours over the simulation period. Except for the public old age pension system, the present welfare schemes, including wage indexation of most welfare transfers, are prolonged in all scenarios. Resources used in sectors producing public goods remain constant at present per capita levels. For tax financed production of individual services (child care, education, health services, and long-term care) we prolong the most recent observations of the gender and age specific ratios of users per capita, whereas the corresponding service standards (=resources per user) are raised by 0.5% per year. The development of the world prices and production of crude oil and natural gas, as well as the government petroleum revenues are in line with the assumptions in the ‘Perspectives report 2013’ (Ministry of Finance, 2013). The decline in these revenues is assumed to be relatively strong over the next decades as the most profitable oil and gas resources are depleted. This implies a gradual slowdown of the 4% annual outtake from the Government Pension Fund. Table 1 summarizes other key macroeconomic assumptions. As noted above, government finances depend crucially on these assumptions, especially on those which determine the demographic dependency ratio, government petroleum revenues and the return to the savings in the Government Pension Fund, the standard of health services, long-term care and other tax financed services. However, although changes in these assumptions affect the fiscal motivation for pension reform, the partial fiscal effects of the reform is not basically altered by fiscal stance in the non-reform scenario. The key implications of the exogenous assumptions are explained below in a separate section on the non-reform scenario.
Key macroeconomic assumptions. Average annual growth rates unless otherwise indicated

Percent. Source: Authors’ assumptions.
4. Employment effects
Three kinds of employment effects may be expected as a consequence of the reform:
1. Effects on working hours prior to retirement age caused by a closer connection between pension entitlements and former earnings with the new system
2. Immediate effects on retirement
3. Postponed retirement when life expectancy increases
4.1. Effects on working-hours
Changes in the system of accrual of pension entitlements create a closer connection between pension entitlements and former earnings with the new system.
• The rule making entitlements dependent on the 20 years with highest labour incomes is abolished.
• While 40 years of accumulation were necessary to achieve full pensions with the old system, labour incomes for more than 40 years may increase entitlements with the new.
• While yearly incomes smaller than 1 BPU (Basic Pension Unit, equal to 1/6 of average annual labour incomes) do not produce any extra entitlements with the old model of accumulation, even small incomes count with the new system.
• With the old system incomes between 6 BPU (equal to average annual labour incomes) and 12 BPU only produced 1/3 of full entitlements. With the new system full entitlements are accumulated up to yearly incomes of 7.1 BPU. Far more persons are in the interval 6 to 7.1 BPU than above.
• With the old system the special supplement for persons with low pension entitlements is means-tested with 100% against income pensions. With the new system the means-testing of the guarantee pension against income pensions is reduced to 80%.
Stensnes (Reference Stensnes2007) estimated the labour supply incentives at the intensive margin in the old and the new system. According to his estimates the reform implies that 1 NOK extra labour market earnings raises the present value of future pension benefits from 0.101 NOK to 0.157 NOK, on average. This corresponds to a 5.1% increase in the perceived effective wage rate. We consider this estimate as cautious, because it does not take into account that individual income dependency becomes more transparent and more similar between individuals in the new system. With a compensated labour supply elasticity of 0.5, the shift to the new pension system increases working hours prior to retirement by 2.5%.
4.2. Effects on retirement
Several studies find that labour supply is more elastic on the extensive than on the intensive margin, see e.g., Heckman (Reference Heckman1993), Gruber and Wise (Reference Gruber and Wise2004), Chan and Stevens (Reference Chan and Stevens2003) and Immervoll et al. (Reference Immervoll, Kleven, Kreiner and Saez2007).Footnote 11 Through microsimulation we also account for heterogeneous retirement behaviour. One example is that individuals with high level of education will retire later than those with low education.
In the first econometric study of the effects of the Norwegian pension reform on retirement, also Hernæs et al. (Reference Hernæs, Markussen, Piggott and Røed2016) find that the reform has a significant positive immediate effect on labour supply for 63-years old workers in the private sector with access to the former early retirement scheme. The analysis compares the 1946–1947 birth cohorts, who reached 63 years in the two years prior with the reform in 2010–2011, with the 1949 cohort who reached 63 in 2012. The results are in accordance with previous analyses by Hernæs and Jia (Reference Hernæs and Jia2013) of the effects from the stepwise removal of the earnings test in the Norwegian public pension system for ages 67–69 over the period 2008–2010.
In their analyses Hernæs et al., exploit that different groups of employees are affected in completely different ways by the reform. They divide the employees in three main groups:
(i) Employees in the public sector who all have access to the former early retirement scheme (AFP)
(ii) Employees in the private sector with access to AFP
(iii) Employees in the private sector with no access to AFP, including self employed
Each of the three groups are further divided into two sub-groups dependent on whether the actual persons after the reform have accumulated enough entitlements to withdraw pensions at age 62 or not. Below the age of 67 withdrawal of pensions (and thereby retirement in reality) is not allowed if calculated old-age pensions are smaller than the minimum pension in the National Insurance System. In the private sector some persons entitled to AFP lost their right to retire early as a consequence of the reform because they have not accumulated enough entitlements at age 62. Hernæs et al., find a significant increase in employment and labour market earnings at age 63 for this group. This is also the case for the main group of employees with AFP in private sector with enough entitlements to withdraw pensions at age 62. For this group the new system means a complete removal of the confiscatory earnings test with the old system, implying a cut in AFP-pensions corresponding to labour earnings.
Because the old system for AFP is maintained in the public sector, the reform implies no changes in either access age or work incentives between age 62 and 67. However, Hernæs et al. (Reference Hernæs, Markussen, Piggott and Røed2016) find a small significant effect on employment and labour earnings for persons in this group with enough entitlements to obtain social security pensions at age 62. Their interpretation of the finding is that some employees find it more attractive to continue in employment because it is also possible for employees in the public sector to combine employment with early pay-out from the social security pension. Employees in the private sector with no access to AFP, but with enough entitlements to retire at age 62, experience a reduction in access age as a result of the reform. Hernæs et al. (Reference Hernæs, Markussen, Piggott and Røed2016) find that this group has a small, but significant, reduction in their employment and labour earnings as a result of the reform.
Although estimated parameters from empirical analyses like Hernæs et al., are taken into account in the implementation of transition probabilities in MOSART, it is difficult to establish a direct link. Transition probabilities for retirement are dependent on age, gender and by cohort via level of education and former earnings. The recent empirical results are quite in accordance with earlier assumptions of the effects implemented in the model. As a simplified illustration for the short-term effects on retirement a couple of years after the reform, the total effect may be constructed by weighing together plausible effects for the three main groups mention above.
For about 30% of the employees in the private sector entitled to the early retirement scheme Fredriksen and Stølen (Reference Fredriksen, Stølen, Harding and Gupta2007) assumed that they would delay retirement by 1.2 years as an immediate effect of the reform. This is in accordance with Brinch et al. (Reference Brinch, Hernæs and Strøm2001) who estimated that a hypothetical switch from the retirement incentives in the old system to those implied by a perfectly actuarial system, would delay retirement by 2.4 years on average. An assumed effect of only one half of this implies that participation rates for the age groups 62–66 as an immediate effect of the reform could increase to about the average of the rates observed in 2010 and those observed in the early 1980s, when no early retirement schemes had been introduced. For about the 30% of the employees in the public sector the direct effect on participation rates for the group 62–66 obviously could expected to be small when it was decided to maintain the old early retirement scheme. Because the reform implied a reduction of the minimum retirement age from 67 to 62 for the about 40% of the employees in the private sector not entitled to the earlier retirement scheme, the empirical results by Hernæs et al. (Reference Hernæs, Markussen, Piggott and Røed2016) are quite in accordance with the earlier assumptions that the reform could reduce average retirement for this group by 0.3 years. An average immediate effect on retirement age, i.e., neglecting effects of increased life expectancy, may then be weighted to: 0.3 × 1.2 years + 0.3 × 0 years + 0.4 × (−0.3 years) = 0.24 years. This is somewhat lower than assumed in earlier analyses, e.g., Holmøy and Stensnes (Reference Holmøy and Stensnes2008) based on the assumption that the early retirement scheme in the public sector would be incorporated in the new system.
Increasing life expectancy was likely to have only a negligible effect on retirement with the old system, since the annual benefit was independent of the number of years as a pensioner. With the new actuarial system increased life expectancy is likely to increase the retirement age through consumption smoothing, see e.g., Bloom et al. (Reference Bloom, Canning and Moore2004). The optimal response is then to trade some of the leisure increment for consumption, and postponing retirement is a probable response.
A relatively long period of observations after the reform is necessary to make empirical analyses of the effects from increased longevity on retirement age. About 40% of the individuals will be unaffected by the changes in the early retirement incentives, since they are disabled before the age of 62. Earlier disabled will be transferred to old age pensions at the age of 67. Disabled individuals cannot counteract the negative benefit effect of the life expectancy adjustment by extending their working career. The government has found it fair that the earlier disabled to some extent should be protected from the default life expectancy adjustment mechanism with the new system; the benefit cut implied by this mechanism is therefore reduced by 50% for the former disabled old-aged pensioners.
Also when estimating possible effects from increased longevity on average retirement age, it is relevant to take into account that different groups may be affected differently. For those who work until they become old-age pensioners, we assume that 20% is so healthy that their delay of retirement equals the increase in life expectancy. For the remaining share of 50% working in the private sector Fredriksen and Stølen (Reference Fredriksen, Stølen, Harding and Gupta2007) and Holmøy and Stensnes (Reference Holmøy and Stensnes2008) assumed a delay of retirement equal to 2/3 of the increase in life expectancy. This response neutralizes the benefit cut caused by the life expectancy adjustment mechanism. While assuming a minor response for the 30% working in the public sector, in sum these responses implies a 0.5 years delay of retirement for each year life expectancy increases (0.5 × 2/3 + 0.2 × 1 + 0.3 × 0 = 0.5). Because of the preservation of the old early retirement system in the public sector, also this estimate is reduced compared to earlier analyses.
4.3. Total employment effects
From 2013 to 2060 the average conditional remaining life expectancy for men and women of 62 years is expected to increase by about 5 years from 22.8 to 27.6 years. Adding the immediate reform effect on retirement of 0.24 years and the effect which increases with remaining life expectancy, implies that the average reform effect in 2060 equals 0.24 + 0.5 × 5 = 2.74 years for those who are not disabled at the age of 62. Also taking into account the positive effect on participation rate for persons younger than 62, we estimate the direct reform effect on the labour force in 2060 to 185,000 persons, or 5.5%. Including the effect on average working hours at the intensive margin gives a total effect on man-hours in 2060 of 7.1% compared with the no-reform scenario.
5. Fiscal effects
We measure the fiscal effect by a normalized fiscal gap, defined as the deviation between the simulated government budget deficit and the deficit consistent with the fiscal rule. This gap is measured in current prices, and hard to interpret unless it is normalized. We normalize the gap by calculating its share of the simulated path for the current value of GDP for the mainland sector of the Norwegian economy, hereafter called GDP-M.Footnote 12 This normalized fiscal gap has proved to be the most frequently used indicator of the fiscal stance in the Norwegian policy debate.
5.1. A no-reform baseline scenario
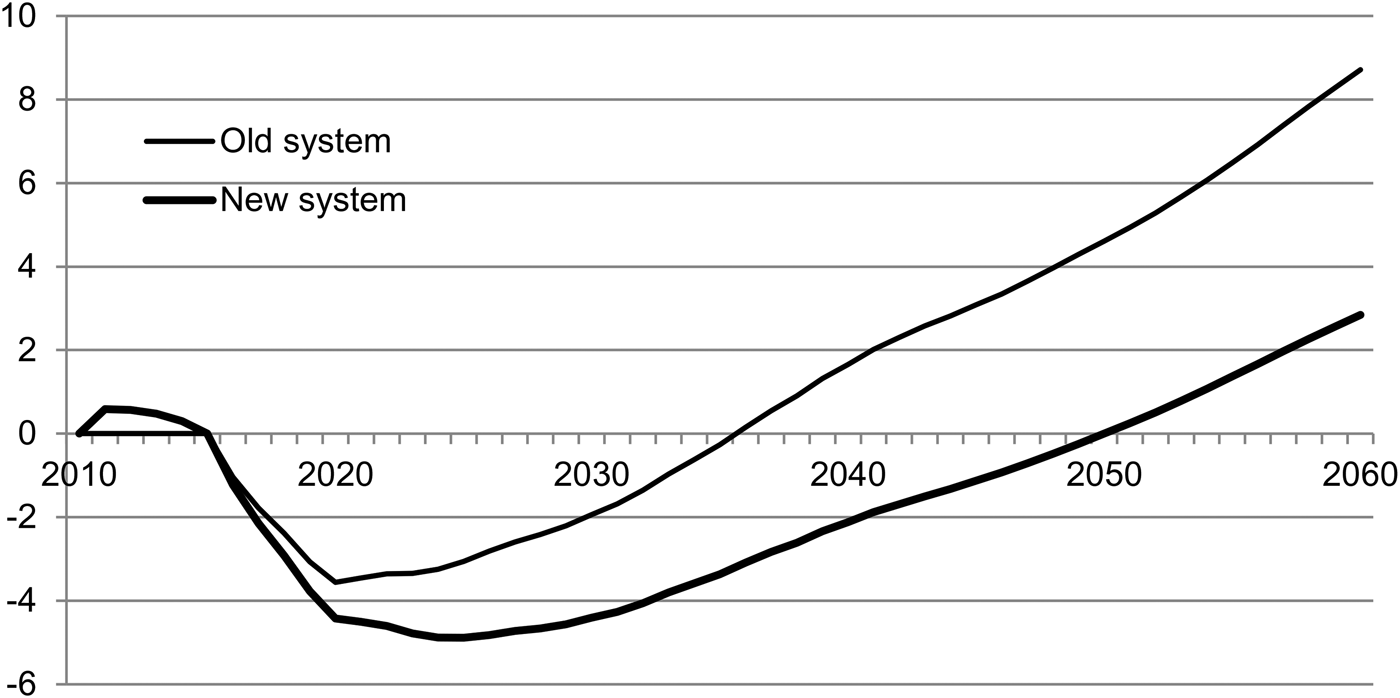
Figure 1 shows the projected normalized fiscal gap in the no-reform and the reform scenario. In all but the first 3 years after the implementation of the new system, the two gap scenarios are basically identical until 2020. In this period the fiscal rule allows successive cuts in tax rates and/or increases in government spending under our assumptions. In 2020 the possible reduction in government net revenues would amount to 3.6% of the projected mainland GDP in this year, if the old pension system were maintained. However, after 2020 the no-reform scenario shows a continuous need for reversing the decrease in government net revenues. After 2035 the fiscal gap becomes positive, passing 8.7% of the projected mainland GDP in 2060.
Simulated fiscal gap with the old and the new public pension system, 2010–2060. Percent of GDP for the mainland economy. Source: Authors’ calculations with the MOSART and DEMEC models.

There are two key forces behind this fiscal gap dynamics. First, the adverse fiscal effect of ageing becomes significantly stronger when the growth in the population share of individuals of age 80 or more accelerates after 2020, since the use of tax financed health- and long-term care services is much higher for this group than for others. Second, the inflow of government petroleum revenues to the Government Pension Fund diminishes over the next 20 years, which causes a slowdown of the 4% annual outtake from the fund.
The no-reform scenario motivates the question: Does Norway need pension reform or other welfare reforms in order to avoid severe fiscal sustainability problems? Figure 1 may justify both a ‘no’ and a ‘yes’ to this question. A ‘no’ can be justified by considering the level of the fiscal gap, which is negative in all years until 2035. Simultaneously, the fiscal policy rule implies an unprecedented accumulation of financial assets. Thus, judged by the levels of government expenditures and tax bases within a 20–30 years perspective, Norway's fiscal future looks bright. In particular, it looks much brighter than it did when the pension reform process was initiated. Then the real oil price was expected to average less than half of the level assumed in this paper.
On the other hand, Figure 1 also serves as a fiscal motivation for the pension reform if one emphasizes the growth trends after 2020 rather than the levels of government revenues and expenditures in a more or less arbitrarily selected year. Stronger growth in government expenditures than in the tax base after 2020 will eventually undermine the impressive government finances. Sooner or later sustainable government finances require alignment of the growth rates of, respectively, government expenditures and the tax bases. If taxes were cut until 2020 according to Figure 1, unpopular reversals of these cuts would be necessary all subsequent years. No available information suggests that the necessary tax burden would stabilize if the simulation period were extended beyond 2060. One may also criticize both scenarios underlying Figure 1 for underrating the future tax burden. First, they assume prolongation of the present levels of the average working hours despite real growth in consumption possibilities per capita, which implies a break with long run historical trends. Second, assuming 0.5% annual growth in man hours per users of hospital services and long-term care, and no such standard improvements in other individual tax financed services, is cautious compared with historical trends. Many projections of government spending on health services and long-term care assume an income elasticity of health services equal to or greater than unity, see e.g., Acemoglu et al. (Reference Acemoglu, Finkelstein and Notowidigdo2013) and OECD (2013b). The assumptions in the no-reform scenario imply that growing public pension expenditures is the dominant source behind the gap in growth rates of government revenues and expenditures after 2020. The public pension expenditures grow from 6.7 to 12.8% of GDP-M from 2014 to 2060.
The most important reason for the rise in the GDP-M share of public pension expenditures with the old system is that this system does not include any actuarial adjustment mechanism which modifies the effect of the increase in longevity, which averages 4.8 years for individuals aged 62 years in the period 2013–2060 in this scenario. In addition, the large cohorts born after World War II will replace less populous mid-war cohorts. Moreover, public pension benefits in payment are assumed to be indexed to wage growth with the old system, and the wage rate grows faster than the GDP deflator. Also, maturing of the existing pension system, as well as growth in female labour market earnings, contributes to raise the average annual public old age benefit. Deflated by the wage rate, this benefit is 3.4% higher in 2060 than in 2014.Footnote 13
5.2. Reform effects
Figure 1 shows that the pension reform is likely to reduce the growth in the fiscal gap significantly after 2020. The model simulations suggest that the period where the fiscal gap declines is extended from 2020 to 2025. With the new system the rising normalized fiscal gap passes zero from below in 2050, and 2.8% in 2060, which is 5.9 percentage points lower than in the no-reform scenario. The slight increase in the fiscal gap in the first 4 years after the implementation of the reform is due to an increase in early withdrawal of old-age pension benefits. Recall that the new system offers a high degree of flexibility with respect to withdrawal of benefits for employees in the private sector, who may combine work and pension after the age of 62. Increased early withdrawal reduces, cet. par, public pension expenditures in later years. Section 6.3 discusses the importance of changes in the benefit withdrawal behaviour.
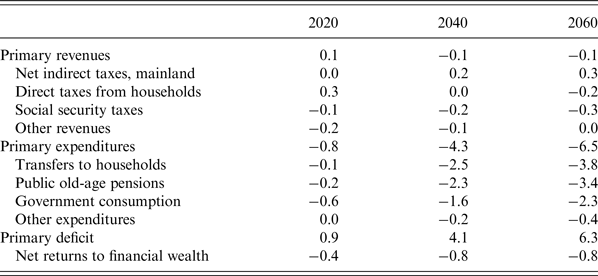
Table 2 shows that the main contributions to the reduction of the normalized fiscal gap come from the fall in the GDP shares of the government expenditures. In 2060 reform reduces the GDP-M share of primary expenditures by 6.5 percentage points from 58.6 to 52.1%. The main source of this is the fall in the GDP-M share of public old-age pensions from 12.8% without reform to 9.4% in the reform scenario.
Fiscal effects of the pension reform

Deviations between the share of government budget components in mainland GDP (GDP-M) in the reform scenario and the no-reform scenario (base). Percentage points.
Source: Authors’ calculations with the MOSART and DEMEC models.
The negative reform effect on the GDP-M share of government consumption is solely caused by the increase in GDP-M resulting from the reform effect on employment. By assumption, government consumption is identical in both scenarios. The small effects on the GDP-M shares of the tax revenues reflect that the corresponding tax bases are very closely related to GDP-M. Thus, the reform effect on employment and GDP-M implies that important fiscal effects are obscured when measured in terms of changes in GDP-M ratios.
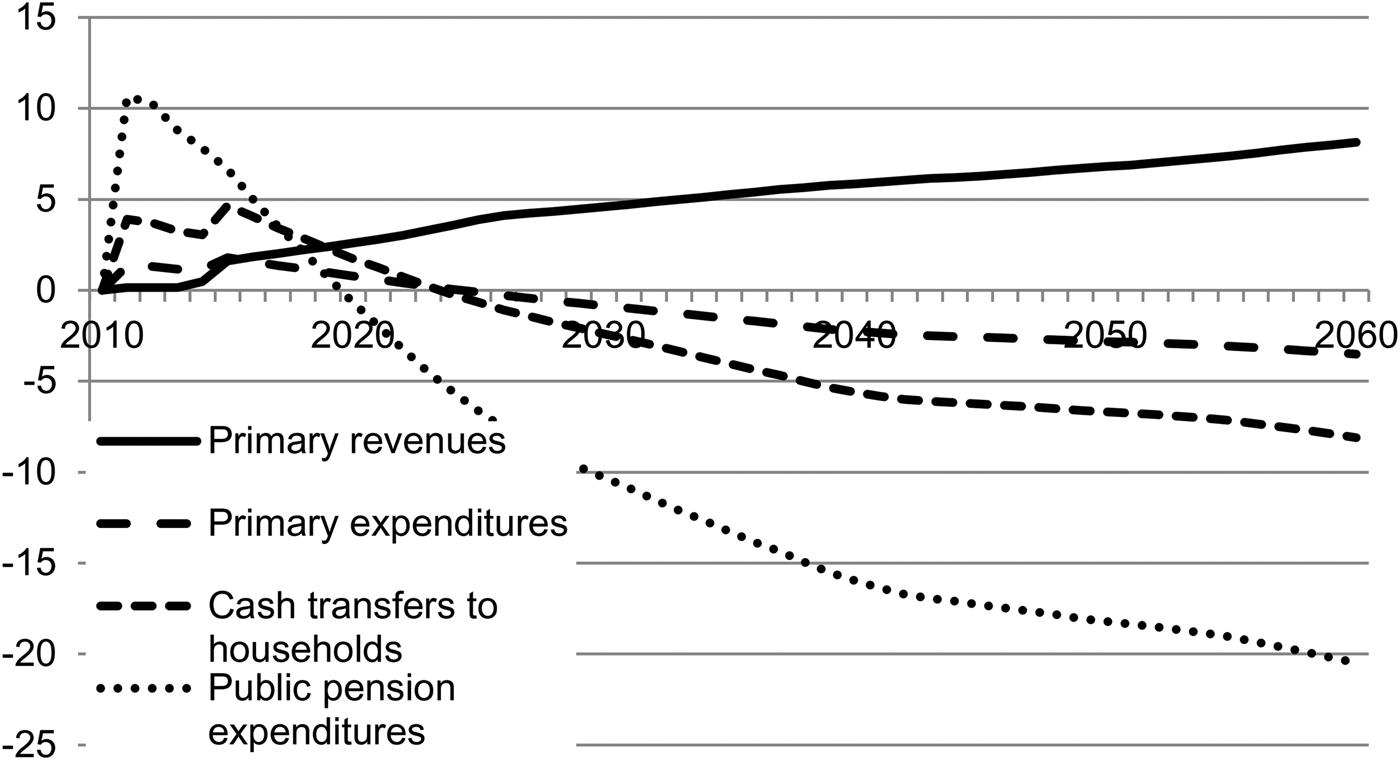
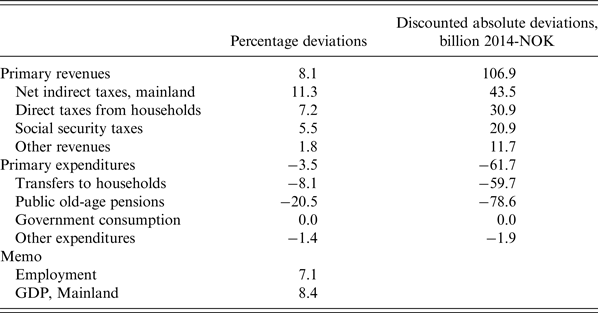
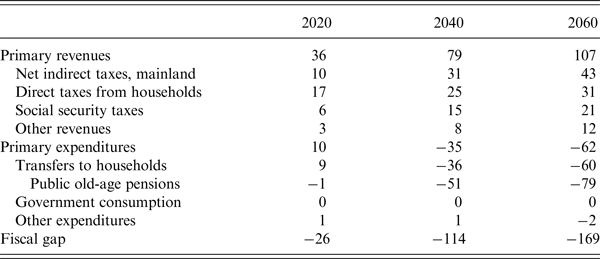
Figure 2 shows the time path of the key fiscal effects measured in terms of percentage deviation between the two scenarios. Table 3 provides more details on the relative fiscal effects in 2060, as well as the corresponding absolute deviations between the present values of the budget components measured in 2014-prices. The present values are computed by discounting the variables measured in current prices by a nominal discount rate of 4%. This discount rate equals the growth rate of the average nominal wage rate. Thus, the present values may alternatively be interpreted as current values deflated by the nominal wage growth rate.
Effects of the pension reform. Deviations between the reform scenario and the no-reform scenario (base). Percent. Source: Authors’ calculations with the MOSART and DEMEC models.

Fiscal effects of the pension reform in 2060 with the old system as base

Percentage deviations and discounted absolute deviations in billions 2010-NOK.
Source: Authors’ calculations with the MOSART and DEMEC models.
Among the items listed in Table 3 the reduction in public old-age pension expenditures makes the strongest contribution to the improvement of government finances, both in relative and absolute terms. Compared with the no-reform scenario in 2060, these expenditures fall by 20.5%. Discounted back to 2014, this amounts to 78.6 billion 2014-NOK. However, public old-age pension expenditures will grow strongly over time also with the new system in place. Deflated by the average wage rate, these expenditures will pass 2.2 times the 2010-level in 2060. The basic reasons are the growth in the number of pensioners and the average entitlements for female workers.
The negative reform effect on the public old-age pension expenditures is somewhat modified by an increase in other government cash transfers to households. The reason is that the increase in the number of relatively old employees caused by delayed retirement is mitigated by an increase in the number of recipients of disability benefits, unemployment benefits and sickness benefits. Compared with the no-reform scenario in 2060 the increases in these transfers add to 18.8 billion 2014-NOK, which brings the reduction of total cash transfers to household down to 59.7 billion 2014-NOK, i.e., 8.1%.
Interestingly, the positive revenue effect due to tax base expansion dominates the reduction in government expenditures. In present value terms the reform implies that the primary revenues in 2060 are 96.5 billion 2014-NOK (corresponding to 8.1%) higher than in the no-reform scenario. The corresponding fall in the present value of primary expenditures equals 61.7 billion 2014-NOK (3.5%). This demonstrates the importance of the labour supply responses, the assumption that all additional labour supply becomes employed without any drop in the real wage rate, and the assumption that all the additional employment is absorbed by the private sector. Moreover, the equilibrium adjustments of the various tax bases demonstrate the empirical significance of taking properly account of the fact that increased employment in the private sector raise almost all tax bases in the mainland economy.
6. Sensitivity analyses
We examine the robustness of the fiscal effects of the reform to variations in (1) longevity; (2) retirement behaviour; (3) benefit withdrawal behaviour; (4) life expectancy adjustments for earlier disabled. This selection is motivated by what have been topical issues in the Norwegian pension debate, as well as insights from relevant recent studies specified below. This section focuses on the reform effects on the normalized fiscal gap. Appendix 2 presents results for some other relevant variables.
6.1. Longevity
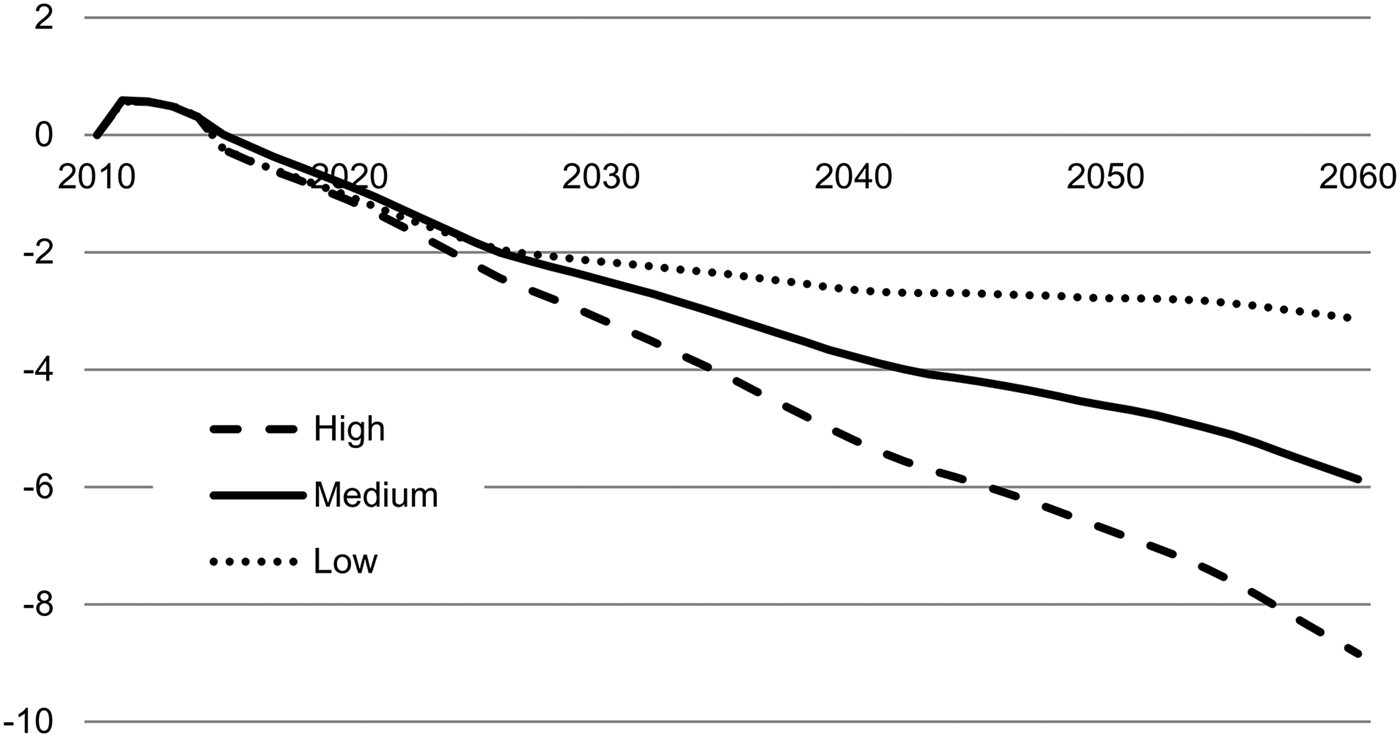
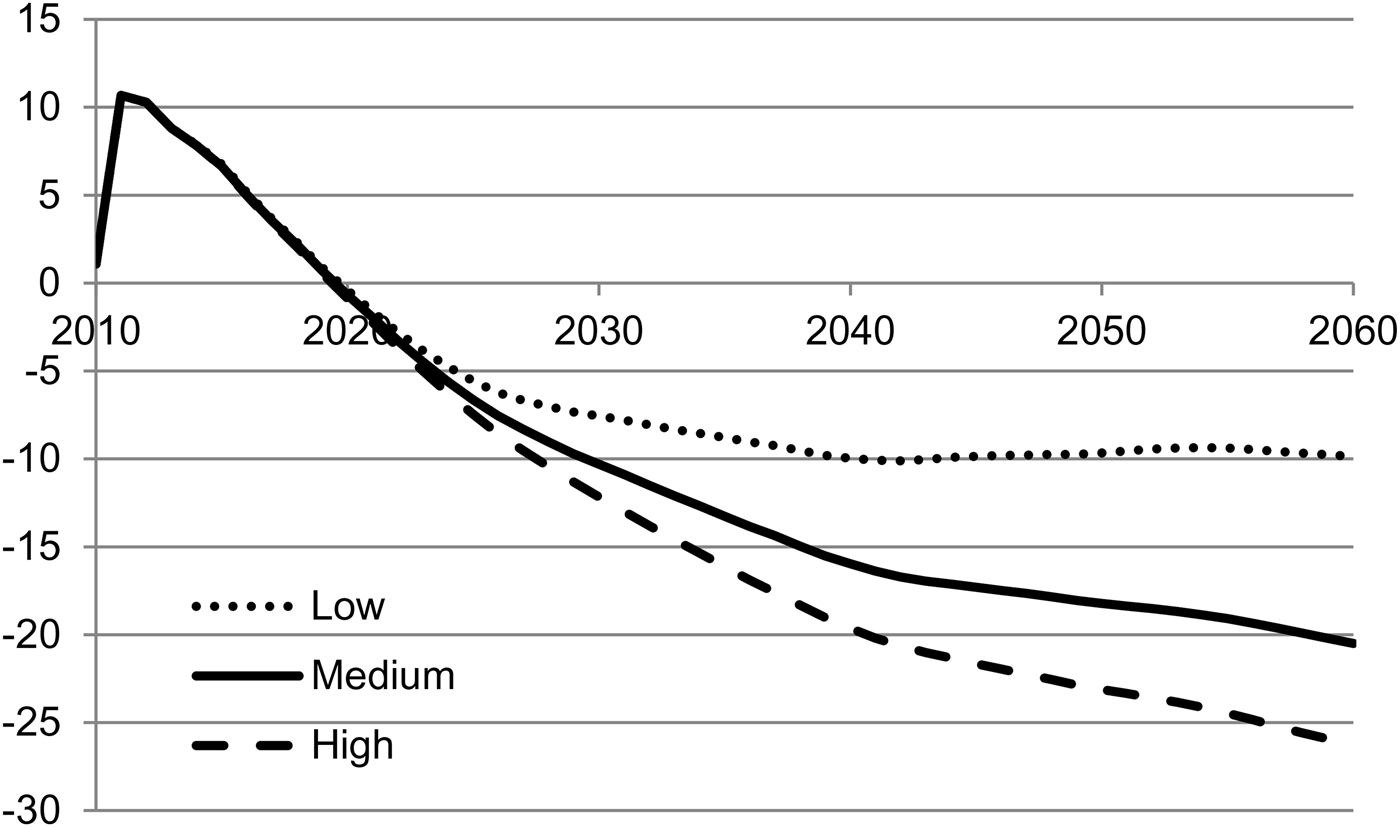
For decades, the observed decline in mortality among the elderly in Norway has proved hard to predict. As explained above, a main intention of the new system is to make public pension expenditures less dependent on changes in longevity. The basic mechanism is the actuarial life expectancy adjustment, which, cet. par. reduces the annual benefits when life expectancy increases. Delayed retirement counteracts this effect by raising entitlements and reducing the number of pension years, provided that the timing of benefit withdrawals follows the retirement adjustments. Below we provide a more focused examination of the empirical importance of these actuarial mechanisms by re-simulating both the baseline and reform scenarios under three different assumptions on average longevity. We compare the most plausible Medium (longevity growth) alternative, presented in Section 5, with two alternatives. Whereas life expectancy for new-borns increases by 6.9 years for men and by 5.6 years for women from 2013 till 2060 in the Medium alternative, the corresponding increments are −0.2 and 1.8 years, respectively, in the Low (longevity growth) alternative. The corresponding increments in the High (longevity growth) alternative are, respectively, 11.5 and 10.2 years.
Figure 3 confirms that the reform effect on the normalized fiscal gap becomes stronger the higher is the longevity growth. Whereas medium longevity growth implies that the reform reduces the normalized fiscal gap by 5.9 percentage points in 2060, the corresponding effects are 3.1 and 8.8 points in, respectively, the low and high longevity growth scenarios.
Reform effects on the normalized fiscal gap under three different assumptions on longevity growth (High, Medium, Low). Absolute deviations between the new system and the old system (base). Percentage points. Source: Authors’ calculations with the MOSART and DEMEC models.

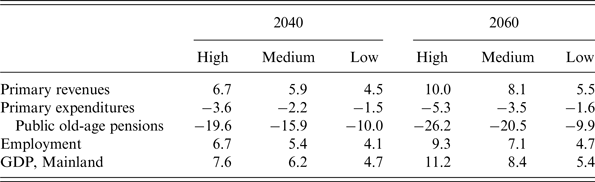
The reform effect on both government revenues and expenditures become stronger the more longevity increases, see Appendix 2, Table A2.1. Due to the incentives in the new system, the reform raises employment by 7.1% in 2060 (185,000 persons) in the Medium alternative. The corresponding effects in the High and Low growth alternatives are, respectively, 9.3% (260,000) and 4.7% (108,000). The employment effects are nearly perfectly correlated with the corresponding effects on the tax bases.
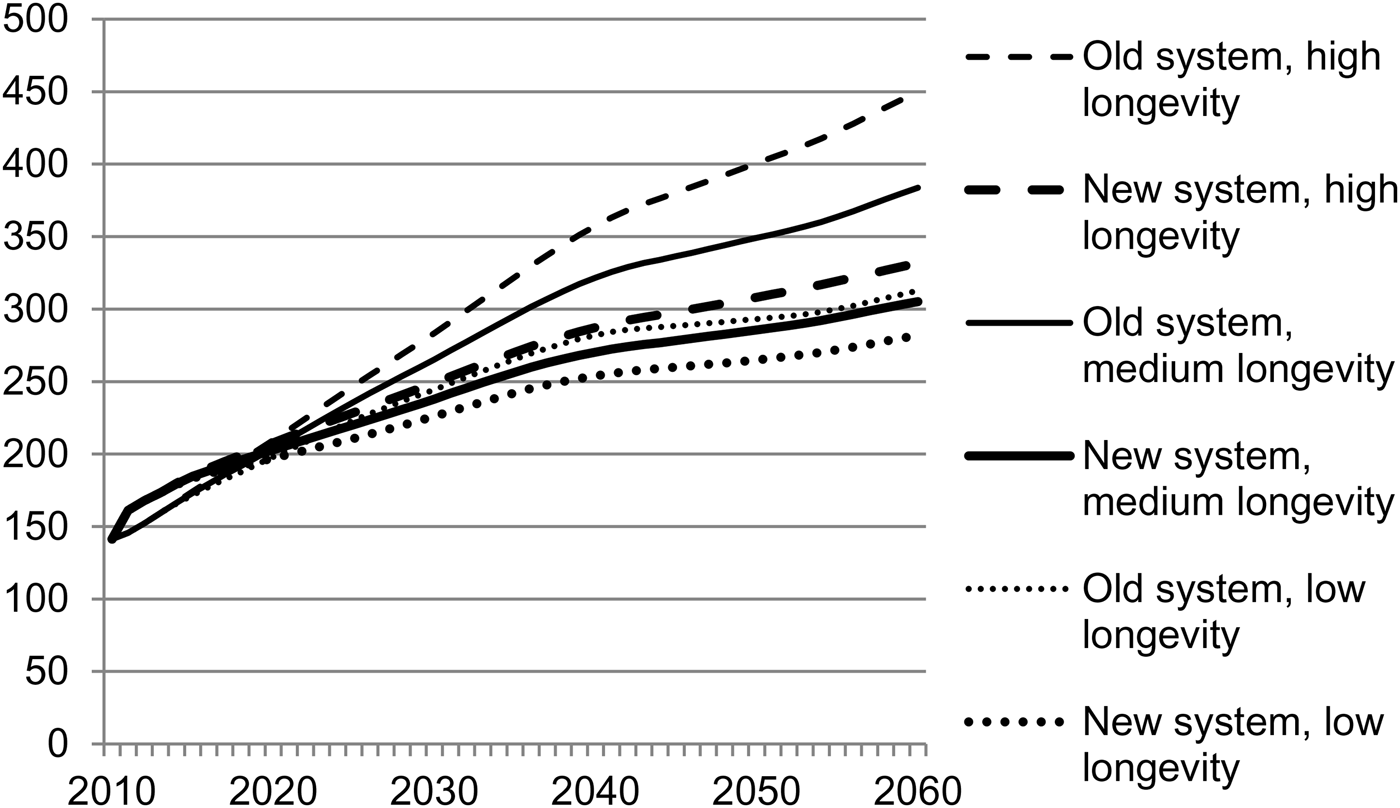
The expenditure reductions are driven by the reform effect on the public pension expenditures. In 2060 the reform reduces these expenditures by 20.5% in the case of medium longevity growth, by 26.2% in the high growth alternative, and by 9.9% in the case of low longevity growth; see Table A2.1 and Figure A2.1 in Appendix 2. Variations in longevity have a much smaller effect on the old age pension expenditures in the new system than in the old one, see Appendix 2, Figure A2.2. What remains of this effect in the new system reflects foremost that the life expectancy adjustment of old-age benefits is more lenient for those who are disabled before they become old-age pensioners.
We conclude that the reform is indeed likely to work as intended: The life expectancy adjustment built into the new system neutralizes most of the direct effect on old-age pension expenditures caused by changes in life expectancy, whereas the old system did not have any such moderating mechanism. Moreover, combined with the stronger link between earnings and entitlements, this life expectancy mechanism will expand employment and tax bases when longevity increases.
6.2. Employment responses to new incentives
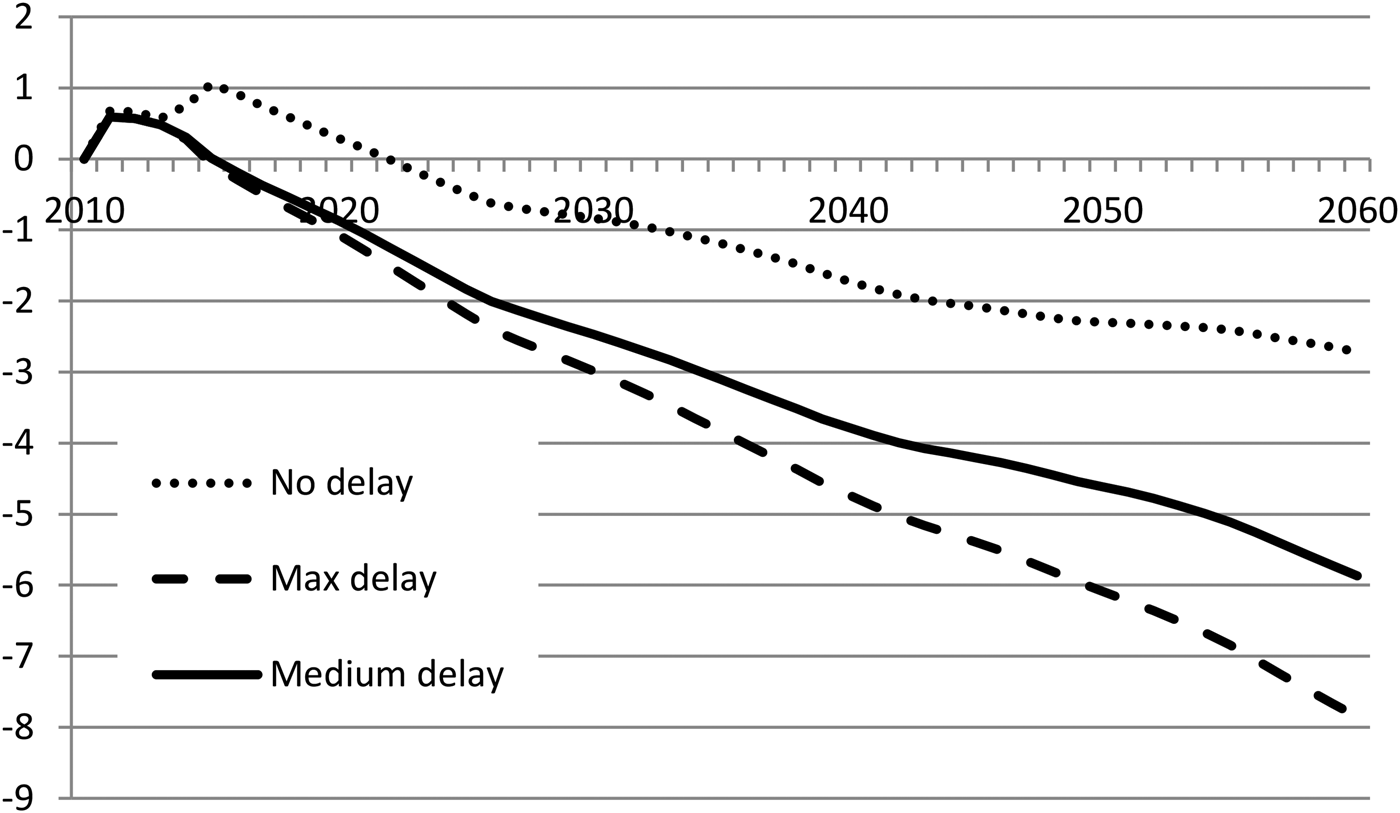
Labour supply behaviour is uncertain in general, and the empirical basis of estimating long run behavioural effects of a specific pension reform, implemented as late as 2011, will necessarily remain weak for several years. Moreover, it is uncertain to what extent the additional labour supply from individuals aged 60 years or more actually will be employed. Below, we compare the most plausible reform effects laid out in Section 4 and 5 with the corresponding effects resulting from two more extreme assumptions about retirement responses. In the No delay alternative we assume that the propensities for retirement are almost unaffected by the reform. In the Max delay alternative workers delay retirement as in the medium alternative, but the propensities to enter disability by age are also reduced corresponding to 2/3 of the growth in life expectancy, as a result of improved health among the elderly.
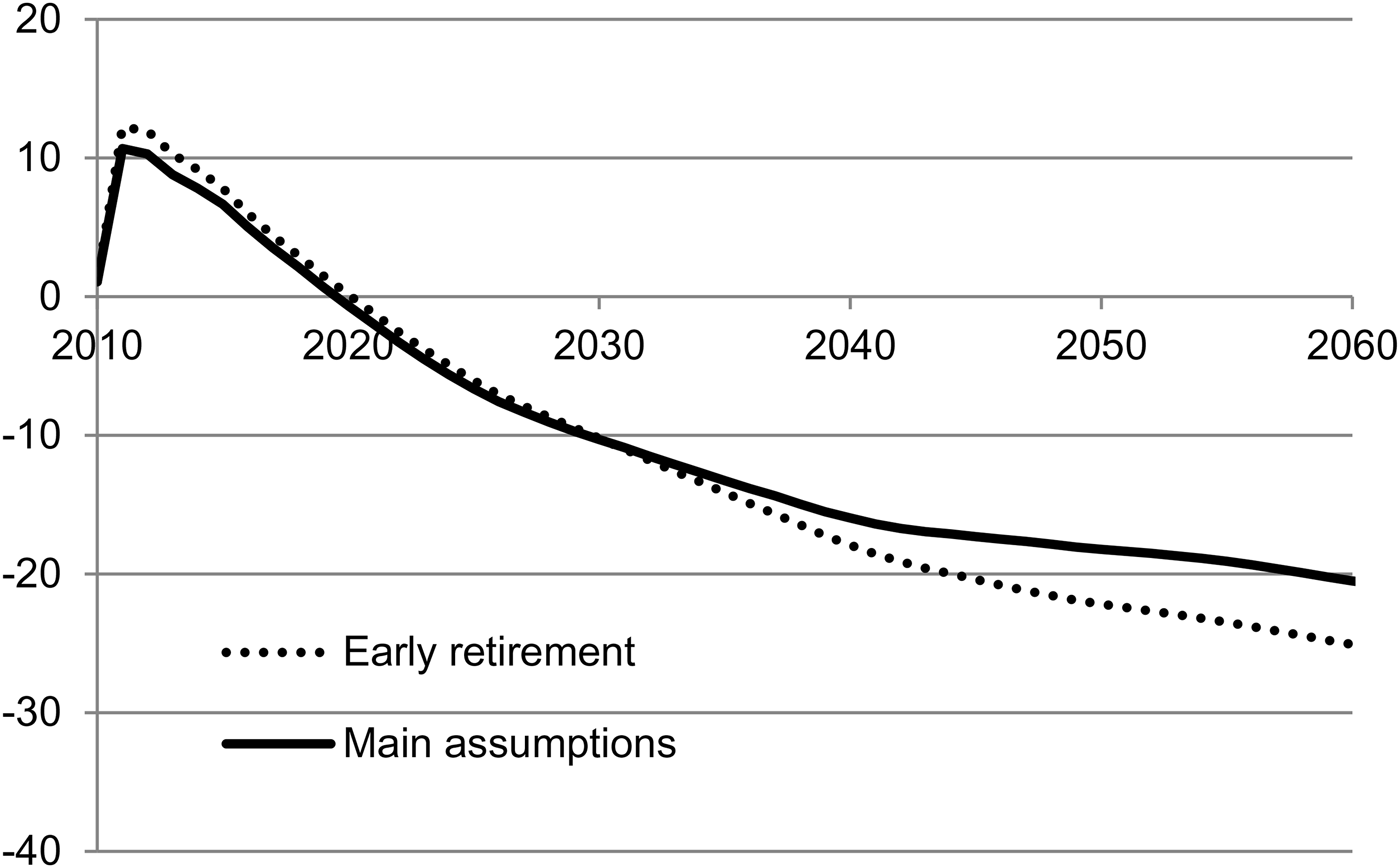
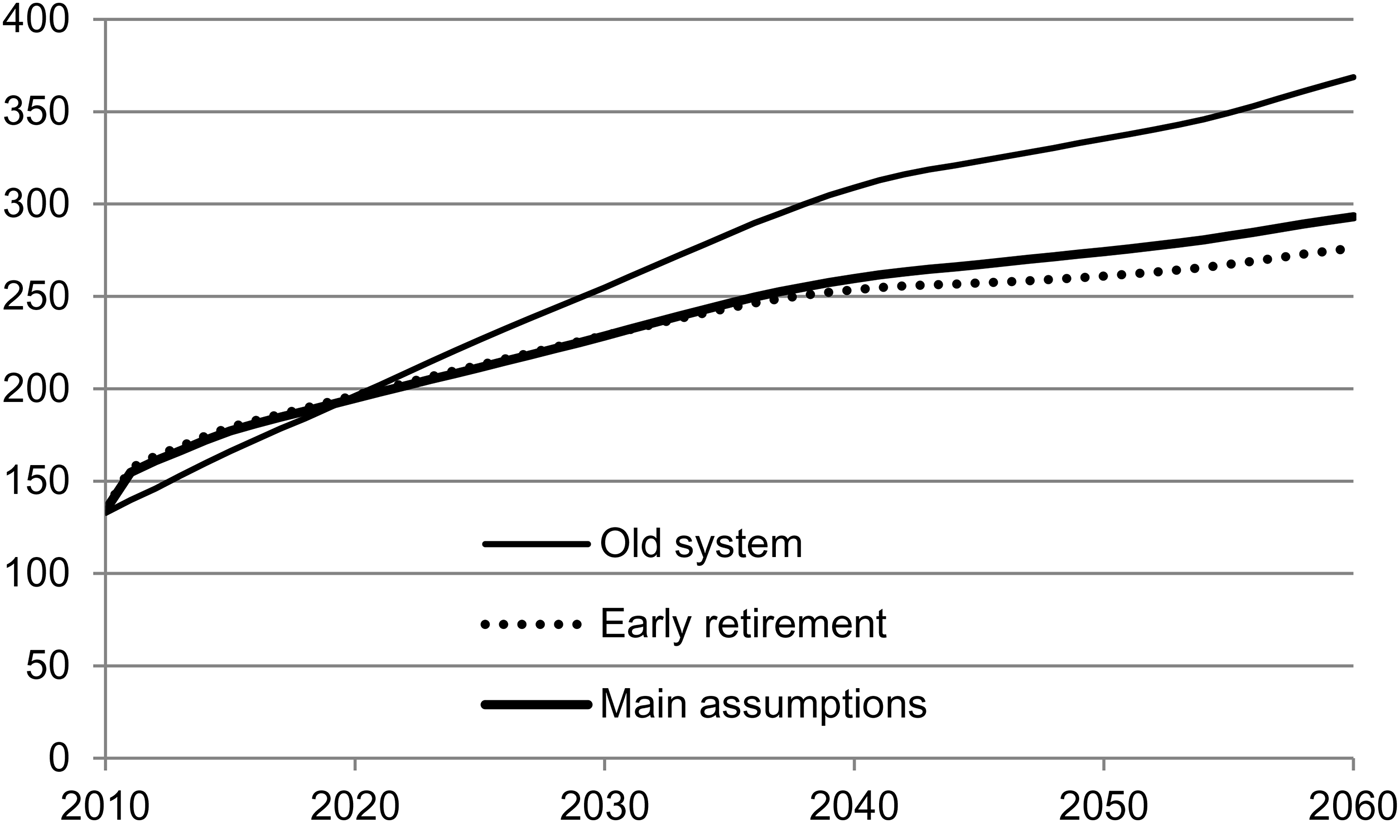
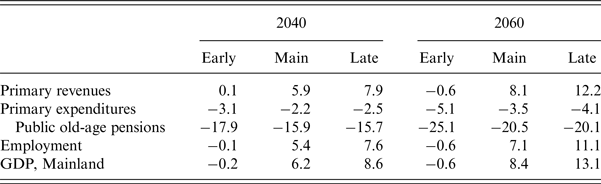
The reform effects on the normalized fiscal gap are quite sensitive to retirement behaviour, see Figure 4. In 2060 the reform reduces the normalized fiscal gap by 5.9 percentage points in the Medium delay alternative, 2.7 points in the No delay alternative, and by 7.9 points in the Max delay alternative. This sensitivity is dominated by the close relationship between employment and most tax bases in the Norwegian mainland economy. The reform effects on employment in 2060 are 7.1% and 11.1% in the Medium and the Max delay alternatives, respectively, whereas employment falls by 0.6% in the No delay alternative, see Appendix 2, Table A2.2. On the other hand, the actuarial mechanisms in the new system make government pension expenditures rather insensitive to the retirement behaviour; the expenditure effect of a decline in the number of old age pensioners caused by delayed retirement is nearly neutralized by the increase in the average annual benefit, see Appendix 2, Figures A2.3 and A2.4.
Reform effects on the normalized fiscal gap under three different assumptions about delay of retirement in the new system. Absolute deviations between the new system and the old system (base). Percentage points. Source: Authors’ calculations with the MOSART and DEMEC models.

6.3. Benefit withdrawal behaviour
The new public pension system allows employees in the private sector to combine work and pension from the age of 62 in a rather flexible way, provided sufficient entitlements. Advancing withdrawal changes the time profile of the individual benefits for the average person, but not the expected present value of the benefit flow for the average person. However, combining early withdrawal with work may be beneficial for persons with shorter remaining life expectancy than the average person in a given cohort. It may also be beneficial for individuals with expected pensions slightly above the minimum pension due to very favourable tax allowances. In 2012 almost 45% of those who were entitled had withdrawn old age pensions before the age of 67, and about 2/3 of old age pensioners below the age of 67 had chosen to work in combination with withdrawing pensions; see Dahl and Lien (Reference Dahl and Lien2013). These shares are far higher than expected before the reform.
The most plausible projection, presented in Section 5, relies on the assumption of a Medium degree of early withdrawal: those who obtain some tax allowances withdraw benefits early in combination with continued work. In a Maximum early withdrawal alternative we assume that all persons in the private sector of age 63 years or more, with sufficient entitlements, withdraw pensions in addition to labour incomes. We also study a No early withdrawal alternative.
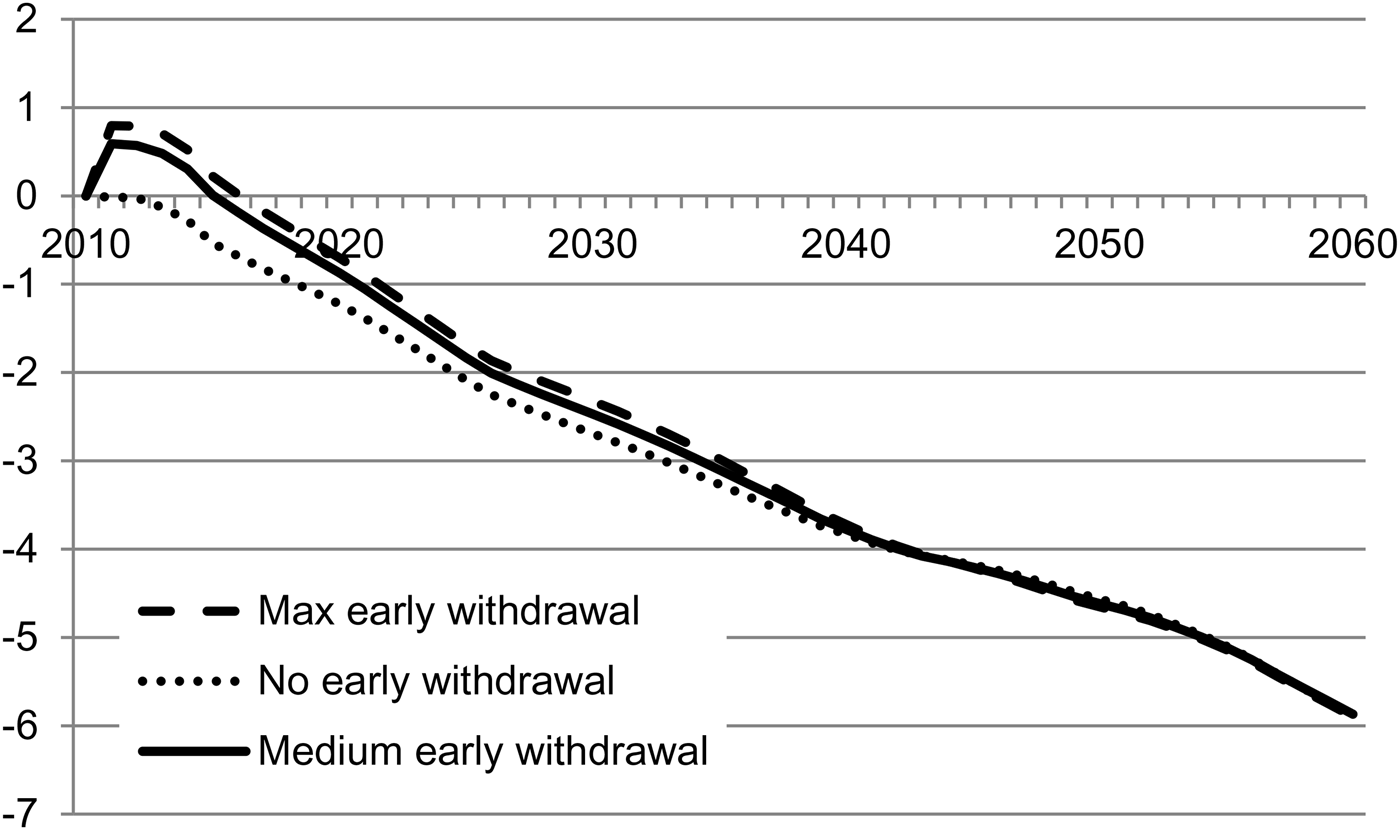
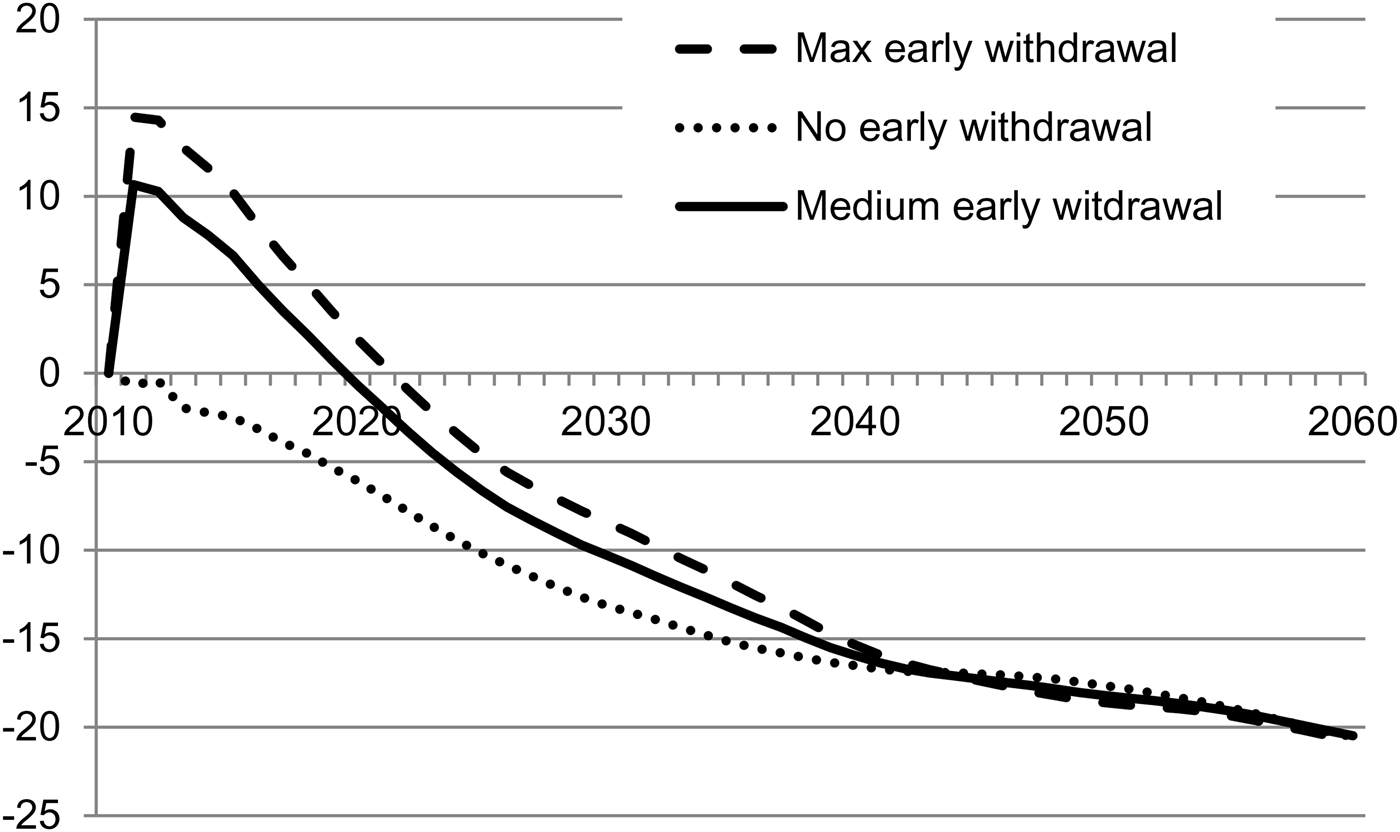
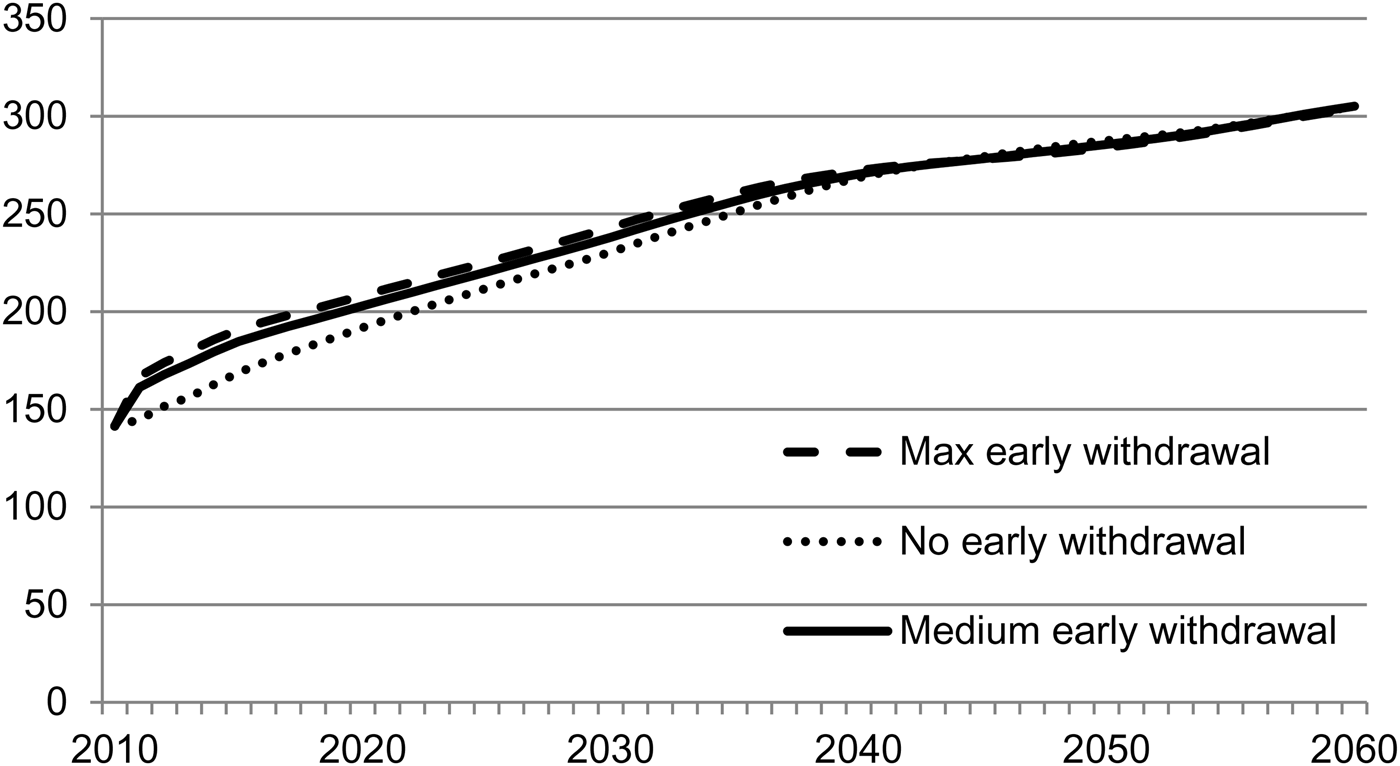
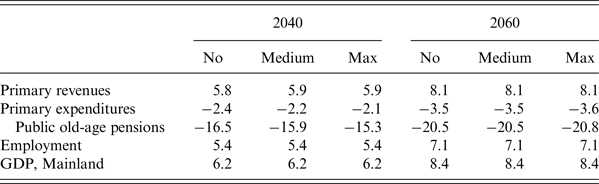
Of course, advancing withdrawal of benefits raises, cet. par., the public old-age pension expenditures in the first decades. We find the greatest impact of withdrawal on these expenditures in 2014, where they are 17 billion 2014-NOK (10%) higher in the Medium alternative than in the No early withdrawal alternative, see Appendix 2, Figure A2.6. In the Maximum early withdrawal alternative these expenditures would have increased further by 6 billion NOK, or 3.8 percentage points. However, we see no reason why changes in withdrawal behaviour should affect other public budget components than the old-age pension expenditures, net of taxes. Although early withdrawal means lower annual benefits for the recipient over the entire remaining life time, additional expenditures in the first decades does not imply lower expenditures in the long run. All reform effects are approximately invariant to the withdrawal behaviour after 2040, see Table A2.3 and the Figures A2.5–A2.7 in Appendix 2. First, births and immigration imply a nearly constant number of persons entering the group of old-age pensioners during a year. Second, the actuarial properties of the new system neutralize the effect of increased longevity on the balance between young and old old-age pensioners.
6.4. Life expectancy adjustments for former disabled
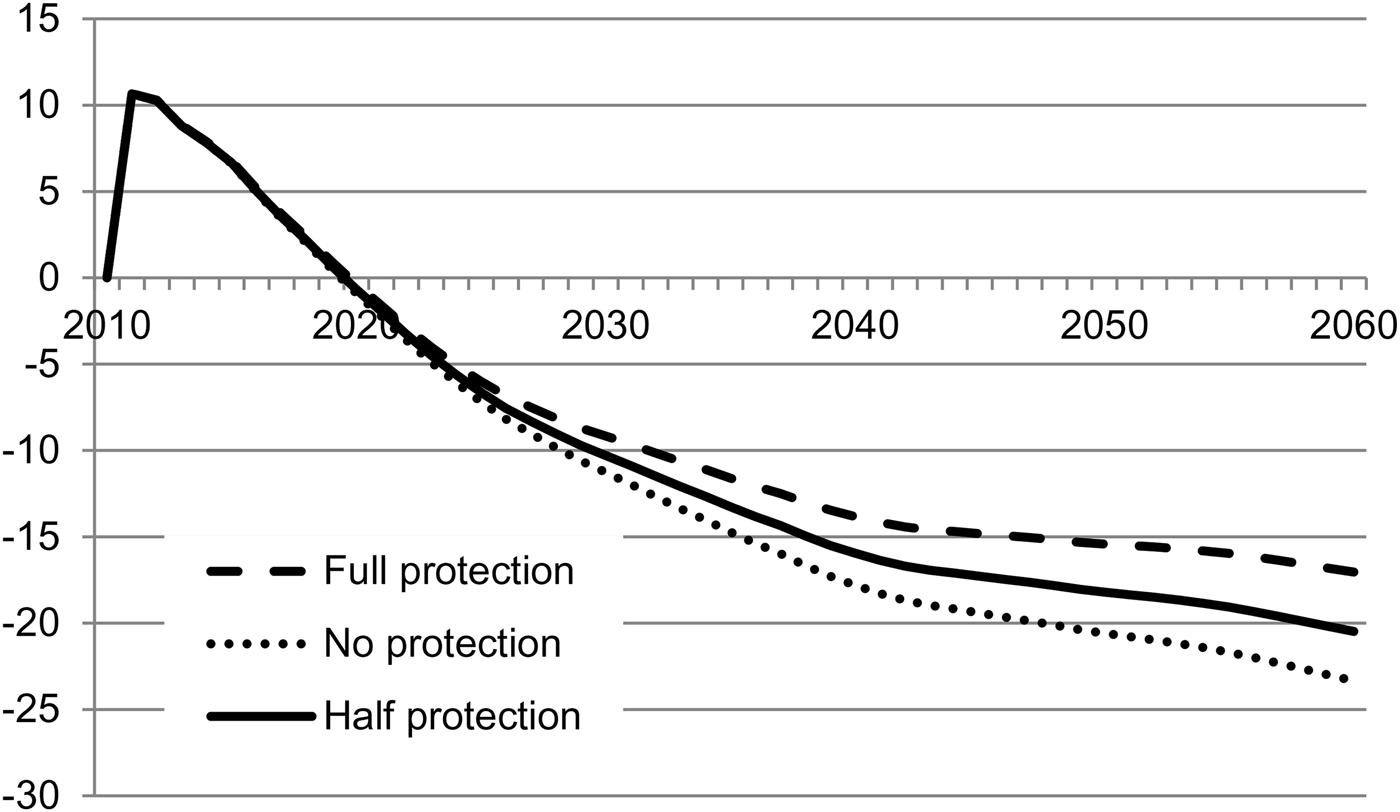
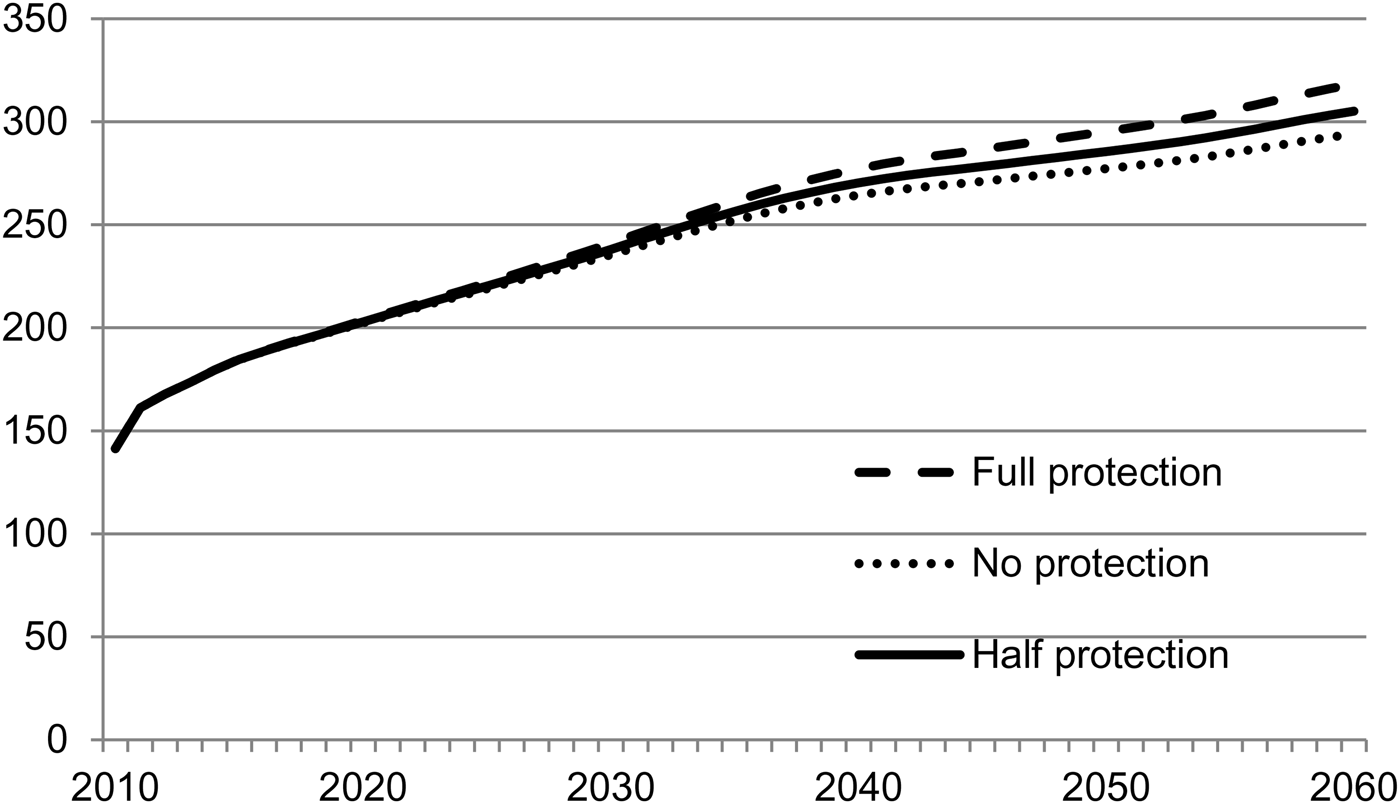
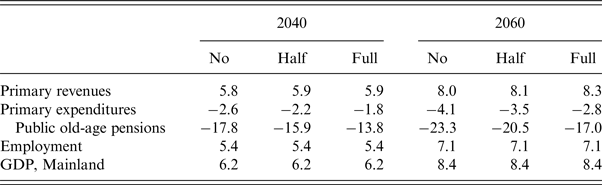
An unsettled reform issue is how the life expectancy adjustment should work for those who are disability pensioners before they are transferred to the public old-age pension scheme at the age of 67. So far the adjustment for this group has been half as strong as the adjustment applying for former employees. We will refer to this practice as ‘Half protection’. The argument for such a protection of disabled is that earlier disabled cannot counteract life expectancy adjustments by delaying retirement. This concern should be balanced against concerns about the economic incentives to retire early through disability insurance. This trade-off is discussed in e.g., Börsch-Supan et al. (Reference Börsch-Supan, Hank and Jürges2005) and Galaasen (Reference Galaasen2014a). We compare Half protection with two extreme alternatives: (1) No protection, i.e., the same life expectancy adjustment for all, and (2) Full protection, i.e., no life expectancy adjustment for former disabled.
Variations in this kind of protection affect two government budget components only: old-age pension expenditures and taxes collected from pensioners. The fiscal effects grow relatively slowly over time from negligible magnitudes in the first couple of decades; see Appendix 2, Table A2.4 and the Figures A2.8–A2.10. This reflects gradual phasing out of a general lenient practice of life expectancy adjustment, as well as longevity growth. The effects are still relatively small in 2060: Full protection raises the normalized fiscal gap by 0.4 percentage points from the Half protection scenario. Going from Half to No protection reduces this gap by 0.3 points. In 2060 ‘half protection’ causes old-age pension expenditures to be 11 billion NOK, or 3.8% higher than in the case of no protection. Full protection would have increased the expenditures further with about 13 billion NOK.
7. Conclusions
Estimates of pension reform effects typically belong to one of three strands of the literature: (1) Highly detailed DMS of purely mechanical effects on individual benefits and government pension expenditures; (2) Econometric studies of behavioural effects of particular elements of pension system, especially labour supply; (3) CGE estimates of the long run effects of rather stylized reforms on employment, fiscal sustainability and the inter-generational welfare distribution. This paper integrates these approaches in order to evaluate to what extent the Norwegian pension reform of 2011 is likely to reach its main goal, which is to contribute substantially to improve long run fiscal sustainability without large cuts in the public old-age pension benefits. We combine detailed DMS with a consistent CGE model of the total economy, including all government revenues and expenditures, and we exploit the available econometric evidence on presumptive important behavioural adjustments.
Our simulations show that it is harder to motivate cost saving reforms of public welfare schemes in Norway than in most other countries. Until about 2035 it would be feasible to finance the old pension system and the other existent welfare schemes at tax rates lower than the present ones, without violating the present policy rule for saving the government petroleum revenues. However, Norway faces a fundamental fiscal sustainability problem in the long run since government expenditures will grow significantly faster than the tax base after 2020. This growth in the fiscal gap is basically a result of the combination of ageing and generous welfare schemes. The Norwegian pension reform is tailored to reduce the growth in the fiscal gap by mitigating the long run growth in the pension expenditures and by raising tax bases through stronger labour supply incentives, rather than being immediately cost saving. The key reform element in this respect is a more actuarial adjustment of the annual old age benefit to changes in life expectancy and early retirement.
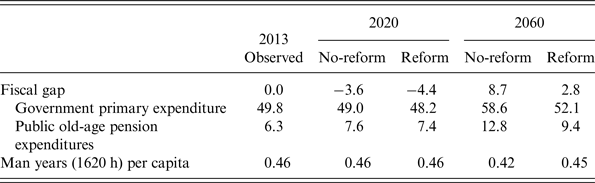
Our results, summarized in Table 4, suggest that the reform is indeed likely to make a great impact in the intended direction. Maintaining the old system would imply an increase in the share of the public old-age pension expenditures in GDP-M from 7.6% to 12.8%, from 2020 till 2060. With the new system the corresponding rise is reduced to 2 percentage points. The GDP-M share of the fiscal gap will be significantly negative in most years in the period 2013–2060 in the most plausible reform scenario, but it will still rise from −4.5% around 2025 to nearly 3% in 2060. Thus, the pension reform alone is far from sufficient to eliminate the Norwegians long run problem of fiscal sustainability. This is no surprise; the pension reform is not intended to curb the growth in government spending on health services and long-term care. On the other hand, the fiscal prospects would look much more worrying if the old system were maintained. In this scenario the normalized fiscal gap increases from −3.5% around 2020 to nearly 9% in 2060.
Estimates of key variables in 2060 based on the most plausible assumptions. All variables except the employment share are measured in percent of GDP of the mainland economy

Percent. Source: Authors’ calculations with the MOSART and DEMEC models.
The lion share of the negative reform effect on government expenditures and the fiscal gap comes from delayed retirement, which reduces the number of old-age pensioners and raises employment in the private sector, and thereby most non-petroleum tax bases. Prolongation of the old system would reduce man years (=1620 man hours) per capita from the present 0.46 to 0.42 in 2060. The pension reform raises this ratio to 0.45 in 2060. In 2060 employment is 7.1% higher in the reform scenario than in the no-reform scenario. We regard this as a strong effect. Our results demonstrate that one would seriously underestimate the fiscal effects of the pension reform if behavioural effects and equilibrium effects on tax bases were ignored. Moreover, the employment effect of the reform implies that most of the reductions in public old-age pension expenditures results from a decrease in the number of recipients rather than lower benefits.
Larger longevity increases and stronger labour supply responses strengthen the positive fiscal reform effects. This sensitivity of mortality and labour supply responses is caused by the actuarial life expectancy mechanism in the new system. No such mechanism existed in the old system. The combination of this mechanism and increasing longevity is also the basic reason why the reform effects grow over time. Our assessed reform effects are quite robust with respect to realistic variations in benefit withdrawal behaviour, as well as variations in the life expectancy mechanism applying to those who are disabled before they become old-age pensioners.
This study leaves several topical issues for future research. First, it would be interesting to assess the social efficiency effects of the reform. Since the effective tax rates on labour income are large in Norway, the strong positive reform effect on employment is likely to entail a significant social efficiency gain. This gain may be compared with the distributional effects assessed in Holmøy and Stensnes (Reference Holmøy and Stensnes2008) and Christensen et al. (Reference Christensen, Fredriksen, Lien, Stølen, Holzmann, Palmer and Robalino2012). Second, it would be interesting to estimate the effects of extending the reform to cover employees in the public sector, especially because population ageing is likely to raise the employment share of the public sector. Third, one should examine more carefully our use of the standard assumption that firms will be willing to employ any increase in the labour supply from old individuals, without any changes in real wage rates or other conditions.
Although the use of large empirical models in this paper has given priority to realism and gone a long way to account for all available information relevant for the policy evaluation, there is obvious scope for methodological improvements. Specifically, consistency can be improved by merging the most important aspects of individual life courses and the general equilibrium mechanisms into an OLG-model with income heterogeneity within each cohort. Moreover, the present analysis has not specified the policy responses to the reform effect on the fiscal gap. Holmøy and Stensnes (Reference Holmøy and Stensnes2008) show that lower tax rates reinforce the positive reform effects on employment and government finances.
Appendix 1 – Fiscal effects of the pension reform under the most plausible assumptions
Fiscal effects of the pension reform

Fiscal effects of the pension reform

Appendix 2 – More results from the sensitivity analyses
A2.1. Longevity
Reform effect on public old-age pension expenditures under different assumptions about longevity growth (High, Medium and Low). Percentage deviations from the no-reform scenario. Source: Authors’ calculations with the MOSART model.

Old-age pension expenditures under different assumptions about longevity growth (High, Medium, Low). Billion 2013-NOK. Source: Authors’ calculations with the MOSART model.

Fiscal and macroeconomic effects of the pension reform under three different assumptions on longevity growth (High, Medium, Low)

A2.2. Delay of retirement
Reform effect on public old-age pension expenditures under different assumptions about delayed retirement in the new system (Early, Main). Percentage deviations from the no-reform scenario. Source: Authors’ calculations with the MOSART model.

Old-age pension expenditures under different assumptions about delayed retirement in the new system (Early, Main). Billion 2014-NOK. Source: Authors’ calculations with the MOSART model.

Fiscal and macroeconomic effects of the pension reform under different assumptions about delayed retirement in the new system (Early, Main, Late)

A2.3. Early withdrawal of benefits
Reform effect on the normalized fiscal gap under different assumptions about early withdrawal of benefits in the new system (No, Medium, Max). Absolute deviations between the new system and the old system (base). Percentage points. Source: Authors’ calculations with the MOSART and DEMEC models.

Reform effect on public old-age pension expenditures under different assumptions about early withdrawal of benefits in the new system (No, Medium, Max). Percentage deviations from the no-reform scenario. Source: Authors’ calculations with the MOSART model.

Old-age pension expenditures under different assumptions about early withdrawal of benefits in the new system (No, Medium, Max). Billion 2014-NOK. Source: Authors’ calculations with the MOSART model.

Fiscal and macroeconomic effects of the pension reform under different assumptions about early withdrawal of benefits in the new system (No, Medium, Max)

A2.4. Protection of former disabled from the life expectancy adjustment
Reform effect on the normalized fiscal gap under different assumptions about protection of the former disabled old-age pensioners from the life expectancy adjustment (No, Half, Full) in the new system. Absolute deviations between the new system and the old system (base). Percentage points. Source: Authors’ calculations with the MOSART and DEMEC models.

Reform effect on public old-age pension expenditures under different assumptions about protection of the former disabled old-age pensioners from the life expectancy adjustment (No, Half, Full) in the new system. Percentage deviations from the no-reform scenario. Source: Authors’ calculations with the MOSART model.

Old-age pension expenditures under different assumptions about protection of the former disabled old-age pensioners from the life expectancy adjustment (No, Half, Full) in the new system. Billion 2014-NOK. Source: Authors’ calculations with the MOSART model.

Fiscal and macroeconomic effects of the pension reform under different assumptions about protection of former disabled old-age pensioners from the life expectancy adjustment (No, half, full) in the new system