


Introduction
Suicidal ideation and self-harm are important public health concerns. Previous self-harm is the strongest risk factor for subsequent suicide (Knipe et al. Reference Knipe, Padmanathan, Newton-Howes, Chan and Kapur2022) and future repeated self-harm (Carroll et al. Reference Carroll, Metcalfe and Gunnell2014). The emergency department (ED) serves an important role in providing early medical stabilisation, psychosocial evaluation, and referral to mental health services for individuals who present with self-harm and/or suicidal thoughts (Cully et al. Reference Cully, Corcoran, Gunnell, Chang, McElroy, O’Connell, Arensman, Perry and Griffin2023) with nearly half of presentations discharged directly from the ED (Cully et al. Reference Cully, Russell, Joyce, Corcoran, Daly and Griffin2024). The National Clinical Programme for Self-Harm and Suicide-related Ideation (NCPSHI) was introduced in Ireland in 2014 with the aim of standardising care and improving clinical outcomes for individuals presenting with suicidal ideation or self-harm to EDs and recent evidence suggests there have been improvements in care processes though improvement in clinical outcomes remains undetermined (Cully et al. Reference Cully, Corcoran, Gunnell, Chang, McElroy, O’Connell, Arensman, Perry and Griffin2023). Matching service demand with available resources is essential for maintaining quality and efficiency of care for distressed individuals. Strategies to forecast demand patterns at a population level to address such surges is commonplace in physical healthcare in Ireland (Department of Health 2026) but has not been translated to mental healthcare.
Seasonal variation in suicidal behaviour is long recognised, with consistent observations in both the Northern and Southern hemispheres of a peak in Spring and early Summer, and a Winter trough (Akkaoui et al. Reference Akkaoui, Chan-Chee, Laaidi, Fifre, Lejoyeux, Vaiva, Peyre and Geoffroy2022; Kaufman and Fitzmaurice Reference Kaufman and Fitzmaurice2021; Nam et al. Reference Nam, Sim, Lee, Kim, Kim and Ryu2022), particularly for violent methods of suicide (Aguglia et al. Reference Aguglia, Serafini, Solano, Giacomini, Conigliaro, Salvi, Mencacci, Romano, Aguglia and Amore2019; Christodoulou et al. Reference Christodoulou, Douzenis, Papadopoulos, Papadopoulou, Bouras, Gournellis and Lykouras2012; Maes et al. Reference Maes, Cosyns, Meltzer, De Meyer and Peeters1993). Seasonality is not uniform between countries and differences between them are influenced by local sociocultural, economic, and demographic factors (Yu et al. Reference Yu, Yang, Kim, Hashizume, Gasparrini and Armstrong2020) – for example, the seasonality of suicidal behaviour among children and young people is associated with the school calendar (Kim et al. Reference Kim, Krause and Lane2023). Geographic location, and therefore the specific pattern of photoperiod (consistent day length across the year or shorter days during Winter and longer days during Summer) experienced by the population, appears to influence the rate of suicide. In several studies of countries spanning large distances North/South (Brazil, Chile, France, and Greenland), areas subjected to greater variations of photoperiod (further from the equator), have higher observable rates of suicide with a more pronounced Spring peak (Akkaoui et al. Reference Akkaoui, Chan-Chee, Laaidi, Fifre, Lejoyeux, Vaiva, Peyre and Geoffroy2022; Björkstén et al. Reference Björkstén, Kripke and Bjerregaard2009; Coimbra et al. Reference Coimbra, de Miranda Coelho and de Andrade2026; Heerlein et al. Reference Heerlein, Valeria and Medina2006). Within time zones, Westerly locations have been observed to experience relatively higher rates in both Brazil and the United States (Coimbra et al. Reference Coimbra, de Miranda Coelho and de Andrade2026; Reis et al. Reference Reis, Yen, Tizenberg, Gottipati, Postolache, Riggs, Nance, Dagdag, Plater, Federline, Grassmeyer, Dagdag, Akram, Ozorio Dutra, Gragnoli, RachBeisel, Volkov, Bahraini, Stiller, Brenner and Postolache2023). This is pertinent to the Irish context given its location to the far West of its time zone partition and within a Northerly latitude.
The association between suicide and temperature has been the most widely studied meteorological variable though more frequently with completed suicide rather than self-harm, with a 1-degree Celsius increase correlating with a∼1% increase in completed suicide (Frangione et al. Reference Frangione, Villamizar, Lang, Colman, Lavigne, Peters, Anisman and Villeneuve2022; Gao et al. Reference Gao, Cheng, Duan, Xu, Bai, Zhang, Zhang, Wang, Zhang and Su2019; Thompson et al. Reference Thompson, Lawrance, Roberts, Grailey, Ashrafian, Maheswaran, Toledano and Darzi2023). Higher Spring temperatures in particular appear to be associated with increased rates of self-harm (Saulnier and Bagge Reference Saulnier and Bagge2024). The limited available evidence of a connection between rainfall and completed suicide or self-harm is inconsistent. Meta-analytic data suggests there is no association (Frangione et al. Reference Frangione, Villamizar, Lang, Colman, Lavigne, Peters, Anisman and Villeneuve2022), although a recent study suggests rainfall might be correlated with a reduction in suicide attempts (Saulnier and Bagge Reference Saulnier and Bagge2024). Earlier ecological studies indicated a relationship between sunshine and suicide seasonality in mainly high-income countries (Petridou et al. Reference Petridou, Papadopoulos, Frangakis, Skalkidou and Trichopoulos2002). Though systematic review evidence suggests there is no direct link between overall sunshine duration and suicidality, (Frangione et al. Reference Frangione, Villamizar, Lang, Colman, Lavigne, Peters, Anisman and Villeneuve2022; Gao et al. Reference Gao, Cheng, Duan, Xu, Bai, Zhang, Zhang, Wang, Zhang and Su2019), a nuanced relationship has been observed through its mediation of the effects of high temperature (Xing et al. Reference Xing, Gai, He, Cheng, Zhu, Cheng, Fan, Su, Wang, Bai and Cheng2026). Additionally, certain subgroups might be more vulnerable to the influence of sunshine and temperature, such as those treated with antidepressants (Makris et al. Reference Makris, White, Reutfors, Ekselius, Andersen and Papadopoulos2021).
There are several theoretical causal mechanisms of the link between meteorological variables and self-harm including circadian regulation and neuroendocrine rhythm disruption (Walker et al. Reference Walker, Walton, DeVries and Nelson2020). Temperature-related mechanisms could include thermoregulatory stress, sleep disruption during the warmer nights, and neuroinflammatory pathways with resultant worsening of agitation or anxiety (Lõhmus Reference Lõhmus2018; Modzelewski et al. Reference Modzelewski, Naumowicz, Suprunowicz, Oracz and Waszkiewicz2025). Psychosocial mechanisms, such as seasonal transition stressors, work and social rhythms, and substance use patterns, also play a significant role (Christodoulou et al. Reference Christodoulou, Douzenis, Papadopoulos, Papadopoulou, Bouras, Gournellis and Lykouras2012).
To the best of our knowledge, previous Irish studies on the association between meteorological variables have not examined suicidal ideation or self-harm. In an Irish population of older adults, those living in areas with higher rainfall and less sunshine were found to experience greater depressive symptoms (O’Hare et al. Reference O’Hare, O’Sullivan, Flood and Kenny2016). Two large studies examining the impact of weather variables on psychiatric admissions between 1971 and 2002 for affective disorders and psychosis respectively found only weak associations between barometric pressure for mania and psychosis admissions, and further weak associations for higher temperature and sunshine for psychosis admissions (McWilliams et al. Reference McWilliams, Kinsella and O’Callaghan2013, Reference McWilliams, Kinsella and O’Callaghan2014). Studying associations with admissions is limited by bed capacity, which reduced in Ireland over that time, whereas presentation data such as is presented in our study is not limited by service constraints.
Ireland’s northern latitude with seasonal fluctuations in photoperiod, along with its climate of frequent temperature, sunshine and precipitation variability, make it a unique setting to evaluate whether meteorological exposures produce measurable variation in demand for services. The present study seeks to (i) characterise temporal and seasonal variability in ED presentations for suicidality and self-harm over an eight-year period and (ii) examine if daily photoperiod changes and meteorological variables, including temperature, sunshine hours, and precipitation, are associated with daily presentation rates after controlling for calendar effects.
Methods
Study design and setting
This time series observational study analysed day-level counts of ED presentations for suicidal ideation and self-harm at St Vincent’s University Hospital (SVUH) in Dublin, Ireland, from 12 July 2016 to 31 December 2024. SVUH is a university teaching and tertiary referral hospital in an urban area with a 24-hour adult ED that receives over 55,000 attendances annually. It is the only ED with 24-hour psychiatric care for a population of 456,000 people (Central Statistics Office 2022) provided by a consultation–liaison psychiatry service during regular hours and an on-call psychiatry rota out-of-hours. The hospital is located within a temperate oceanic climate at 53.32°N, 6.21°W. Reporting follows STROBE guidance for observational studies (von Elm et al. Reference von, Altman, Egger, Pocock, Gøtzsche, Vandenbroucke and initiative2007).
Case identification and clinical system
The clinical and demographic details of patients referred for psychiatric assessment from the ED were contemporaneously recorded by liaison psychiatry and on-call psychiatry staff through their routine daily work. This dataset was stored in an encrypted Excel file to facilitate access to information on previous presentations to designated staff out of administrative hours where access to such information can be limited. Attendances with suicidal ideation or self-harm were categorised at data input stage. This dataset was verified on a weekly basis against ED records to ensure completeness and resolve discrepancies. After anonymisation, data were prepared for analysis and cleaned, including (i) standardisation of date fields, (ii) verification of one record per presentation episode, (iii) deletion of duplicate entries, and (iv) basic completeness checks of key variables (e.g. date and presentation category). The dataset was then exported to SPSS Statistics Version 29 for Mac for analysis (IBM Corporation 2022). For the purpose of this study, self-harm was defined as deliberate self-poisoning or self-injury regardless of motivation and level of suicidal intention in line with previous large observational and registry-based studies (Griffin et al. Reference Griffin, Kavalidou, Bonner, O’Hagan and Corcoran2020; Schmidtke et al. Reference Schmidtke, Bille-Brahe, Deleo, Kerkhof, Bjerke, Crepef, Haring, Hawton, Lönnqvist, Michel, Pommereau, Querejeta, Salander-Renberg, Temesváry, Wasserman, Fricke, Weinacker and Sampaio-Faria1996).
Photoperiod and meteorological variables
The daily meteorological data were retrieved for the Dublin Airport meteorological station, which is located 11.7 km from the hospital, from the Irish Meteorological Service website (Met Eireann 2026). Variables extracted were:
-
Daily mean, minimum, and maximum temperature (degrees Celsius – °C). Including both minimum and maximum temperature allows for the effect of daily extremes to be examined (Frangione et al. Reference Frangione, Villamizar, Lang, Colman, Lavigne, Peters, Anisman and Villeneuve2022; McWilliams et al. Reference McWilliams, Kinsella and O’Callaghan2013; Saulnier and Bagge Reference Saulnier and Bagge2024).
-
Daily total precipitation (millimetres – mm)
-
Daily sunshine duration (hours)
Photoperiod, calculated as the interval from sunrise to sunset in each calendar day, was taken in terms of the coordinates of the hospital (53.32°N, 6.21°W) from the United States Naval Observatory Website (U.S. Naval Observatory 2026). For seasonal transition dynamics, the main exposure to photoperiod was the rate of change in photoperiod (minutes/day), defined as the day-to-day difference in photoperiod and subsequently presented with a 7-day rolling average. Positive values indicate lengthening of the photoperiod, whereas negative values indicate shortening of the day. A measure of delayed associations was assessed by lagged photoperiod-change exposures at 7 and 14 days. Temperature is treated as a near-term exposure variable in previous association studies (Frangione et al. Reference Frangione, Villamizar, Lang, Colman, Lavigne, Peters, Anisman and Villeneuve2022) and in the present study, temperature is converted to 7-day rolling average of daily mean, minimum, and maximum temperature. Precipitation and sunshine duration have been summarised in rolling cumulative totals for 7-day, 14-day, and 30-day windows (aligned to each index day) to examine short- and medium-term accumulation of weather exposures. Cumulative precipitation was aggregated per 10 mm increment and cumulative sunshine per 1 hour increment.
Statistical analysis
Descriptive statistics of daily, monthly, and yearly count data were calculated. We examined the relationship between our chosen variables with daily ED presentations using generalised linear models (GLMs) with a Poisson distribution. This was selected as the outcome represented daily counts of presentations with suicidal ideation and/or self-harm. To account for calendar effects on variation in service use, all meteorological exposure models were controlled for by day of week and month of year. Each meteorological exposure (minimum, maximum, and mean temperature, photoperiod-change, cumulative sunshine, and cumulative precipitation) was studied in separate models. For each accumulation window (7, 14, and 30 days), individual models were fitted for both sunshine and precipitation. Our model coefficients were exponentiated and reported as rate ratios (RR/IRR) with 95% confidence intervals. Model fit was examined by likelihood ratio (LR) tests against intercept-only models and dispersion by deviance/df (as well as Pearson χ2/df). Robust standard errors were used to account for mild overdispersion.
Ethics
Routinely collected clinical service data was analysed following anonymisation. This study was registered as a retrospective chart review and received ethical approval from the St Vincent’s University Hospital Research Ethics Committee (RCR25-023).
Results
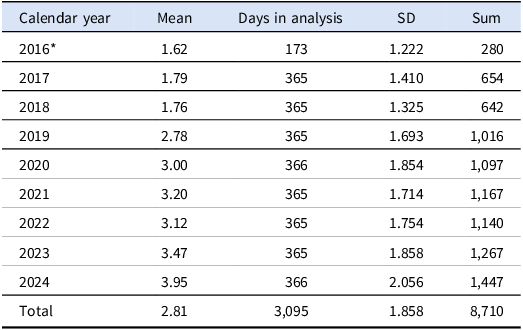
Daily presentation data from 12th July 2016 to 31st December 2024 were included in the analysis (3095 days). Within this period, there were n = 8710 presentations to the ED relating to suicidal ideation or self-harm. Daily presentation counts increased consistently every year. Full yearly data is reported in Table 1. The mean (SD) presentations per day were 1.62 (1.22) in 2016, rising to 3.95 (2.06) in 2024. There was a marked increase from 2020 onwards, where daily presentations surpassed a mean of 3 per day.
Daily presentations by year

Table 1. Long description
A table titled ‘Daily presentations by year’ with data from 12th July 2016 to 31st December 2024. The table has 9 rows and 5 columns. Column headers are ‘Calendar year’, ‘Mean’, ‘Days in analysis’, ‘SD’, and ‘Sum’. Row labels are the calendar years from 2016 to 2024, with a total row at the bottom. Each row provides the mean, days in analysis, standard deviation, and sum of daily presentations for each year. Notable trends include a consistent increase in daily presentations each year, with a marked increase from 2020 onwards, where daily presentations surpassed a mean of 3 per day.
* Partial year of data.
SD = standard deviation.
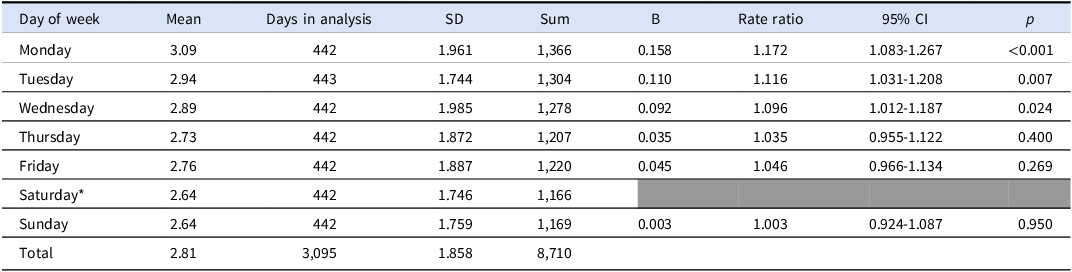
There was a significant day of week variation of presentations on the GLM (LR χ2 (6) = 26.3, p < 0.001). The lowest mean counts occurred on Saturdays (mean = 2.64, SD = 1.75; total = 1166) and Sundays (mean = 2.64, SD = 1.76; total = 1169), see Table 2. Using Saturday as the reference, presentation rates were significantly higher on Mondays (mean = 3.09; SD 1.96; n = 1366; B = 0.158; RR = 1.17, 95% CI 1.08–1.27; p < 0.001), followed by Tuesdays (mean = 2.94, SD = 1.74; n = 1304; B = 0.11, RR = 1.12, 95% CI 1.03–1.21, p = 0.007) and Wednesdays (mean = 2.89, SD = 1.99; total = 1278; B = 0.092, RR = 1.10, 95% CI 1.01–1.19, p = 0.024). 45.3% of presentations occurred Monday to Wednesday, and only 26.8% occurred at the weekend.
Presentations by day of the week

Table 2. Long description
A table with eight rows and eight columns comparing presentation counts by day of the week. The columns are labeled Day of week, Mean, Days in analysis, SD, Sum, B, Rate ratio, 95% CI, and p. The rows are labeled Monday through Sunday, with a total row at the bottom. Each row provides data for the respective day, including mean counts, standard deviation, total presentations, and statistical values. Notable trends include higher presentation rates on Mondays, Tuesdays, and Wednesdays compared to weekends.
* Saturday used as reference day.
CI = confidence interval.
SD = standard deviation.
Presentations were generally higher in meteorological Spring months (March–May: means = 2.93–2.95) with the lowest daily presentation rates in December (mean = 2.66, SD 1.814, n = 741). Two individual months reached significance with the GLMs: May (mean = 2.95, SD = 1.83, n = 732; B = 0.11, RR = 1.11, 95% CI 1.00–1.23, p = 0.043) and November (mean = 2.94, SD = 1.95; n = 795; B = 0.10, RR = 1.11, 95% CI 1.00–1.23, p = 0.043). However, the overall model did not reach statistical significance (LR χ2 (11) = 9.09, p =0.614).
Photoperiod
The rate of change of photoperiod across the study period is indicated in Figure 1. The rates of change are at the greatest positive or negative magnitude around the Spring and Autumn equinox, respectively. Photoperiod change ranges from −4.2 to 4.25 minutes per day, with this asymmetry caused by the Earth’s elliptical orbit. The seven-day rolling average rate of change in photoperiod (per 1 min/day) was not significantly associated with daily presentations (RR = 1.04, 95% CI 0.99–1.09, Wald χ2 = 2.78, p = 0.096). However, when this was lagged by seven days, a significant association begins to emerge. For every 1-minute/day increase in photoperiod one week earlier, there was a 4.7% increase in presentations (B = 0.45, SE = 0.229, RR = 1.047, 95% CI 1.00–1.095, Wald χ2 = 3.93, p = 0.048). When photoperiod change was lagged by 14 days, daily presentations increased by 5% for each additional 1-minute/day increase in photoperiod two weeks earlier (B = 0.49, SE = 0.23, RR = 1.05, 95% CI 1.004–1.099, Wald χ2 = 4.57, p = 0.032). In the weeks after the Spring Equinox, when photoperiod increase is at its maximum of 4.25 minutes per day, this translates to a 20–21.25% increase in daily presentations in the following 7–14 days. In both 7- and 14-day lagged analyses, there were significant weekday effects (LR χ2 (6) = 25.69, p < 0.001; LR χ2 (6) = 25.47, p < 0.001 respectively) but no effect from calendar month (p = 0.483 and p = 0.45). The model showed mild over dispersion but within acceptable limits.
Rate of change of photoperiod averaged over 7 days (minutes per day) for the study period.

Temperature
Daily temperatures ranged from a minimum of -0.5 degrees to a maximum of 29.1 degrees Celsius. The model examining the effect of mean temperature fit better than intercept-only (LR χ2 = 39.48, df = 18, p = 0.002). As in the other models, day of week was significant (p = .002), but month was not (p = 0.095), and there was mild overdispersion (deviance/df = 1.335; Pearson χ2/df = 1.219). Temperature had a small yet clear positive association with presentations (B = 0.022 per °C; IRR per 1°C = 1.022, 95% CI 1.009–1.035; Wald χ2 = 11.23, p < 0.001). Scaling to changes of +5°C, there was a corresponding increase in presentations by 11.6% (IRR ≈ 1.116), assuming linearity over that range.
For minimum temperature, the regression model predicted presentation counts better than intercept-only (LR χ2 = 53.04, df = 18, p < 0.001) with a significant day of the week (p < 0.001) and month (p = 0.009) effect. There was mild overdispersion (deviance/df = 1.334; Pearson χ2/df = 1.216). Minimum temperature had a slightly stronger, but still small, association with presentations (B = 0.023 per °C; IRR per 1°C = 1.023, 95% CI 1.012–1.035; Wald χ2 = 15.2, p < 0.001). The effect of maximum temperature was less pronounced (B = 0.014 per °C; IRR per 1°C = 1.014, 95% CI 1.002–1.026; Wald χ2 = 5.17, p = 0.023). The regression model fitted better than the intercept-only model (LR χ2 = 40.56, df = 18, p = 0.002) with day of the week (p < 0.001) but not month (p = 0.207) effects and mild overdispersion (deviance/df = 1.338; Pearson χ2/df = 1.221).
Precipitation
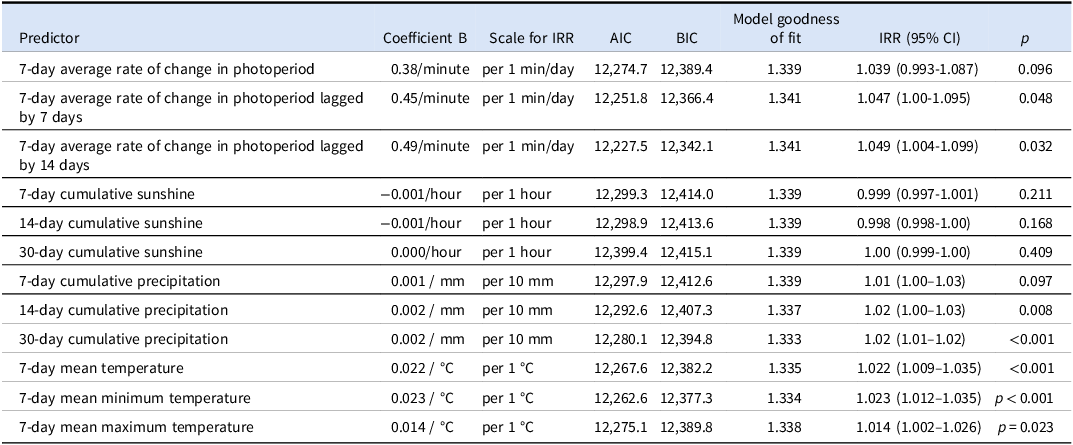
Relative to intercept-only models, precipitation and calendar covariates significantly improved fit for 7-, 14-, and 30-day cumulative windows (LR χ2 (18) = 31.6, 36.0, and 46.4; p = 0.024, 0.007, <0.001). Goodness-of-fit showed mild extra-Poisson variance (Deviance/df 1.339, 1.337, 1.333; Pearson χ2/df 1.221, 1.219, 1.216) and information criteria favoured longer windows (see Table 3). Similar to the photoperiod models, day-of-week was strongly associated with presentations (p ≤ 0.002) and month was not significant (p = 0.443 – 0.733). The effects of cumulative precipitation were small and positive, strengthening with longer accumulation windows: 7-day IRR 1.01 per 10 mm (95% CI 1.00–1.03; Wald χ2 = 2.75, p = 0.097), 14-day IRR 1.02 (1.00–1.03; p = 0.008), and 30-day IRR 1.02 (1.01–1.02; p < 0.001). Assuming linearity across these ranges, a 50 mm increase corresponds to ∼+5% presentations (7-day; IRR≈1.05) versus ∼+11% (14-/30-day; IRR≈1.11), and 100 mm corresponds to ∼+10.5% (7-day) vs ∼+22% (14-/30-day). In summary, rainfall shows a small but positive association with daily ED presentations that becomes statistically clearer and provides better model fit when precipitation is accumulated over 14–30 days though the magnitude of the effect is modest compared with the day-of-week variation. Month-of-year adds little to the model after accounting for day of week.
Meteorological predictors of presentations

Table 3. Long description
A table with 13 rows and 8 columns comparing meteorological predictors of presentations. The columns are Predictor, Coefficient B, Scale for IRR, AIC, BIC, Model goodness of fit, IRR (95% CI), and p. The rows list different predictors such as 7-day average rate of change in photoperiod, 7-day cumulative sunshine, 7-day cumulative precipitation, 7-day mean temperature, and others. Each row provides specific values for each column, detailing the statistical analysis of how these meteorological factors influence presentations. Notable trends include the strengthening effects of cumulative precipitation over longer accumulation windows and the significant association of day-of-week with presentations.
AIC = Akaike’s information criterion.
BIC = Bayesian information criterion.
IRR = incidence rate ratio.
Goodness of fit: (deviance/df).
Sunshine hours
No significant association was found between cumulative sunshine with daily presentations within 7-day, 14-day, or 30-day accumulation windows (p = 0. 212; p = 0.168); p = 0.409).
Discussion
This large study of prospectively collected data of presentations of suicidal ideation or self-harm to one ED over an eight-year period examined the association between the rate of such presentations with seasonality (day, month, and photoperiod) and meteorological variables (average, minimum, and maximum temperature, precipitation, and sunshine hours). The daily volume of presentations over the study timeframe more than doubled. There was a significant day-of-week variation, with a surge in presentations at the start of the week (Monday to Wednesday) and lowest number of presentations at weekend. This had a greater impact than the effect of month of the year. The rate of photoperiod change showed a delayed association, becoming significant when lagged by one or two weeks. Higher ambient temperatures were associated with increased presentations, and this was more significant for minimum and mean temperature than for maximum temperature. Prolonged accumulation of rainfall was also associated with modest increases in presentations. There was no correlation between cumulative hours of sunshine.
The outcome of interest in the present study, ED presentations for suicidal ideation/self-harm, reflect help-seeking and service use, which may be modulated by access and referral pathways, and social rhythms (McEvoy et al. Reference McEvoy, Clarke and Joyce2023). Our finding that presentations were heavily weighted towards the start of the week, with only 26.8% occurring during the weekend, is lower than the 30.6% of weekend presentations observed in national Irish data predating the implementation of the NCPSHI (Arensman et al. Reference Arensman, Griffin, Daly, Corcoran, Cassidy and Perry2018) and the wider international literature of a preponderance of weekend presentations (McEvoy et al. Reference McEvoy, Clarke and Joyce2023). The greater presentations at the start of the week could be due to local service delivery structures, including perceived staffing and access, or potentially due to delayed effects from weekend consumption of intoxicant substances.
While we did observe a peak in presentations in May, our overall model for month effects was not significant, which supports previous reports that “seasonality” is not fully represented by categorical month/season variables, but may be influenced by the rapid changes of the environment and social rhythms (Yu et al. Reference Yu, Yang, Kim, Hashizume, Gasparrini and Armstrong2020). Our findings that a higher rate of change of photoperiod, lagged by one or two weeks, was associated with greater subsequent presentations suggests that the relationship is mediated by downstream behavioural and physiological adaptations, such as circadian dysregulation in vulnerable individuals (Walker et al. Reference Walker, Walton, DeVries and Nelson2020), rather than direct same-day exposure to daylight. This significant effect from photoperiod also supports previous data from regions with more extreme annual photoperiod variations (Akkaoui et al. Reference Akkaoui, Chan-Chee, Laaidi, Fifre, Lejoyeux, Vaiva, Peyre and Geoffroy2022; Björkstén et al. Reference Björkstén, Kripke and Bjerregaard2009; Coimbra et al. Reference Coimbra, de Miranda Coelho and de Andrade2026; Heerlein et al. Reference Heerlein, Valeria and Medina2006).
The positive association between ambient temperature and presentations in our data mirrors a larger literature on suicide risk and exposure to higher temperatures. Although effect sizes are not large on the per-degree scale, they are significant at a population level, particularly during warmer weather or when the size or seasonal difference in temperature is important (Gao et al. Reference Gao, Cheng, Duan, Xu, Bai, Zhang, Zhang, Wang, Zhang and Su2019). In contrast to other studies (Frangione et al. Reference Frangione, Villamizar, Lang, Colman, Lavigne, Peters, Anisman and Villeneuve2022; Gao et al. Reference Gao, Cheng, Duan, Xu, Bai, Zhang, Zhang, Wang, Zhang and Su2019; Li et al. Reference Li, Zhang, Li, Zhang, Lu and Brown2023), the association with higher minimum temperatures was more significant than that of maximum temperature, which suggests the influence of unique local factors. In Ireland, the maximum temperature ever recorded is 33 degrees Celsius, and in our study, the maximum temperature observed was 29.1 degrees Celsius. Warmer overnight temperatures might potentially disrupt sleep to a greater extent in this temperate climate with limited domestic air conditioning use. Despite limited exposure to extremes of high temperature, this magnitude of increase is similar to that experienced internationally. This is particularly pertinent given the impact of global warming and adds further evidence that the burden of suicide and self-harm will increase at a population level with rising temperatures (Zhou et al. Reference Zhou, Gao, Yin, He, Liu, Kan, Zhou and Chen2023).
In the present study, precipitation only had a weak positive relationship which became stronger with increasing accumulation windows, which may correspond with sustained wet weather rather than near-term precipitation, which could be acting through diminished outdoor activity, social withdrawal, sleep disturbance or broader seasonal contextual factors. This finding adds a further dimension to the literature as rainfall has been mainly analysed as an immediate association with mixed evidence of no effect or a protective effect against self-harm or suicide (Saulnier and Bagge Reference Saulnier and Bagge2024). However, given the modest magnitude of effect, it is best read as a secondary, context-sensitive correlate. Our negative findings for cumulative sunshine hours are consistent with more recent higher quality data though the available literature is heterogeneous (Frangione et al. Reference Frangione, Villamizar, Lang, Colman, Lavigne, Peters, Anisman and Villeneuve2022; Gao et al. Reference Gao, Cheng, Duan, Xu, Bai, Zhang, Zhang, Wang, Zhang and Su2019). Specific to Ireland, our findings contrast to observations that lower levels of sunshine worsen depressive symptoms in older adults (O’Hare et al. Reference O’Hare, O’Sullivan, Flood and Kenny2016) and higher levels are weakly associated with admissions for psychosis (McWilliams et al. Reference McWilliams, Kinsella and O’Callaghan2013).
Clear seasonal patterns have been established in many mental disorders that may be associated with elevated suicide risk. In bipolar disorder, manic episodes peak during summer months and depressive episodes occur more frequently during winter (Fellinger et al. Reference Fellinger, Waldhoer, König, Hinterbuchinger, Pruckner, Baumgartner, Vyssoki and Vyssoki2019). It has been determined that living in a location with large fluctuations of daylight from winter to summer is associated with greater likelihood of suicide attempts in people with bipolar disorder (Bauer et al. Reference Bauer, Glenn, Achtyes, Alda, Agaoglu and Altınbaş2021). There is some evidence that psychiatric hospitalisations for schizophrenia spectrum disorder are seasonally variable, with admission peaks during the summer and in association with warmer weather (Jahan et al. Reference Jahan, Wraith, Dunne, Naish and McLean2020). The evidence for seasonality of clinical depression appears to suggest a winter peak though with significant heterogeneity of the literature (Øverland et al. Reference Øverland, Woicik, Sikora, Whittaker, Heli, Skjelkvåle, Sivertsen and Colman2019). Higher temperatures and heatwaves, in addition to being associated with increased suicidality, are also associated with increases in mental health hospitalisations and adverse mental health outcomes (Li et al. Reference Li, Zhang, Li, Zhang, Lu and Brown2023; Liu et al. Reference Liu, Varghese, Hansen, Xiang, Zhang, Dear, Gourley, Driscoll, Morgan, Capon and Bi2021; Thompson et al. Reference Thompson, Lawrance, Roberts, Grailey, Ashrafian, Maheswaran, Toledano and Darzi2023). In summary, meteorological and photoperiodic changes can modulate illness course in vulnerable population and trigger suicidal activity.
Clinical and service implications
The findings of this study have implications for population health and service planning. The observed peak in presentations during the late spring and early summer, along with increased presentations from Monday to Wednesday should be considered in health service policy and planning. As is the case for the annual peak of viral infections during winter months, a strategy for managing predictable escalations in demand should be built into regular health service operations. At a service level, ED and liaison psychiatry services should ensure staffing and workflow accommodates early-week surges, such as through expedited triage pathways, and the availability of sufficient trained mental health professionals to complete biopsychosocial assessments and arrange timely appropriate follow-up.
While change in photoperiod and weekly calendar effects follow a predictable pattern, the weather in Ireland is changeable on a day to day, and even hour to hour level, and so the usefulness of short-term predictors of presentations based on meteorological variables is limited. That said, the effects of climate change in Ireland, through prolonged spells of heavy rainfall and warmer than average temperatures, should influence funding policy decisions to ensure resourcing matches forecasted demand.
Strengths and limitations
This study has several strengths. A complete dataset that was prospectively recorded in a standardised format over a long study period was utilised. There were a large number of presentations, and the statistical methods controlled for confounding calendar effects. This is also the first such study examining presentations of self-harm and suicidal ideation in an Irish population. There are several important limitations. The main limitation is the measurement of weather effects relating to the location of the ED rather than the patient address or place of work. Local conditions may differ significantly from that experienced at the weather station, particularly for sunshine hours and precipitation, though photoperiod can be considered stable across the region, as can temperature to a large extent. The ecological design, with data measured at a daily count level, precludes viewing the findings as individual-level causal effects. Like much of the extant literature on meteorological associations with suicidality, it is not possible to measure individual exposure to these variables, and there is undoubtedly many unmeasured covariates and mediators that influence the associations such as service provision changes over time, public events, school/work hours, substance use patterns, or other social factors. The study arose from a single ED, albeit the main department for a large geographical region and population. As only ED presentations were captured, it is not possible to measure the incidence of self-harm or suicide-related death in the region that did not come to the attention of the service. The mild over dispersion in all models suggests that there are unmeasured clustering or time-varying factors. Additionally, many findings only just reached statistical significance and so there is a risk of type 1 error. Finally, it is also important to highlight that, as with any observational study, causation cannot be proven.
This study adds to the data gap on the Irish population in relation to suicidality and self-harm, and future studies should include multi-centre or national data over longer time periods to fully elucidate the link with location-specific photoperiod and meteorological variables and to allow subgroup analysis such as by sex/gender and age.
Conclusion
Our findings indicate that presentations for suicidal ideation and self-harm to an ED display robust weekly patterning and associations with day length in an Irish population. We also found smaller, but potentially operationally relevant, links to temperature and sustained precipitation. Like much of the suicide literature, the usefulness of this study lies at a population health and service planning level rather than providing insights into individual interventions for suicide prevention. Peaks in service demand across the week and year are predictable and developing surge capacity to address such demands should be a priority in health service policy and governance.
Acknowledgements
The authors used Paperpal to enhance the wording and grammar of this manuscript. AI was not used to generate content de novo. All content has been reviewed, and the authors take full responsibility for the final text.
Funding statement
This research received no specific grant from any funding agency, commercial or not-for-profit sectors.
Competing interests
None.
Ethical standards
The authors assert that all procedures contributing to this work comply with the ethical standards of the relevant national and institutional committee on human experimentation with the Helsinki Declaration of 1975, as revised in 2008.


 Open access

