

I. INTRODUCTION
The safety and reliability of current and future generations of nuclear reactors can be advanced if the behavior of fuels and cladding materials during normal operation and accident scenarios is well understood. Nuclear fission results in fission fragments with a mass of the order of 100 amu and kinetic energy around 100 MeV. As these particles slow down, they create damage tracks in the material. Radiation damage in fuel, typically UO2, has a negative influence on thermal conductivity, Reference Ronchi, Sheindlin, Staicu and Kinoshita1 fuel pellet integrity, Reference Fuketa, Sasajima, Mori and Ishijima2 and fission product retention. Reference Rondinella and Wiss3 Examination of nuclear fuel irradiated in a reactor suffers from the drawbacks that it usually takes a long time to accumulate damage and the fuel cannot be examined right away because of high radioactivity. There are only a few radiological facilities where nuclear fuel can be examined. Given the extensive radiological controls needed to handle irradiated UO2, there is considerable interest in the use of isostructural surrogates, such as CeO2, to understand damage evolution in nuclear fuel. Reference Ishikawa, Sonoda, Sawabe, Sugai and Sataka4–Reference Weber8 CeO2 is a known surrogate of UO2 when investigating defect behavior. However, Weber Reference Weber8 has shown that the radiation-induced lattice parameter changes in these two oxides are qualitatively similar but quantitatively different. Moreover, the valence states of CeO2 differ from UO2, and thus, the chemical changes due to irradiation can be different in these oxides. There is limited comparative data on swift heavy ion irradiation effects in these two oxides, which is a deficiency that this manuscript aims to address by generating such data for CeO2.
Electronic stopping is a mechanism in which target electrons are excited by the bombarding ion, creating a dense electron cascade, which affects the lattice by producing an amorphous ion track, a trail of defect clusters, or crystalline-to-crystalline phase transformation. Reference Lang, Zhang, Zhang, Ewing, Tracy, Cusick, VonEhr, Chen and Trautmann9–Reference Benyagoub, Couvreur, Bouffard, Levesque, Dufour and Paumier11 Fission fragment damage created within the electronic stopping regime, while traditionally studied to a lesser extent than nuclear stopping damage, still affects thermal transport, swelling, cracking, and overall fuel performance. Reference Ronchi, Sheindlin, Staicu and Kinoshita1,Reference Fuketa, Sasajima, Mori and Ishijima2 Nuclear stopping is active when the bombarding ion directly interacts with the target nuclei, creating an atomic collision cascade and forming defects or amorphous regions. Defects can range from point defects to defect clusters. Electronic stopping dominates at high specific energies (energy deposited per unit length), while nuclear stopping dominates at low specific energies. Being based on elastic atom collisions, damage created by nuclear stopping is very efficient and occurs in any kind of material. In contrast, track formation by electronic stopping takes place predominantly in insulators and only in selected semiconducting and metallic materials. Reference Toulemonde, Trautmann, Balanzat, Hjort and Weidinger12–Reference Trautmann, Hellborg, Whitlow and Zhang14 The formation of a visible track by transmission electron microscope (TEM) is dependent on both the material and the electronic energy deposited per unit track length (dE/dx). Insulators have a much higher sensitivity to electronic stopping, with a threshold as low as ∼1 keV/nm, whereas the threshold for metals can be as high as 50 keV/nm. Reference Toulemonde, Trautmann, Balanzat, Hjort and Weidinger12–Reference Trautmann, Hellborg, Whitlow and Zhang14 Since the electronic energy loss scales with the square of the charge state of the projectiles, heavy ions damage more efficiently than light ions. The process of damage creation by electronic stopping is complex, because it involves several steps from initial energy deposition in the electronic subsystem to energy dissipation as heat. The description of this process is often simplified by invoking a thermal spike. Reference Toulemonde, Assmann, Dufour, Meftah, Studer, Trautmann and Sigmund13
Ion track formation is a quick process that is finalized within the first 10−10 seconds after bombardment with the incident ion. In the first 10−17 to 10−16 seconds, the energy is deposited by electronic excitation and ionization, creating a large number of “hot” electrons. In the time frame of 10−15 to 10−14 seconds, there is an electron cascade, in which energy diffuses within the electronic subsystem and the cooling of “hot” electrons takes place. Between 10−13 and 10−12 seconds, energy in the electronic system is transferred to the atoms and electron–phonon interaction causes lattice heating and localized melting. Then, usually by 10−12 seconds in metals and 10−10 seconds in insulators, atomic disorder quenches and defects form. Some in-track damage mechanisms such as exciton decay to Frenkel defects may occur more slowly over the microsecond timescale. Reference Schwartz, Trautmann and Neumann15 A more detailed description and a schematic can be found in Zhang et al. Reference Zhang, Lang, Ewing, Devanathan, Weber and Toulemonde16 The short time and distance scales prevent reliable experimental characterization of these transient processes. At the same time, the high specific energies deposited and large system sizes needed to describe the process preclude the use of density functional theory calculations. In simulations, the process described above is represented by a thermal spike that models the local heating. Reference Lang, Devanathan, Toulemonde and Trautmann17,Reference Wang, Lang, Ewing and Becker18 In this model, a localized cylinder within the structure is heated instantaneously to a temperature above the melting point and allowed to come to equilibrium with the surrounding material which is held at a constant temperature close to room temperature. Reference Bacon and Diaz de la Rubia19,Reference Berendsen, Postma, van Gunsteren, Dinola and Haak20
In view of the relevance of CeO2 to nuclear fuel performance and safety, several studies have characterized defects produced by ion implantation in CeO2 by means of diffraction contrast imaging in a TEM. A previous experimental study Reference Sonoda, Kinoshita, Chimi, Ishikawa, Sataka and Iwase7 has shown that the average diameter of ion tracks in CeO2 increases linearly with increasing irradiation energy and can be estimated based on electronic stopping power. The study investigated Xe, I, and Zr ions in the energy range of 70–210 MeV (∼17–27 keV/nm) and presented results based on bright field transmission electron microscopy (TEM) observations. Reference Sonoda, Kinoshita, Chimi, Ishikawa, Sataka and Iwase7 The highest energy ion, Xe14+ at 210 MeV, produced an ion track diameter of approximately 9.3 nm. Such a large track diameter has also been observed by Sonoda et al. Reference Sonoda, Kinoshita, Ishikawa, Sataka, Chimi, Okubo, Iwase and Yasunaga21 In more recent studies, Reference Yasuda, Etoh, Sawada, Yamamoto, Yasunaga, Matsumura and Ishikawa6,Reference Takaki, Yasuda, Yamamoto, Matsumura and Ishikawa22 examining ceria irradiated with 200 and 210 MeV Xe ions (electronic stopping of 27 and 29 keV/nm, respectively) using TEM, weak beam dark field TEM, scanning transmission electron microscopy (STEM), high-angle annular dark-field (HAADF) imaging, and annular bright field imaging, a smaller track diameter of about 2–5 nm was found. Furthermore, it was concluded that the track diameter varies with distance from the sample surface Reference Yasuda, Etoh, Sawada, Yamamoto, Yasunaga, Matsumura and Ishikawa6 ; crystallinity is retained in the ion track Reference Yasuda, Etoh, Sawada, Yamamoto, Yasunaga, Matsumura and Ishikawa6,Reference Takaki, Yasuda, Yamamoto, Matsumura and Ishikawa22 ; and the core of the ion track has a slightly lower density than the unirradiated material. Reference Takaki, Yasuda, Yamamoto, Matsumura and Ishikawa22 The origin of the discrepancy in track sizes between the above mentioned studies Reference Yasuda, Etoh, Sawada, Yamamoto, Yasunaga, Matsumura and Ishikawa6,Reference Sonoda, Kinoshita, Chimi, Ishikawa, Sataka and Iwase7,Reference Sonoda, Kinoshita, Ishikawa, Sataka, Chimi, Okubo, Iwase and Yasunaga21,Reference Takaki, Yasuda, Yamamoto, Matsumura and Ishikawa22 is not well understood. Takaki et al. Reference Takaki, Yasuda, Yamamoto, Matsumura and Ishikawa22 attribute it to a complex ion track morphology wherein a small, vacancy-rich track core is surrounded by a larger interstitial defect-rich track shell. Such a heterogeneous track morphology has been previously observed in isostructural ThO2 following swift heavy ion irradiation. Reference Tracy, McLain Pray, Lang, Popov, Park, Trautmann and Ewing23 This raises the issue of the definition of an ion track. The assumption of an abrupt boundary between a damage track and undamaged material is simplistic. The “track size” is dependent on the feature that is being recorded under a particular imaging condition and is defined as the region giving rise to the feature. Depending on the characterization technique used, the region giving rise to the observation can differ, and hence the “track size” can vary slightly between the observation techniques as well as varying with distance from the sample surface. This discrepancy creates a need for improved understanding of the track structure evolution process, density changes, and interstitial loop formation. The simulations in the present work serve this purpose.
The aim of the present work is to integrate swift heavy ion irradiation, electron microscopy, and parallel molecular dynamics (MD) simulations to understand the atomic-level details of the early stages of damage production in CeO2. The computer simulation was not intended to exactly reproduce the experimental conditions, but instead, to study damage evolution under two different stopping power scenarios and interpret experimental observations. The experimental part of this study was performed by bombarding cerium dioxide with 940 MeV gold ions, which induce very little damage due to nuclear stopping. The electronic stopping value of 42 keV/nm in the present study is higher than the value of 27 keV/nm investigated in previous experimental studies thereby extending the range of experimental observations in swift heavy ion irradiated ceria. The ion track structure seen by STEM is compared to a thermal spike model of a single ion track. The present study provides quantitative information about density changes in the ion track and surrounding regions and supports the experimental inference about lower density in the track core from previous studies. Reference Yasuda, Etoh, Sawada, Yamamoto, Yasunaga, Matsumura and Ishikawa6,Reference Bacon and Diaz de la Rubia19,Reference Takaki, Yasuda, Yamamoto, Matsumura and Ishikawa22,Reference Kluth, Schnohr, Sprouster, Giulian, Ridgway, Pakarinen, Djurabekova, Nordlund, Byrne, Trautmann, Cookson and Toulemonde24,Reference Pakarinen, Djurabekova, Nordlund, Kluth and Ridgway25 Such density changes have also been observed following swift heavy ion irradiation of SiO2. Reference Kluth, Schnohr, Sprouster, Giulian, Ridgway, Pakarinen, Djurabekova, Nordlund, Byrne, Trautmann, Cookson and Toulemonde24,Reference Pakarinen, Djurabekova, Nordlund, Kluth and Ridgway25 It offers insights about ion track evolution during experimentally inaccessible time scales, defect production, and interstitial loop formation. Additionally, the inferences drawn in this paper will contribute information that can be used in future multiscale models, which traditionally do not account for electronic stopping when investigating microstructure evolution during irradiation.
II. EXPERIMENTAL DETAILS
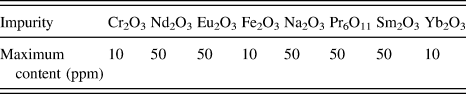
High purity polycrystalline bulk ceria pellets were sourced from Alfa Aesar (Ward Hill, MA). The ceria had a grain size of 5 μm, a density of 6.9 g/cm3, and a purity of 99.9%, with the impurities listed in Table I. The pellets, 9 mm in diameter, were sectioned into 1 mm thick disks. The individual disks were polished on an Allied MultiPrep parallel polisher (Rancho Dominguez, CA), beginning with 30 μm diamond lapping film, and continuing to decrease to 0.5 μm diamond lapping film.
List of impurities in the 99.9% pure CeO2 used in this study.

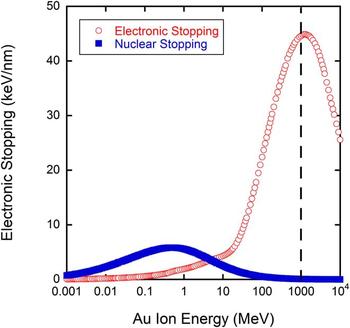
Using the M branch at the Universal Linear Accelerator (UNILAC) of the Gesellschaft für Schwerionenforschung (GSI) in Darmstadt, Germany, the ceria samples were irradiated to fluences of 1 × 10¹² to 1 × 10¹⁴ ions/cm2 using a mean flux of 6 × 10⁹ ions/s cm2. The energy of 940 MeV is equivalent to 4.77 MeV/u, where u is the unified atomic mass unit of the bombarding ion. The energy of 940 MeV was chosen because the contribution from electronic stopping is very high at this energy (42 keV/nm), highlighted in Fig. 1 by a dashed line, while contributions from nuclear stopping would be at a minimum. The range of 940 MeV Au ions is ∼32 µm, thus much larger than the typical TEM sample thickness. Range as well as electronic and nuclear stopping power were calculated using the SRIM-2008 code. Reference Ziegler26 Kinchin-Pease damage calculations were used in accordance with Stoller et al., Reference Stoller, Toloczko, Was, Certain, Dwaraknath and Garner27 using the pellet density of 6.9 g/cm3, and displacement threshold energies of 33 and 44 eV for O and Ce, Reference Yasunaga, Yasuda, Matsumura and Sonoda28 respectively.
Contributions from electronic and nuclear stopping in CeO2 as a function of the energy of gold ions. The energy of 940 MeV was chosen to maximize electronic stopping, indicated by the dashed line.

After irradiation, samples were cut into 3 mm disks using an ultrasonic drill. The disks were thinned from the unirradiated side using a parallel polisher to ∼200 μm, then dimple polished using 6 μm diamond paste to ∼100 μm, then 1 μm diamond paste to ∼20 μm. The disks were then ion polished from both sides using a Fischione 1010 Ar ion mill (Export, PA) in a low angle stage, resulting in a sample with a hole surrounded by an electron transparent region appropriate for viewing in TEM. Because of this procedure, it is estimated that the depth investigated by TEM was ∼10 μm from the irradiated surface, where the electronic stopping power is still close to ∼42 keV/nm. A Philips CM200UT TEM in bright field mode and an FEI-Titan in STEM mode using the HAADF detector were used for imaging the irradiation damage. Ion track diameter was measured by manual size determination using the ImageJ v1.44p analysis tool. Reference Rasband29 The process involved tracing and filling in each track in the bright field TEM image in an in-focus condition and thresholding to leave only spots that represented the ion tracks. The spots are then measured using the “Analyze particles” feature, which will report the area of each “particle”. The diameter was then calculated from the area measurement. More than 350 ion tracks were measured from each sample, and the number density was calculated by using the number of tracks measured in the image divided by the area interrogated, in cm2. The uncertainty of the deduced track size is equivalent to the standard deviation. Electron energy loss spectroscopy was performed on the Titan TEM, using a corrected electron optical systems (CEOS) probe aberration corrector (Heidelberg, Germany) at 300 keV aligned for a <1 nm resolution. The spectra were taken in energy filtered STEM (EF-STEM) mode with 24.5 mrad convergence angle, a spectrometer energy resolution of 0.8, and a 0.4 eV per channel dispersion. Data presented is a summation of 10 collection integrations lasting 2 s each, and then background-subtracted. Each spot was investigated once due to possible electron beam damage. However, multiple spots were investigated to assure spectrum repeatability. The sample thickness was measured using EELS and was below 0.5 of the electron inelastic mean free path (λ) for all investigated spots, which assures that the sample was thin enough to give accurate results.
III. THERMAL SPIKE MODEL DETAILS
Classical MD simulations were performed to model the effects of swift heavy ion irradiation of CeO2. The DL_POLY4 code Reference Todorov, Allan, Purton, Dove and Smith30 was used to carry out the MD simulations and the atomic positions of the results were visualized using the VMD program. Reference Humphrey, Dalke and Schulten31 The simulation was initiated with ceria in the cubic fluorite structure. The simulation cells contained 2,400,000 ions (100 × 100 × 20 unit cells) for an energy deposition of 12 keV/nm and 11,059,200 ions (160 × 160 × 36 unit cells) for an energy deposition of 36 keV/nm. These energy deposition values represent thermal energy deposition and are thus not directly comparable to experimental stopping power (dE/dx) values. The energy deposition values were chosen to represent two different damage conditions that may be relevant to the experiment. The simulation cell was initially equilibrated in Berendsen's isothermal isobaric ensemble Reference Berendsen, Postma, van Gunsteren, Dinola and Haak20 at 300 K and zero external pressure for 10 ps with a time step of 1 fs.
The potential model and parameters from the work of Sayle et al. Reference Sayle, Parker and Sayle32 were used to describe the interactions between the ions. A spline curve was used to join the Sayle potential to the Ziegler–Biersack–Littmark potential Reference Ziegler26 to avoid unphysical attraction between the ions at close separations. The Sayle potential Reference Sayle, Parker and Sayle32 is based on Born model of the ionic solid where the ionic interaction includes long-range Coulombic terms and short-range interactions, V(r), that have the following form.
 $$V\left( {{r_{ij}}} \right) = {A_{ij}}\exp \left( { - {{{r_{ij}}} \over {{\rho _{ij}}}}} \right) - {{{C_{ij}}} \over {\mathop {{r_{ij}}}\nolimits^6 }}\quad ,$$
Here, r ij is the distance between ions i and j, while A ij , ρ ij , and C ij are potential parameters fitted by Sayle et al. Reference Sayle, Parker and Sayle32 The ions have formal charges, i.e., +4 for Ce and −2 for O. The smooth particle mesh Ewald method Reference Essmann, Perera, Berkowitz, Darden, Lee and Pedersen33 was used to calculate the electrostatic part of the potential with a tolerance factor of 10−5.
Due to computational resource limitations, it is not feasible to directly simulate the passage of a swift heavy ion through a ceramic or the resulting electronic excitations. Instead, a thermal spike in the form of a cylinder along the shorter Z axis of the cell was introduced, which coincided with the [001] crystallographic direction. The thermal spike had a Gaussian profile of kinetic energy distribution in the X–Y plane with a standard deviation of 2 nm. This spike was chosen to facilitate comparison with previous simulations of swift heavy ion damage in pyrochlores Reference Devanathan, Gao and Sundgren34 that used a similar profile. The spike was described in detail in previous work. Reference Kumar, Devanathan, Shutthanandan, Kuchibhata, Karakoti, Yong, Thevuthasan and Seal35 The kinetic energy of ions in the spike was increased instantaneously at time t = 0 by assigning velocities in random directions, which correspond to energy deposition per unit length of 12 or 36 keV/nm. As stated previously, these values of thermal energy deposition per unit length correspond to higher values of experimental electronic stopping, because the electron–phonon coupling efficiency in real materials is less than unity. The exact value of this efficiency is not known for ceria. After the introduction of the spike, MD simulations were performed with the constant volume constant energy ensemble for about 60 ps with variable time steps from 0.2 to 1 fs. In an effort to dissipate the deposited energy, the walls of the simulation cell were coupled, in the X and Y directions, over a thickness of 0.5 nm to a heat bath maintained at 300 K. These massively parallel simulations were performed with up to 1296 processors using computers at the National Energy Research Scientific Computing Center. Defects were identified based on the coordination number (CN) of the ions being different from that in the fluorite crystal. The occupation of Voronoi polyhedra centered on lattice sites was determined to identify vacancies, interstitials, and replacements. This method can be unreliable in regions of heavy damage or if there are amorphous clusters, and therefore the structure of the damaged regions was determined by calculating radial distribution functions (RDFs) and densities from concentric cylinders centered on the thermal spike.
IV. UNDERSTANDING IRRADIATION BEHAVIOR
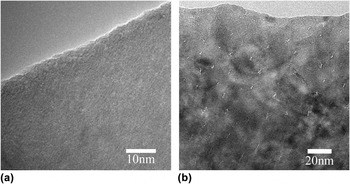
Ion tracks were confirmed using bright field TEM by tilting the sample and imaging the sample in a slightly underfocused condition to check for the appearance of Fresnel contrast, a technique used in other swift heavy ion irradiation studies on CeO2. Reference Yasuda, Etoh, Sawada, Yamamoto, Yasunaga, Matsumura and Ishikawa6,Reference Sonoda, Kinoshita, Chimi, Ishikawa, Sataka and Iwase7,Reference Takaki, Yasuda, Yamamoto, Matsumura and Ishikawa22 Figure 2 shows a representative image from an as-received sample showing no damage during preparation and a representative image of the sample irradiated to 1 × 10¹⁴ ions/cm2 showing the ion tracks formed during irradiation. The tracks in the irradiated sample become shorter closer to the edge of the foil (top of the image) because of the decreasing foil thickness.
Bright field TEM of (a) an as-received sample with no damage due to sample preparation and (b) the sample irradiated to 1 × 10¹⁴ ions/cm2 in a tilted condition to highlight the ion tracks. The track length decreases closer to the edge of the foil due to the foil thickness. Note the difference in scales.

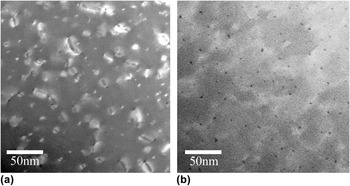
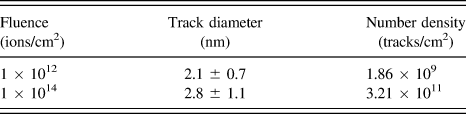
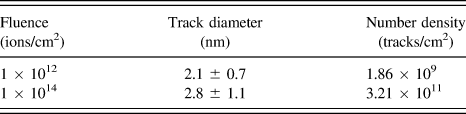
Representative substructures from samples irradiated at 940 MeV (to fluences of 1 × 10¹² and 1 × 10¹⁴ ions/cm2) are presented in Fig. 3. The ion track diameter was analyzed for both fluences and no statistical difference was found, as reported in Table II, indicating that track diameter is independent of fluence. This result is in agreement with the findings of Sonoda et al. Reference Sonoda, Kinoshita, Chimi, Ishikawa, Sataka and Iwase7 given that the ion tracks were formed at the same electron stopping power, and therefore, should be the same size. The diameter of the ion tracks found in this work is similar to previous results, Reference Takaki, Yasuda, Yamamoto, Matsumura and Ishikawa22 where STEM was also used for ion track observation. The number density of tracks was also calculated and is reported in Table II. In both samples, the observed number density of tracks is less than the applied fluence, which would be the expected number density without track overlapping. Using Poisson's law to determine the probability of track overlap, Reference Ishikawa, Ohhara, Ohta and Michikami36 the probability of track overlap is 3.4 and 99.8% for 1 × 10¹² and 1 × 10¹⁴ ions/cm2, respectively. Yasuda et al. Reference Yasuda, Etoh, Sawada, Yamamoto, Yasunaga, Matsumura and Ishikawa6 provide an interesting explanation for this observation by identifying a small core damage region visible by TEM and a larger surrounding region, i.e., influenced by the track. Previously produced tracks are erased in the latter region as a result of a recovery process related to the heterogeneous structure of the track—vacancy-rich core surrounded by interstitial-rich periphery. Consequently, the observed number fraction will be smaller than the fluence, a trend also reported in other studies. Reference Zelaya, Tolley, Condo and Schumacher37
STEM images using the HAADF detector of the samples irradiated with 940 MeV Au ions to (a) 1 × 10¹² and (b) 1 × 10¹⁴ ions/cm2. Note: In HAADF, dislocations appear as white/light gray and ion tracks appear as black/dark gray spots.

Ion track diameter and number density of ion tracks for each fluence, with uncertainty, determined by TEM.
Dislocations were also seen in both samples, and while no dislocation analysis was done due to fracture of the samples after initial investigation, some qualitative observations can be made. For the 1 × 10¹² ion/cm2 sample, shown in Fig. 3(a), dislocation loops in a range of sizes, seen as small and large white features, have formed, and many appear to be associated with an ion track, seen as a dark dot. In the 1 × 10¹⁴ ions/cm2 sample, shown in Fig. 3(b), the dislocation loops have grown and coalesced into a dislocation network, light gray lines/areas, connected between the ion tracks. The result matches the expectation that continued bombardment of the sample adds disorder due to additional defects produced from the ion track, and that these defects will contribute to dislocation growth. When modeling the irradiation process, our observations indicate that the amount of atoms considered must be large enough for forming dislocations to understand all structural information.
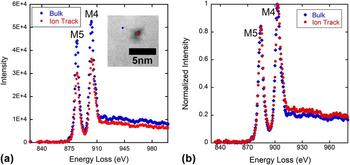
To further understand the structure of the ion track, EELS was performed next to an ion track in the bulk material, and within an ion track, and the results are presented in Fig. 4. EELS probes the material chemistry, specifically the reduction of cerium from Ce4+ to Ce3+, by peaks at specific energy loss values. The reduction, if present, is highlighted by (i) a decrease in energy loss of the M5 and M4 maxima, (ii) a change in the near-edge structure shapes, (iii) inversion of the M5 to M4 branching ratio, and (iv) an increase in the M5 to M4 area ratio. If the reduction is significant, these changes would be evident, as highlighted in prior work. Reference Garvie and Buseck38 For EELS investigation of our sample, there was a slight change in energy loss for the M5 and M4 maxima for the ion track of 1.2 eV less and 0.8 eV less, respectively. These changes are within the energy resolution of the spectrometer, and thus no conclusive evidence of reduction is observed. For criterion two, the shape of the curve is the same when accounting for the resolution of the spectrometer. The branching ratios, criterion three, are both 0.45, and the area ratio, the fourth criterion, has not changed for the ion track, indicating no reduction. As an additional confirmation, if there was a reduction from Ce+4 to Ce+3, the M5 peak would broaden to the point of incorporating the near edge structure, as seen in Ref. Reference Garvie and Buseck38, and that is not the case here. Furthermore, given the same measurement technique, the decrease in the intensity for the ion track compared to the bulk indicates a decrease in the number of atoms in the interrogated area, interpreted as a small density reduction in the ion track core.
EELS results, presented as energy loss (eV) versus intensity. M5 and M4 are the specific spectra that represent Ce. (a) Original data, where decrease in intensity is likely due to a lower number of atoms within the ion track. The inset image shows the spots in which the data were taken, blue diamond: in the bulk, and red circle: in the ion track. (b) Normalized data.

V. DETAIL OF ION TRACK STRUCTURE
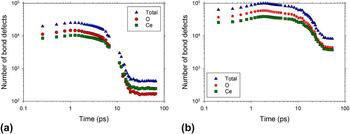
Previous simulation work Reference Kumar, Devanathan, Shutthanandan, Kuchibhata, Karakoti, Yong, Thevuthasan and Seal35 has shown that no stable defects are produced for thermal spikes with an energy deposition of 0.44 keV/nm, while thermal spikes corresponding to 1 keV/nm merely produce two oxygen Frenkel pairs. The present work examines the case of energy deposition that is one to two orders of magnitude higher. The evolution of bond defects produced by a thermal spike with an energy deposition of 12 keV/nm is shown in Fig. 5(a). A log–log scale was used because the time scale and defect count span several orders of magnitude. A Ce ion is defined as a bond defect if its CN is not 8, and an O ion is a bond defect if its CN differs from 4. The number of defects reaches a constant value (primary damage state) within 15 ps of the introduction of the spike. About 240 Ce and 170 O bond defects are produced for a total of about 410 defects. It is important to note that bond defects can be produced by Frenkel pairs as well as by local strain. A single Ce vacancy can create eight under-coordinated O bond defects. Thus, the number of bond defects can be an overestimate of the number of Frenkel pairs. Oxygen defects outnumber Ce defects in the initial stages of the damage (<10 ps), but then this trend reverses indicating very efficient defect recovery on the oxygen sublattice. Dynamic recovery on the oxygen sublattice is well known in fluorite structured materials. Reference Kumar, Devanathan, Shutthanandan, Kuchibhata, Karakoti, Yong, Thevuthasan and Seal35
Time evolution of the number of Ce and O bond defects following (a) a 12 keV/nm thermal spike in CeO2 and (b) a 36 keV/nm thermal spike in CeO2.

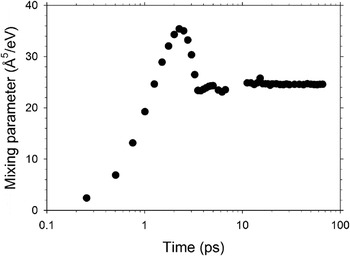
The number of Frenkel pairs, calculated based on the occupation of Voronoi polyhedra, at the end of the thermal spike (∼66 ps) was about 16–20 for Ce and 40–44 for O. The ratio of Ce Frenkel pairs to O Frenkel pairs is more or less stoichiometric. By calculating the number of ions displaced more than 0.2 nm from their original lattice site, it is observed that it is easier to knock anions out of their lattice sites than cations. After 66 ps, there were about 17,780 O ions displaced at least 0.2 nm from their original lattice site compared to about 2700 Ce displacements. These included about 17,735 O replacements and 2685 Ce replacements. Only 0.3% of displaced ions become stable Frenkel pairs while the remaining 99.7% take part in replacement collision sequences that leave the lattice undisturbed. This remarkable dynamic defect recovery offers an explanation for the phase stability of crystalline ceria subjected to swift heavy ion irradiation. The mixing of ions in the thermal spike was studied using the mixing parameter Reference Bacon and Diaz de la Rubia19 given by MSD/6E, where MSD is the mean square displacement of ions and E is the energy deposited per unit volume. The evolution of the mixing parameter following a 12 keV/nm spike in CeO2 is shown in Fig. 6. The ion mixing reaches its peak at about 2 ps and attains a steady value of about 25 Å5/eV after 15 ps. For comparison, the mixing parameter produced by a 10 keV recoil is about 4.3 Å5/eV in Ni and 9.5–13 Å5/eV in Cu. Reference Nordlund, Ghaly, Averback, Caturla, de la Rubia and Tarus39 In the cases of these metals, more defects are produced and the mixing parameter is smaller. The large value of the mixing parameter for the thermal spike in ceria can be attributed to the large number of displaced ions.
The evolution of the mixing parameter following a 12 keV/nm thermal spike in CeO2.

Figure 5(b) shows the evolution of bond defects in ceria following a more energetic thermal spike with an energy deposition of 36 keV/nm. Steady values of the number of bond defects are attained after about 35 ps. The primary damage state takes longer to develop relative to the case of the 12 keV/nm spike, because it takes more time to dissipate the larger amount of energy imparted to the system. After 54 ps, the damage state consists of 3790 Ce and 4455 O bond defects. The average CN was 6.57 for Ce bond defects and 2.90 for O bond defects, which shows considerable under-coordination. By increasing the energy deposited per unit length by a factor of 3, the total number of bond defects has increased by a factor of 20. At these very high values of dE/dx, there is a drastic increase in the defect production, and it is pertinent to investigate the mechanism of defect production. Moreover, the nature of the damage state is also of interest.
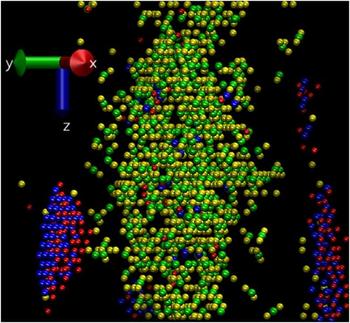
The Voronoi polyhedra method was used to identify vacancies and interstitials with the understanding that this method may not be optimal in regions of severe damage. Vacancy–interstitial pairs that were separated by less than 0.3 nm on each sublattice were eliminated in the analysis of defects from the spikes simulated based on the assumption that such pairs would recombine readily. The remaining defects are then referred to as surviving defects. The cut-off distance, 0.3 nm, was chosen by taking a distance that is slightly larger than one-half of the unit cell length. This choice is somewhat arbitrary. Figure 7 shows an X–Y projection (the thermal spike runs vertically) of the resulting defect distribution from a 9 nm × 9 nm × 9 nm volume centered on the 36 keV/nm spike. The figure shows only the surviving defects. The core of the thermal spike (swift heavy ion track) is enriched in vacancy clusters while the periphery is enriched in interstitial clusters. Isolated vacancies and interstitials as well as small clusters are present in addition to the large vacancy and interstitial clusters that are evident. Among the surviving defects, the average distance from an O interstitial to the nearest O vacancy was 0.82 ± 0.77 nm. The corresponding interstitial–vacancy separation for Ce was 1.63 ± 0.62 nm. The total number of Frenkel pairs produced after 50 ps was about 3980. This number is much higher than the 60 Frenkel pairs produced for the 12 keV/nm spike. Time and temperature will drive defect migration leading to defect annihilation or defect clustering leading to the microstructural features observed by electron microscopy. It is interesting to note that O defects consistently outnumber Ce defects in keeping with the stoichiometry. The highly efficient anion sublattice recovery, evident for the lower energy deposition per unit length (Fig. 5), is not seen here.
Orthographic projection of primary damage state from a 9 nm × 9 nm × 9 nm volume centered on a track following an energy deposition of 36 keV/nm in CeO2 at about 60 ps after thermal spike introduction. Ce vacancies, O vacancies, Ce interstitials, and O interstitials (vacancies have larger radii than interstitials) are shown in green, yellow, blue, and red, respectively. The ion trajectory is along the Z-axis (vertical direction).

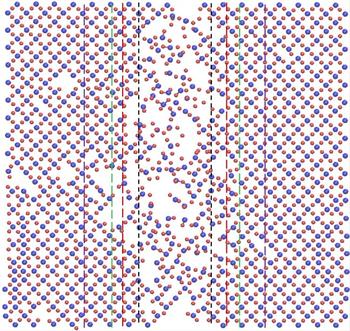
To get further insights into the structure of the primary damage state, the simulation cell was cut normal to the X-axis or [100] direction (see Fig. 7 for axes) into slices of thickness equal to one-half the lattice constant. Such a slice will typically contain a cation layer and an anion layer. Figure 8 shows an orthographic projection of such a (100) slice from the primary damage state of CeO2 subjected to a 36 keV/nm thermal spike, which is oriented vertically in this figure. The track consists of a vacancy-rich core surrounded by an interstitial-rich peripheral region. This structure is considerably different from the damage state produced by a 12 keV/nm spike because a larger number of clustered defects is produced for the 36 keV/nm spike. The density was calculated within concentric cylinders centered on the ion track for radius <2 nm, 2 nm < radius <2.8 nm, 2.8 nm < radius <3.5 nm, and 3.5 nm < radius <5 nm. The density of these regions was 6.19, 6.73, 6.82, and 7.26 g/cm3, respectively. For comparison, the density of perfect crystal CeO2 in our simulation was 7.13 g/cm3. This indicates that the ion track is crystalline, but is vacancy rich and has a density about 13% less than that of the perfect crystal. Progressing radially outward from the core of the track of radius 2 nm, the density gradually increases. For a radius between 3.5 and 5 nm from the center of the track, the density is about 2% higher than that of the perfect crystal due to the presence of interstitial clusters. Recently, Yasuda et al. Reference Yasuda, Etoh, Sawada, Yamamoto, Yasunaga, Matsumura and Ishikawa6 performed electron microscopy studies of swift heavy ion irradiated CeO2. The ceria samples were irradiated with up to 210 MeV Xe ions (electronic stopping of 27 keV/nm) to a fluence of up to 1 × 10¹⁶ ions/cm2, which is higher than the fluence presented in this work. In the Yasuda samples, Fresnel contrast was observed with 3 nm diameter ion tracks, and at these higher fluences, the dislocation networks continued to evolve and subgrains were formed. The authors attributed the Fresnel contrast to a decrease in atomic density at the track core, while the subgrain formation was attributed to the creation and accumulation of interstitials during electronic excitation damage. A more recent study by Takaki et al. Reference Takaki, Yasuda, Yamamoto, Matsumura and Ishikawa22 arrived at similar conclusions following 200 MeV Xe irradiation of ceria. The atomistic modeling presented in this work provides quantitative information to support the explanations advanced by these experimental studies.
Orthographic projection showing the ions of two atomic layers in CeO2 at 54 ps after the deposition of 36 keV/nm thermal energy. Ce4+ and O2− ions are shown as blue and red spheres, respectively. The area shown measures ∼9.7 × 9.7 nm. Vertical lines have been superimposed to show diameters of 2, 2.8, 3.5, and 5 nm centered on the ion track along the vertical direction. The heat is dissipated horizontally (from the center).

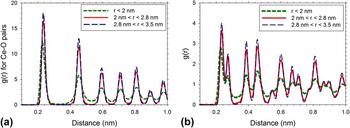
The Ce–O pair distribution function and the overall RDF were calculated from cylinders centered on the thermal spike for radius <2 nm, 2 nm < radius <2.8 nm, and 2.8 nm < radius <3.5 nm. These plots are presented in Figs. 9(a) and 9(b), respectively. One can clearly see that ceria peaks are present for the regions in the ion track core as well as peripheral regions, indicating crystallinity. The peak height increases as we move away from the core, because the density increases. Our findings are similar to the RDFs obtained by Sasajima et al. Reference Sasajima, Ajima, Osada, Ishikawa and Iwase40 in atomistic simulations of a 1.2 keV/nm thermal spike in UO2. The final RDFs are similar to the findings in this paper, where the peaks from the peripheral regions are higher than the peaks from the damage core. Sasajima et al. Reference Sasajima, Ajima, Osada, Ishikawa and Iwase40 were unable to compare this result to a density measurement because they did not have defect structure information, but the similarity is worth mentioning since the materials and electronic stopping values were different but the simulations produced similar results.
(a) Ce–O pair distribution function and (b) overall radial distribution function of CeO2 from three different cylinders centered on a thermal spike with energy per unit length of 36 keV/nm.

VI. MODEL VALIDATION AND EXPERIMENT COMPARISON
The density variation calculated in the model can be carefully compared to the experimental results of the ion track. The ion tracks can be discernable in STEM for different reasons: a change in Z number or from diffraction contrast owing to the presence of defects. A chemistry change within the ion track would change the Z contrast because the ratio of Ce ions and O ions would change from 1:2 to 2:3, therefore slightly darkening the ion track in the image. It is worth mentioning that previous studies of swift heavy ion irradiation effects in ceria have observed radiation-induced reduction of ceria by x-ray photoelectron spectroscopy. Reference Iwase, Ohno, Ishikawa, Baba, Hirao, Sonoda and Kinoshita41,Reference Ohno, Iwase, Matsumura, Nishihata, Mizuki, Ishikawa, Baba, Hirao, Sonoda and Kinoshita42 The EELS data indicate no detectable reduction in ceria, and the decrease in peak intensity in the ion track compared to the bulk indicates a decrease in the number of atoms interrogated. The ion track structure calculated in the model can then be used in tandem with these results to further investigate the structure within an ion track, something that is not possible experimentally.
Results from the 36 keV/nm thermal spike are shown to more closely represent the experimental results and is therefore the focus of the following discussion. Based on the conclusion that the ion track is an area of atomic disorder, the structure of the atomic disorder can be inferred to be a density difference based on the calculated structure. Additionally, the simulation determined that ions were expelled from the ion track, and experimentally, these atoms are seen as dislocation loops in the STEM images, Figs. 3(a) and 3(b). While the character of the dislocation loops was not determined in this study, other studies in CeO2 indicate that loops formed by ion bombardment are interstitial-type, Reference Yasunaga, Yasuda, Matsumura and Sonoda28,Reference Chen, Wen, Kirk, Miao, Ye, Kleinfeldt, Oaks and Stubbins43 offering additional validation to the modeling results.
The ability for dynamic recovery in ceria shown in the 12 keV/nm thermal spike results enables an explanation for the discrepancy in the observed track number density. In the case of an overlapped track, the second ion can annihilate the damage caused by the previous ion fairly efficiently if the material recovers well. Track overlapping was reported in Zelaya et al. as the reason for the discrepancy in the observed number density of defects compared to the applied fluence. Reference Zelaya, Tolley, Condo and Schumacher37 This mechanism of track annihilation has been discussed by Sonoda et al. Reference Sonoda, Kinoshita, Chimi, Ishikawa, Sataka and Iwase7 as well. The fluence dependence of the overlapped area of swift ion tracks has been described by Ishikawa et al. Reference Ishikawa, Ohhara, Ohta and Michikami36
In the images of samples irradiated to fluences above and below 1 × 10¹² ions/cm2, the onset of track overlapping, there is an apparent difference in the spacing of the ion tracks. At a fluence of 1 × 10¹¹ ions/cm2, the tracks appear random, while at 5 × 10¹² ions/cm2 the tracks appear more evenly spaced, similar to our findings presented in Fig. 3(b) and 3(c). Additionally in both the 5 × 10¹² ions/cm2 case in Sonoda et al. and the findings presented in this manuscript, the distance between the ion tracks appears to be ∼10 nm. There is further proof for annihilation of damage regions of one track with those of another based on modeling. The area affected by an ion track is approximately 8 nm, based on the initial diameter of the area of the thermal spike in the initial picosecond after the start of the computation. For a new track to form and not overlap with a neighboring track, it would have to be at least 8 nm away, very close to the observed ∼10 nm. As a result, owing to the exceptional dynamic recovery, the area of influence from one track will annihilate most defects from a previous track. Due to the nature of TEM observation, very small clusters of vacancies or interstitials left behind during such an annihilation event that are not within the core of the new track would be difficult to see. However, these clusters and vacancies would be available to coalesce and form the dislocations, which are experimentally observed and computationally present in this work.
Direct comparison of energy deposition values from simulations and swift heavy ion irradiation experiments is challenging. The input parameters for the thermal spike model are not readily available. Moreover, the present MD simulation is not based on an underlying two-temperature model of the thermal spike. Szenes et al. Reference Szenes, Fink, Klaumunzer, Paszti and Peter44 have proposed that about 40% of the energy of excited electrons are transferred to phonons in insulators. If this value is used to convert the modeling dE/dx value to electronic stopping, one obtains corresponding experimental values of 30 and 90 keV/nm, respectively, for the two dE/dx values simulated here. By relating microstructural features seen in experiment to the simulation results, one can conclude that the factor of 0.4 is too low. The 36 keV/nm simulation shows features similar to the current 940 MeV Au irradiation, which has an electronic stopping of 42 keV/nm. At the same time, the 12 keV/nm simulation produces only a small number of Frenkel pairs. This is consistent with the conclusion of Yasuda et al. Reference Yasuda, Etoh, Sawada, Yamamoto, Yasunaga, Matsumura and Ishikawa6 that 12 keV/nm is the experimental threshold for loop formation in ceria. This suggests a conversion factor closer to 0.85 such that the present 12 and 36 keV/nm simulations correspond to experimental electron energy loss of 14 and 42 keV/nm, respectively.
The comparison of model and experiment is furthering knowledge in the quest to better understand structural changes brought about by swift heavy ion irradiation. Since the simulations did not consider the exact processes that occur in experiment, the main benefit of the simulation is the information on density changes, defect evolution, cation CNs, and structural stability in swift heavy ion irradiated ceria. This work contributes to our understanding of defect production in ceria by electronic stopping. Insights from this work can inform future studies of irradiated nuclear fuel and aging of spent nuclear fuel during dry cask storage for decades.
VII. CONCLUSIONS
In this work, state of the art swift heavy ion experiments and TEM work were coupled with parallel simulations to shed light on ion track formation and ion track structure. The present simulations indicate that swift heavy ion irradiation produces tens of Frenkel pairs per ion impact for the thermal spike of 12 keV/nm. These defects may annihilate with each other or form small clusters, barely detectable by electron microscopy, as a result of defect migration over the time scale of seconds. Defect annihilation could also occur by overlap of adjacent ion damage regions with vacancies from one damage region annihilating with interstitials from the second damage region. Thus, the lower energy spike simulated is close to the threshold of loop formation by swift heavy ion irradiation. The material remains crystalline and there is no significant change in density.
For the much more energetic thermal spike of 36 keV/nm, the defect production increases by more than an order of magnitude for an increase in energy deposition per unit length by a factor of 3. Low density regions characterized by large vacancy clusters are produced at the center of the track, while higher density regions with interstitial clusters are produced away from the track. The material remains crystalline despite the large changes in density brought about by the extreme irradiation condition. The vacancy clusters could coalesce and form voids, while the interstitial clusters could form loops. These results closely resemble the current experimental results, where the tracks themselves were found to have atomic disorder compared to the surrounding bulk material, and dislocation loops formed in association with the ion tracks. The dislocations grew to form networks connecting the ion tracks, which acted as pinning sites. The present work is an essential step toward validating a thermal spike model for fluorite structured ceramics, in this case CeO2. The defect clusters observed in the case of the 36 keV/nm thermal spike shed light on the microstructural changes that take place in irradiated nuclear fuel, for which CeO2 is a surrogate.
ACKNOWLEDGMENTS
The authors would like to acknowledge other members of the Center for Materials Science of Nuclear Fuel who helped with sample preparation, Peng Xu, Anthony Schulte, and Lingfeng He. Experimental results are supported as part of the Center for Materials Science of Nuclear Fuel, an Energy Frontier Research Center funded by the U.S. Department of Energy, Office of Science, Office of Basic Energy Sciences under Award Number FWP 1356. Modeling results were supported by the Materials Science and Engineering Division, Office of Basic Energy Sciences, US Department of Energy under Contract DE-AC05-76RL01830. This research was performed using the resources of the National Energy Research Scientific Computing Center, which is supported by the Office of Science of the U.S. Department of Energy under Contract No. DE-AC02-05CH11231.