

Introduction
Microcredit, the offering of small uncollateralized loans, has become a popular tool for fighting poverty in recent years, particularly in the developing world. In recent years, Microfinance Institutions (MFIs) have loaned over US$100 billion annually to low-income households in at least 119 countries (MIX Market, Reference Market2008). These loans – largely directed at women living on less than US$2 a day – are often offered to solidarity groups (Hermes & Lensink, Reference Hermes and Lensink2007). Solidarity groups are a form of joint liability, in which a group of borrowers agree to mutually insure each other's loans (Besley & Coate, Reference Besley and Coate1995; Armendáriz de Aghion, Reference Armendáriz de Aghion1999; Ghatak & Guinnane, Reference Ghatak and Guinnane1999). If one member of the group cannot make a payment on her loan, the other members of the solidarity group are responsible for pitching in to help her make that payment. The consequences of the group failing to bail out the delinquent member are severe: if one member defaults, the entire group is considered in default and all group members are excluded from the possibility of future loans.
The solidarity group model of microlending has been very successful in Bangladesh and other South Asian countries where it originated (Yunus, Reference Yunus2007). However, as solidarity group lending became the modal microlending method across the world – nearly two-thirds of microcredit borrowers receive loans structured in this way (Hermes & Lensink, Reference Hermes and Lensink2007) – it became clear that the success of solidarity groups in South Asia was due to more than just the lending model.
Of course, which outcomes ought to be emphasized as indexing success (e.g., poverty reduction, savings, well-being broadly construed, women's empowerment, education, etc.; Karlan & Zinman, Reference Karlan and Zinman2011; Banerjee et al., Reference Banerjee2015a) and how to measure those outcomes are topics of debate (Odell, Reference Odell2010; Awaworyi Churchill & Nuhu, Reference Awaworyi Churchill and Nuhu2016). Further, evidence that microloans have a positive impact on such local outcomes is quite mixed, both within and between studies (Pitt & Khandker, Reference Pitt and Khandker1998; Morduch & Haley, Reference Morduch and Haley2002; Khandker, Reference Khandker2005; Chemin, Reference Chemin2008; Karlan & Zinman, Reference Karlan and Zinman2009; Duvendack & Palmer-Jones, Reference Duvendack and Palmer-Jones2012; Attanasio et al., Reference Attanasio2015; Banerjee et al., Reference Banerjee2015a, Reference Banerjee, Karlan and Zinman2015b). Looking beyond local impact, others have examined the effects of microlending on macroeconomic outcomes, such as inequality, and found favorable effects (Hisako & Shigeyuki, Reference Hisako and Shigeyuki2009). One outcome MFIs and policy-makers attend to is default rates, because achieving sufficiently low default rates is important for financial sustainability. Here, we will examine the psychology that underlies microloan default and the high variation in default rates across countries that has been observed. An understanding of such variation in default rates, and their underlying psychology, could aid MFIs and policy-makers as they decide how to structure loans (e.g., joint- versus individual-liability loans) across borrower pools.
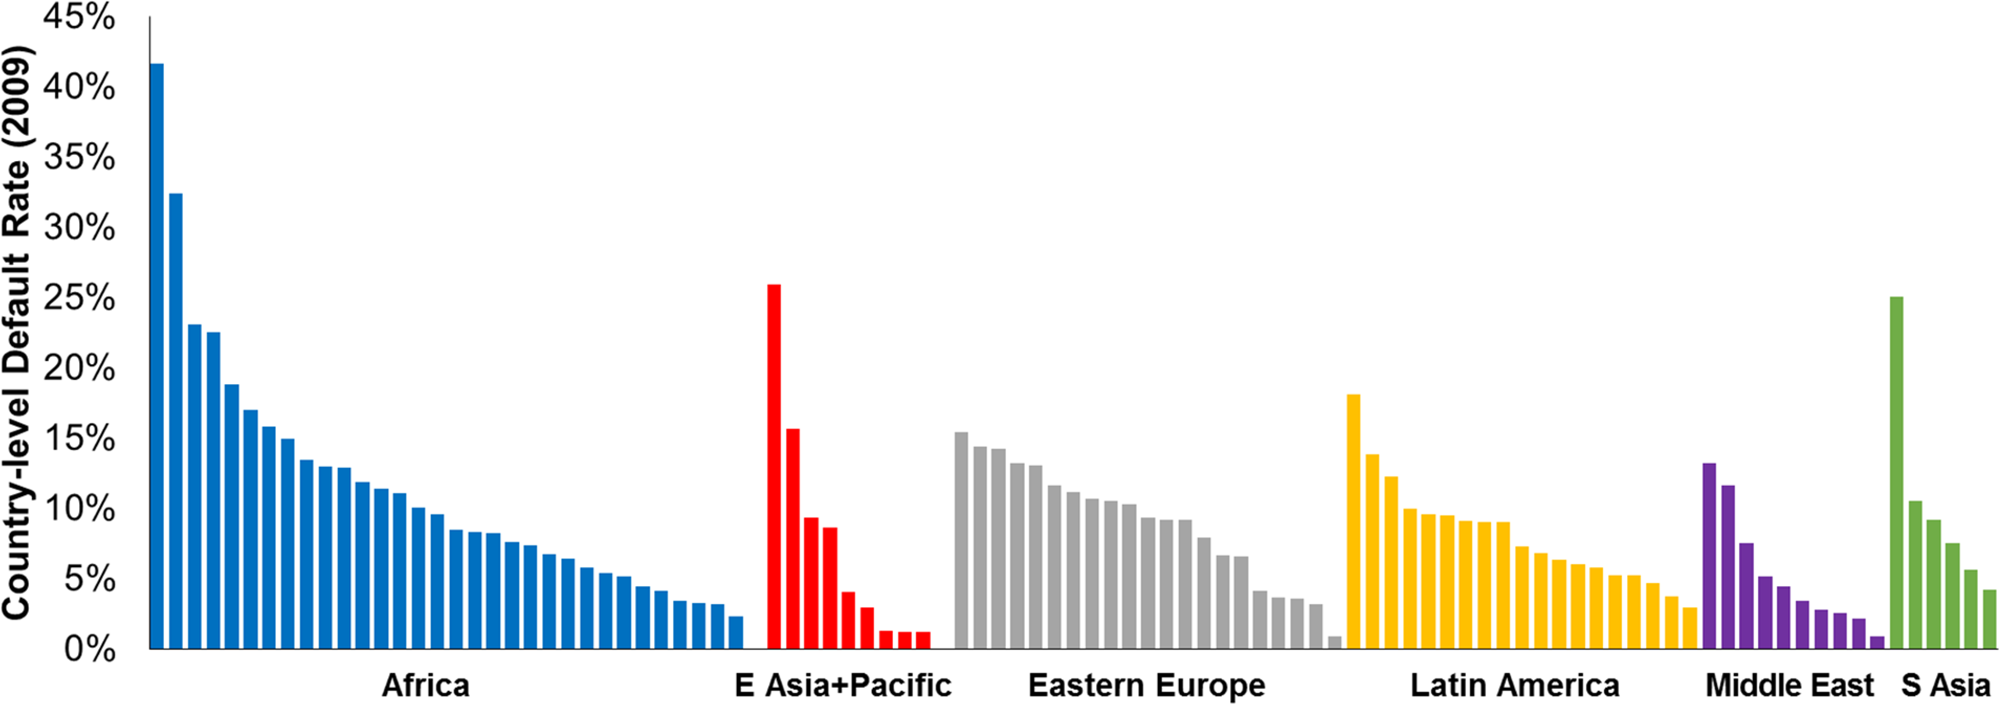
There is significant country-level variation (F(118, 11,601) = 12.15, p < 0.001) and region-level variation (F(5, 11,601) = 63.11, p < 0.001) in default rates (see Figure 1), with banks in many countries facing default rates high enough to keep microlending from being self-sustaining (i.e., functioning without reliance on charitable donations; Hermes & Lensink, Reference Hermes and Lensink2011).
There is clear variation across countries in microloan default rates, and default rates can be extremely high. Each bar represents the mean default rate of banks in a given country during 2009, which range from 0% to over 40%. Countries are grouped into five regions, represented by different groups of bars (Middle East includes North Africa).

Repayment theories
What causes defaults, and how can lenders and policy-makers reduce defaults where they are prevalent? Most research on microcredit has tried to explain why individuals make any contributions to repay the microloan at all – since loans to solidarity groups are both uncollateralized and susceptible to free-riding, why do individuals not shirk on their payments, leading to high default rates across the board (Stiglitz, Reference Stiglitz1990; Besley & Coate, Reference Besley and Coate1995; Armendáriz de Aghion, Reference Armendáriz de Aghion1999; Morduch, Reference Morduch1999; Armendáriz de Aghion & Morduch, Reference Armendáriz de Aghion and Morduch2000; Wydick, Reference Wydick2001; Field & Pande, Reference Field and Pande2008)?
One set of answers propose that the collateralization and free-rider problems can both be addressed by collateralizing the social capital that exists within and outside borrower groups. For example, borrowers who would face external sanctions in the event of a default are incentivized to repay their microloans (Besley & Coate, Reference Besley and Coate1995), as are those who face within-group peer pressure and sanctioning (Paxton et al., Reference Paxton, Graham and Thraen2000). Others, however, have emphasized the role of harmonious social relationships, both internal and external to borrower groups, in fostering (rather than coercing) repayment (Griffin & Husted, Reference Griffin and Husted2015). Another set of repayment theories suggest that peer monitoring and screening (e.g., requiring character references for prospective borrowers) can allow solidarity groups to exclude unreliable borrowers who take on too much risk (Stiglitz, Reference Stiglitz1990) or who are characteristically unlikely to repay their loans (Armendáriz de Aghion & Morduch, Reference Armendáriz de Aghion and Morduch2005), and thus achieve better outcomes (Banerjee et al., Reference Banerjee, Besley and Guinnane1994). Similarly, borrowers may learn useful business strategies from peers who are already successful through mentorship programs, thereby reducing defaults that may be caused by inexperienced entrepreneurs who learn by trial and error (Barboza & Barreto, Reference Barboza and Barreto2006).
Inequity aversion in microloans
Many of the repayment theories described above provide compelling solutions to the free-rider problem: both social capital and peer monitoring create incentives to cooperate, as does the ‘shadow of the future’ (Bó, Reference Bó2005) cast by the basic repeated interaction structure of microloans and the possibility of peer punishment (Czura, Reference Czura2015).
Here, we propose that there is another factor that can drive default rates, even in contexts where the free-rider problem has been resolved by social capital, peer monitoring and repeated game effects: how people respond when others are unable to make their payments. That is, what determines whether people are willing or unwilling to pitch in extra when someone else in their solidarity group cannot afford to pay his or her full installment? Given that borrowers are typically living under conditions of extreme poverty, they are highly susceptible to income shocks (Morduch, Reference Morduch1994). Thus, even in the absence of free-riding, people will sometimes fail to make their full payments just due to chance and misfortune, and it is essential for a solidarity group's survival that others are willing to chip in to cover these shortfalls.
Put differently, in solidarity group lending, groups do not simply default because a group member cannot make his or her payment; groups default when the rest of the group cannot, or will not, bail out those members who are unable to make their full payments. From this perspective, an important question is therefore: What makes a borrower refuse to pay a small cost to bail out another group member, even when doing so causes him or her to incur the much larger cost of forgoing all future loans?
Here, we shed light on microfinance defaults by leveraging the fact that this question, in a slightly different form, has received a great deal of attention in the behavioral economics literature using the Ultimatum Game (UG). In the UG, a ‘proposer’ makes an offer of how to split a sum of money with a ‘responder’. The responder can either accept or reject, and in the latter case neither player receives anything. When a responder rejects a low (but non-zero) offer, she is forgoing the offered amount in order to reduce the proposer's payoff. Although this behavior is inconsistent with rational self-interest, a large body of empirical evidence shows that many people do indeed reject low offers in one-shot anonymous UGs (Camerer, Reference Camerer2003), even when the stakes are quite high (e.g., one month's salary; Andersen et al., Reference Andersen2011). This evidence suggests that people derive disutility from receiving less than a normative ‘fair share’ from an exchange (i.e., they show ‘disadvantageous inequity aversion’; Fehr & Schmidt, Reference Fehr and Schmidt1999), and thus are willing to pay costs to obtain a result that is considered more fair – even when doing so reduces everyone's earnings.
Our key argument is that inequity aversion – the same psychology that causes UG rejections – leads borrowers to refuse to bail out delinquent members of their solidarity group, despite the long-run individual costs of allowing the group to default. To see why, consider the differences between a money-maximizing and an inequity-averse decision-maker in a stylized conceptual model of the microloan interaction among the members of a solidarity group.
We consider a stochastically repeated game. In each period of the microloan interaction, each member of the solidarity group receives an endowment and decides how much to contribute to the group's repayment effort. The group must reach a total level of contribution of at least T in order to avoid default. If the group defaults, all members are excluded from any future loans, and thus earn payoff 0 in all subsequent periods. If the group does not default, they can continue on in the next period, and each group member i earns expected payoff b i, which is a function of the continuation probability (i.e., the likelihood that the group does not disband for reasons other than default), the income distribution across the group members, the default threshold T and the strategies of the other group members. Our argument will hold regardless of the functional form of b. We will assume that if a group member fails to make the full payment on his or her loan, falling short by C units, the game enters the ‘pitching in’ stage. In this stage, each of the non-delinquent group members in turn is given the opportunity to pitch in C units to make the group compliant. If the first non-delinquent group member pitches in enough that the threshold is met, the game continues to the next period. If not, the choice passes to the next non-delinquent member. If the non-delinquent group members fail to pitch in enough, the group defaults.
A player's strategy in this game therefore constitutes their choice of how much to contribute in the contribution stage and whether to pitch in the required units in the pitching in stage. Given that the game is repeated, conditional strategies are possible in which choices in each stage depend on the outcomes of previous rounds. For simplicity, however, we focus on a single decision (unconditional strategy) in the pitching in stage facing the final non-delinquent group member in the case where all other non-delinquent group members have elected not to pitch in. A money-maximizing player will pitch in C as long as b i > C; that is, if the individual benefits to that player of the group persisting are greater than the cost of pitching in.
Those who show disadvantageous inequity aversion, however, incur a psychological cost when others earn more than them – and pitching in necessarily causes one to earn less than the other non-delinquent group members who do not pitch in, as well as the delinquent player in the case that delinquency is due to free-riding rather than an inability to contribute.Footnote 1 Let α i be the inequity-aversion-related disutility that pitching in C units causes for group member i. Thus, an inequity-averse group member will contribute if b i > C + α i holds. As a result, the more inequity averse a player is, the larger the expected monetary benefit from the group avoiding default must be in order for him or her to prefer pitching in to letting the group fail. Thus, just as inequity-averse decision-makers are less likely to accept unfair offers in the UG than money maximizers, inequity-averse decision-makers are also less likely to pitch in when their microloan group falls short of its repayment threshold, leading to a greater likelihood of default in groups of inequity-averse players.
In this paper, we provide empirical and experimental support for this proposed connection between inequity aversion as indicated by UG rejections and microloan default. In doing so, we aim to shed new light on why solidarity group microloans fail, what explains cross-country variation in such failures and what approaches might be employed to reduce such failures.
Empirical data
Methods
To provide initial empirical support for the argument that inequity aversion plays a role in determining solidarity group success and in explaining cross-country variation in default rates, we used several publicly available data sources to compile our dataset for the microcredit outcomes analyses. These sources include the Microfinance Information Exchange (MIX) (MIX Market, Reference Market2008), the World Values Survey trust index (World Values Survey Association, 2009), the Global Barometer Survey (Global Barometer, Reference Barometer2009), economic games data from dozens of countries compiled in two meta-analyses (one for the UG [Oosterbeek et al., Reference Oosterbeek, Sloof and van de Kuilen2004] and one for Trust Game [TG; Johnson & Mislin, Reference Johnson and Mislin2008]) and the World Bank database for GDP, GDP per capita, GDP growth, Gini index and poverty data (World Bank Group, 2012). For any given analysis, we included all countries for which we had microfinance outcomes during the relevant timespan and the corresponding predictor variables.
All of the data regarding the performance and makeup of MFIs were obtained through the MIX (MIX Market, Reference Market2008). The MIX is an online database founded in 2002, which makes available a variety of data from thousands of MFIs in most of the world's developing nations. Through the MIX, we procured rates of at-risk portfolios, loan portfolio yields, percentage of women borrowers and a number of other indicators relevant to these and other analyses. Most notably, the percentage of women borrowers is of interest as a predicting variable based on fieldwork done by D'Espallier and colleagues (Reference D'espallier, Guérin and Mersland2011), which showed that homogeneity of group gender composition predicted lower default rates.Footnote 2
Because MFIs have varying accounting practices when dealing with unpaid loans, the MIX reports the value of loans that are at risk, meaning having at least one installment past due for more than 30 days.Footnote 3 This includes the value of unpaid principle, both past and future, but not accrued interest, and is standardized by dividing the at-risk loan value by the MFI's gross portfolio value. This is the standard proxy used for default rates in microlending. The ‘real yield on gross portfolio’ indicator is the ratio of interest and fees on the loan portfolio to the average gross loan portfolio, controlling for inflation, and so it acts as a proxy for interest rates. The percentage of borrowers who are female is calculated by dividing the number of female borrowers by the total number of borrowers.
Over the last 30 years, there have been six waves of the World Values Survey collected in almost 100 countries. The full survey captures many attitudes, but our primary interest was those pertaining to trustworthiness and civic cooperation. The trust question of interest is: ‘Generally speaking, would you say that most people can be trusted or that you need to be very careful in dealing with people?’. Participants then choose between ‘Most people can be trusted’ and ‘You can never be too careful when dealing with others’. The trust index is calculated as: trust index = 100 + (% Most people can be trusted) – (% Cannot be too careful). For the regressions presented in Supplementary Table S3 (available online), we augmented the World Values Survey trust index data with data from the Global Barometer Survey, which asks, among other questions, the exact same trust index question asked by the World Values Survey. We added trust index values from a few countries for which we had UG and MIX data, but no World Values Survey trust index data, in order to keep our sample at the maximum possible size. Beyond the trust index, we also used three questions from the World Values Survey to determine what other researchers (Herrmann et al., Reference Herrmann, Thöni and Gächter2008) have called ‘civic cooperation’. Civic cooperation measures attitudes toward tax evasion, abuse of social welfare programs and dodging fares on public transportation (literal free-riding). This composite has been shown to be strongly predictive of cooperative (anti-free-riding) behavior (Herrmann et al., Reference Herrmann, Thöni and Gächter2008).
Although surveys yield important information about how people expect themselves and others to behave, they do not always reveal strategies in the way economic games do. In order to distinguish between attitudinal and behavioral trust, trustworthiness and tendency to punish, we use cross-cultural economic games data. UG and TG data were taken from the meta-analyses mentioned above that were designed to be sensitive to cross-cultural differences in the playing of these games, and so the criteria for inclusion between the meta-analyses were similar.
We also pulled democracy ranking and corruption ranking data from the World Audit (World Audit, 2016), as well as rule of law data from the World Justice Project (Agrast, Reference Agrast2013). Lastly, Gini index, GDP per capita, GDP and GDP growth were gathered from the World Bank database, which collects a number of developmental indicators and dates from 1960.
We restrict our analyses to 2007 and after, because prior to that year there are few data on which loan structures are most prevalent. The MIX does not collect data on loan structure, but an empirical survey from 2007 (Hermes & Lensink, Reference Hermes and Lensink2007) found that approximately two-thirds of borrowers at that time received solidarity group loans. So, for that reason, we have restricted our analyses to after 2007 in order to be sure that we are looking at microlending outcomes that reflect the relevant loan structure of solidarity groups.
Results
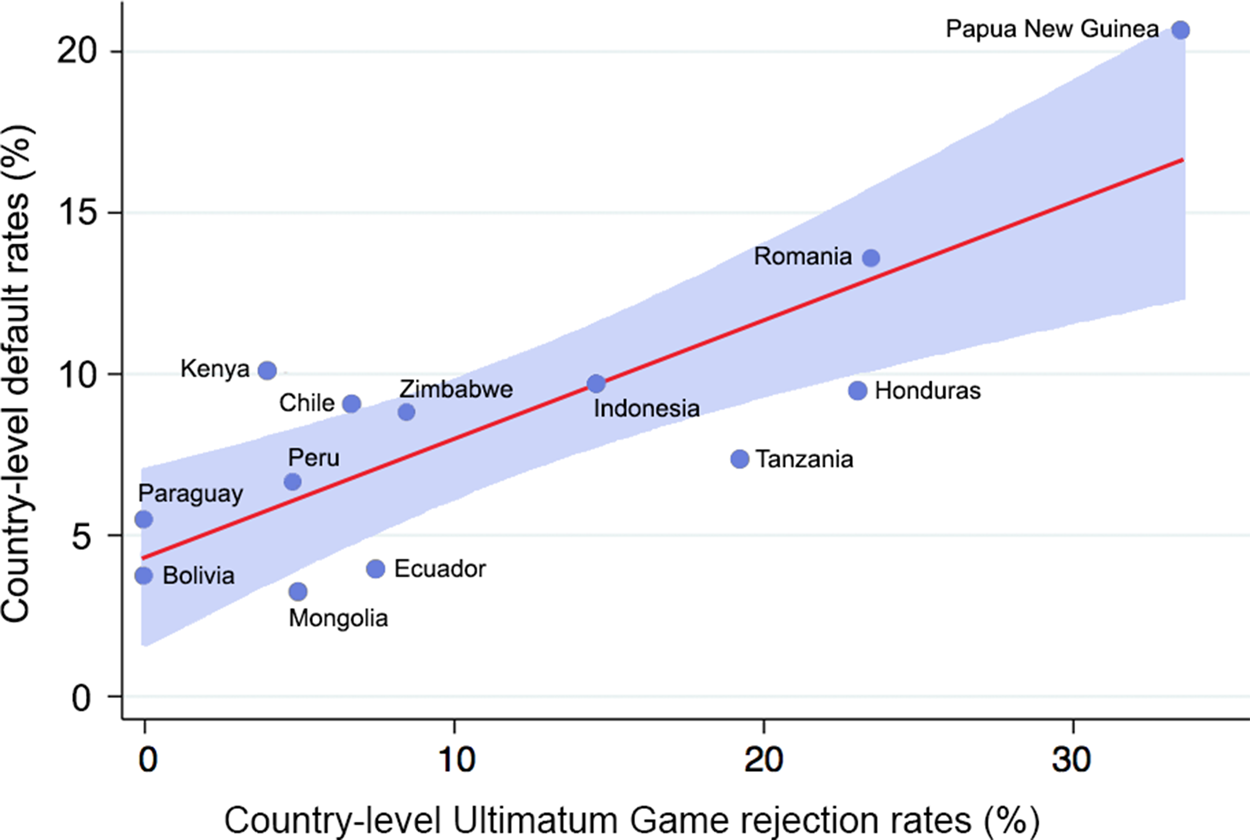
We find that the UG rejection rate in a given country is strongly correlated with that country's microloan default rate (r = 0.81, p < 0.001; Figure 2; averaging default rates across the period 2007–2014). This relationship held for all but one of the individual years in that eight-year range and was robust to: (1) controlling for UG offers (to partially address the fact that we are analyzing overall rejection rates and not minimum acceptable offers [MAOs]); (2) controlling for a set of economic development indicators including GDP, GDP growth, GDP per capita and Gini index; (3) analyzing the data at the bank level rather than the country level; and (4) excluding Papua New Guinea (an extreme value). See Supplementary Material for details and further analyses using the additional indicators mentioned above.
Microloan default rates are strongly correlated with Ultimatum Game rejection rates across countries. Shown are country-level default rates averaged across an eight-year span (2007–2014). UG rejection rates are highly correlated with default rates (r = 0.812, p < 0.001, R2 = 66%). The 95% confidence intervals are shown for the regression line.

Conversely, we found no evidence that defaults were negatively related to pro-sociality (i.e., associated with free-riding) when using various different measures (Peysakhovich et al., Reference Peysakhovich, Nowak and Rand2014). First, we combined default rate data with a different cross-cultural dataset of TG play in 18 countries (Johnson & Mislin, Reference Johnson and Mislin2008) and found a non-robust association in the opposite direction, with default rates being (if anything) positively correlated with trust (r = 0.559, p = 0.016) and trustworthiness (r = 0.392, p = 0.107), but these relationships failed to reach conventional significance levels when including economic controls (p > 0.05 for both). Second, we combined default rate data with the World Values Survey (56 countries in both the World Values Survey and default rate dataset) and found no correlation between default rates and trust (r = –0.154, p = 0.245) or strength of civic norms of cooperation (r = 0.056, p = 0.682), both of which are often used as proxies for pro-sociality (Herrmann et al., Reference Herrmann, Thöni and Gächter2008; Peysakhovich et al., Reference Peysakhovich, Nowak and Rand2014). See Supplementary Material for additional analyses.
The fact that UG rejections predict cross-cultural variation in microcredit default rates while pro-sociality does not supports our emphasis on borrowers’ responses to others’ behavior over borrowers’ own inclination toward cooperation versus free-riding. Of course, these kinds of cross-sectional analyses must be taken with a grain of salt because they suffer from all of the typical limitations inherent in correlational analyses, and the borrower populations may differ from the populations surveyed on relevant dimensions. However, we do take these results as suggestive of a mechanism – inequity aversion – that is not typically discussed in the microlending context (but see Griffin & Husted, Reference Griffin and Husted2015, for some hints of this).
Experimental data
Methods
To provide further evidence for this interpretation of microloan defaults, we complement these field data with an individual-level, online laboratory experiment. In this experiment, we place participants into groups and examine the relationship between UG MAOs (the lowest offer someone would be willing to accept) within the group and the group's behavior in a novel economic game, the Microloan Game, which we developed. In the game theoretic tradition, the Microloan Game is an abstraction that, while it omits many elements of real-world solidarity group-based microcredit, aims to capture the key strategic features of such interactions: (1) that players are engaged in a repeated, potentially lucrative group endeavor that requires regular financial investment (i.e., loan repayment) to continue; (2) that some group members are either unable or unwilling to make that investment in any given period, leading to shortfalls; and (3) that when such shortfalls occur, other group members can pitch in more money to make up the shortfall.
Specifically, in the Microloan Game, participants played a repeated game in groups of three. Each round of the Microloan Game consisted of two stages. (Although we herein describe the game in terms related to microcredit loan payments, the game was presented to participants in neutral language without any mention of loans, debt or repayment.)
Upon entering the study, participants were randomly assigned to a group, and each group was randomly assigned to a condition. In Stage 1, each of the three group members was given a random initial endowment representing their income in a given loan period (between 20 and 500 monetary units [Mus], with an average of 340 MUs; the random endowment allocation procedure is described in more detail below). Each group member then decided how much of that endowment to keep for themselves versus how much to contribute to the group, representing their decision regarding repayment of their microloan debt. Participants were informed that each of the three group members was required to contribute 200 MUs per round in order to avoid group default. If fewer than 600 MUs in total (200 MUs per member) were contributed, the contribution threshold was not met and the game entered Stage 2.
In Stage 2, all players were told the number of additional MUs required to meet the contribution threshold, and they were given the opportunity (in random order) to ‘pitch in’ more units if they chose to do so. Participants could not waste MUs by over-contributing, and they were aware of this fact because pitching in was done sequentially and the remaining balance due was displayed, and participants could not use earnings from past rounds to cover the shortfall of the current round.
If the 600 MU goal was not reached by the end of Stage 2, the game ended and no further earnings were possible (i.e., the group defaulted on their loan). If at least 600 MUs were contributed (either directly in Stage 1 or by the end of Stage 2), the game had the chance to continue on for another round (in the absence of default, the game lasted eight rounds for certain, and then transitioned to a stochastically repeated game with 50% continuation probability, as per a randomization scheme presented in Bó & Fréchette, Reference Bó and Fréchette2011). The order in which participants pitched in was randomized and participants were not informed of the order in which group members were given the opportunity to pitch in (although they did always know the outstanding amount needed to reach the continuation threshold), and thus the only way a given player could be certain that the group would avoid default would be to pitch in the full amount required themselves. As a result, players had some personal incentive to make sure the group met its 600 MU contribution goal, in order to be able to earn more units in future rounds,Footnote 4 but also had the opportunity to free-ride by contributing fewer than 200 MUs with the hope that others would make up the difference. Critically, however, participants did not know whether lack of contribution by other players was due to the inability to contribute (because of a small endowment) or just due to free-riding.
Solidarity groups are often faced with the situation in which one or more members are unable to pay, as income for the typical participant is highly variable (Morduch, Reference Morduch1994; Dercon, Reference Dercon2002). To incorporate this into our lab Microloan Game, we forced incomes to differ between players and across rounds of the game: while each participant received an average of 340 MUs each round, each received a different randomly sampled amount. In particular, the sampling was designed such that one player each round received fewer than 200 MUs, and thus was unable to repay their share of the 600 MU contribution goal. Players were informed only that in each round they would receive a randomly determined endowment of between 0 and 500 MUs, and were given no information about the endowments of the other players or the manner in which endowments were generated (modeling the real-world ambiguity regarding others’ incomes). Thus, even in the absence of any free-riding, avoiding default in the Microloan Game depended on (at least) one of the two higher-endowment players contributing greater than 200 MUs each round, despite not knowing how many MUs the other participants received – and thus having uncertainty about whether others’ non-contribution was driven by free-riding or bad luck. In keeping with common practice in experimental economics, and in order to have a unidimensional focus on inequity, we shuffled participant IDs between each round. That is, because we shuffled participant IDs between each round, we allowed participants to act on a motivation to avoid disadvantageous inequity without introducing complexities that arise from the presence of reputation. Of course, this reduces the ecological validity of the game, but makes it more straightforward to make inferences about the role of disadvantageous inequity aversion in microlending. See Supplementary Materials for experimental instructions.
We hypothesized that, as with real-world solidarity groups, there would be substantial variance in default rates across our experimental groups in the Microloan Game and that the psychology of inequity aversion would play a major role in explaining this variation. To test this hypothesis, we had participants play an UG prior to the beginning of the Microloan Game. In the UG, participants made decisions in both roles (specifying an offer as Player 1 and a MAO below which they would reject as Player 2). Players did not receive feedback on the UG's outcome until the experiment was complete in order to prevent contamination effects; half of participants were assigned to be Player 1, the other half Player 2, and payment was determined on random pairings after the fact.
We predicted that a group's likelihood of defaulting in the Microloan Game would be determined by the UG MAOs of its members. In particular, because the group's shortfall could typically be made up (and default avoided) by just one group member chipping in the extra amount, what matters for preventing defaults is the least inequity-averse group member – or, put differently, the failure of a group in the Microloan Game should be predicted by the lowest MAO among its members. The higher the lowest MAO in a group is, the less likely someone will be willing to chip in and the less likely the group will be to succeed (predicting a positive relationship between Microloan Game default and minimum MAO in the group).
Recall that above, when we compared how money-maximizing and inequity-averse decision-makers treat the solidarity group interaction, we showed that money maximizers ought to be more likely to both accept low offers in the UG (i.e., have low MAOs) and to pitch in to meet a threshold in a game like the Microloan Game than inequity-averse decision-makers. This allows us to predict Microloan Game outcomes at the group level using individual-level preferences elicited using the UG.
Finally, we assessed the robustness of this prediction regarding the importance of inequity aversion for Microloan Game default with a second experimental condition designed to accomplish two goals. First, we wanted to ‘stack the deck’ in favor of the importance of free-riding by emphasizing the social dilemma dimension of the Microloan Game. Second, we wanted to show that, because inequity-averse decision-makers already view the Microloan Game as a social dilemma (and money maximizers are already prepared to pitch in when the value of the game continuing is greater than the cost of pitching in), framing the game as a social dilemma should not affect the relationship between inequity aversion and gameplay. In this ‘Social Dilemma’ condition, the game was expressly framed as a collective goods problem: players were told that the group as a whole was required to contribute 600 MUs per round (and the group could, one member at a time, pitch in to cover shortfalls), in contrast to the baseline condition where players were told they were individually responsible for contributing 200 MUs each (and could individually pitch in).
To test these predictions, we recruited 360 US participants from Amazon's Mechanical Turk (Mage = 34.99, 71% female; Mechanical Turk offers a subject pool that is much more diverse than just college undergraduates; Horton et al., Reference Horton, Rand and Zeckhauser2011) to play the UG and the Microloan Game. In line with standard Mechanical Turk wages, participants were paid a show-up fee plus a bonus based on their earnings in the game, using an exchange rate of 10 MUs per cent. A randomization check indicated that UG MAOs did not differ significantly between participants randomized into the Baseline versus Social Dilemma condition in the Microloan Game (Ranksum, z = 1.303, p = 0.193). The mean UG MAO was 67 MUs, the distribution had modes at 100 and 50 MUs and 20% of MAOs were at or below 40 MUs.
All analyses are conducted at the level of the three-player Microloan Game group, with one observation per group. We consider three different measures of a group's (lack of) success: (1) whether the group defaulted at any point in the game; (2) whether the group defaulted in the very first round; and (3) the fraction of total rounds in which the group was in default, which was determined by dividing the number of completed rounds by the number of possible rounds determined by the stopping algorithm described above. We then predict these measures using the level of inequity aversion of the least inequity-averse group member (i.e., the lowest UG MAO of the three group members); as described above, because it only takes one person to pitch in to the save the group from default, what matters is the unwillingness of the least unwilling group member. For the binary Microloan Game failure measures we use logistic regression, and for the continuous failure measure we use ordinary least squares regression with robust standard errors; all coefficients for continuous variables are standardized.
Results
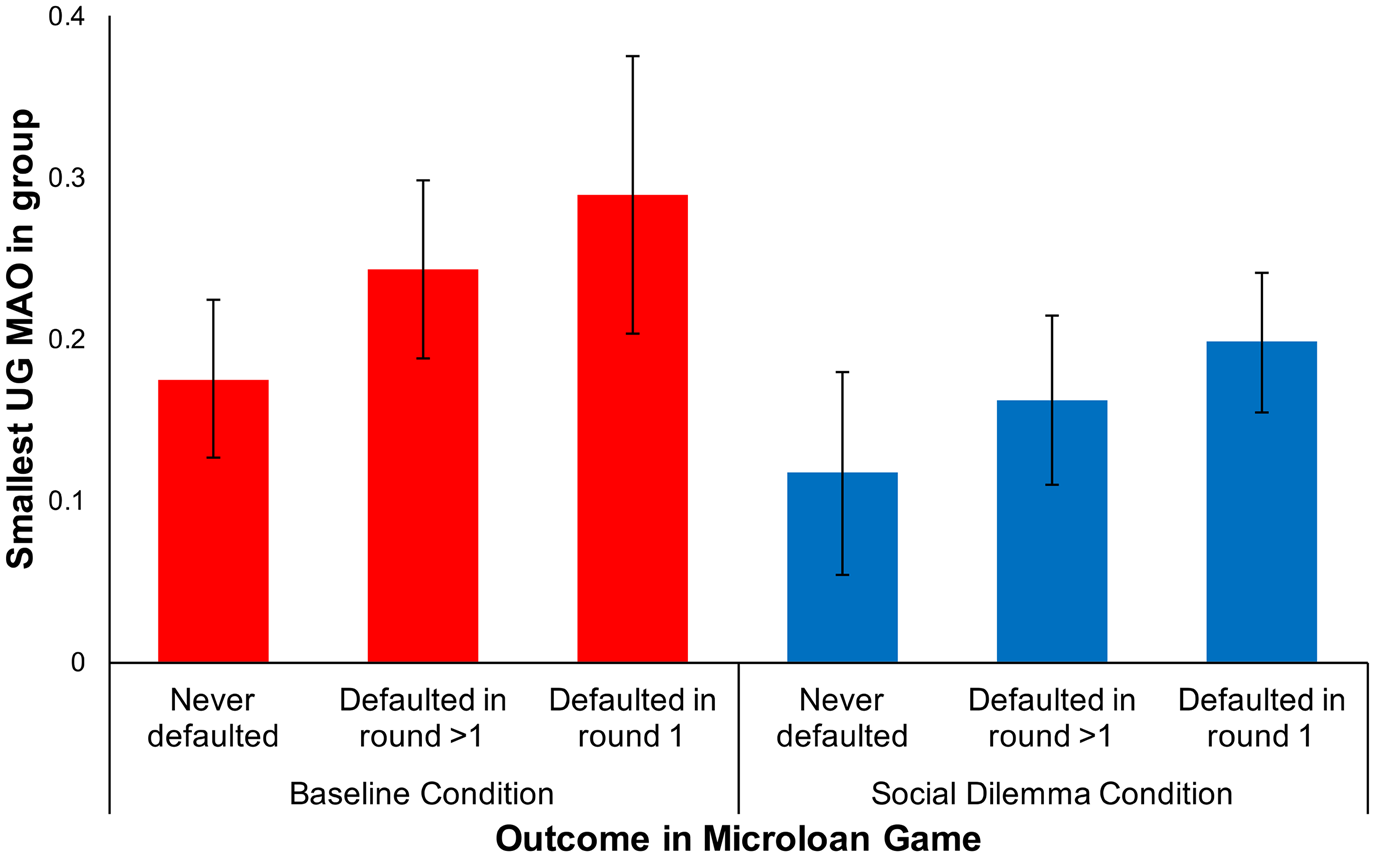
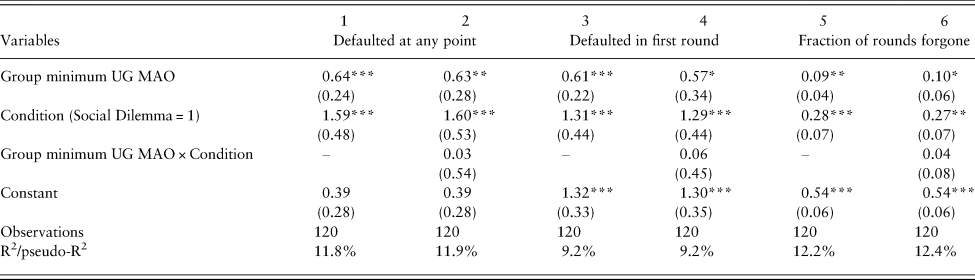
As expected, we observed a positive relationship between a group's failure in the Microloan Game and the group's minimum UG MAO (whether the group defaulted at any point in the game, β = 0.64, SE = 0.24, p = 0.008; whether the group defaulted in the very first round, β = 0.61, SE = 0.22, p = 0.006; fraction of total rounds in which the group was in default, β = 0.09, SE = 0.04, p = 0.028; (see Figure 3 and Table 1). This suggests that a group defaults when the least inequity-averse group member's willingness to incur costly punishment is sufficiently high – that is, when no group members are willing to pitch in because they are all too inequity averse. We also observed a significant effect of the Social Dilemma frame on Microloan Game group failure (whether the group defaulted at any point, β = 1.59, SE = 0.48, p < 0.001; whether the group defaulted in the first round, β = 1.31, SE = 0.44, p = 0.003; fraction of total rounds in which the group was in default, β = 0.28, SE = 0.07, p < 0.001). This serves as a manipulation check, confirming that our Social Dilemma frame successfully induced greater free-riding. Critically, however, there was no significant interaction between minimum UG MAO and condition (whether the group defaulted at any point, β = 0.03, SE = 0.54, p = 0.951; whether the group defaulted in the very first round, β = 0.06, SE = 0.45, p = 0.888; fraction of total rounds in which the group was not in default, β = 0.04, SE = 0.08, p = 0.639). This shows that the MAO relationship was robust to emphasizing the social dilemma component of the Microloan Game.
Ultimatum Game (UG) minimum acceptable offers (MAOs) are positively related to failure in the laboratory Microloan Game, both in the Baseline and the Social dilemma conditions. Shown is the MAO of the least inequity-averse group member (i.e., the group member with the lowest MAO) averaged across all groups who either never default, did not default in the first round but eventually defaulted in a later round or defaulted in the first round. Error bars indicate 95% confidence intervals.

Regression results from the experimental data. Participants were more likely to default at some point (Specifications 1 and 2) and in the first round (Specifications 3 and 4) if their group minimum Ultimatum Game (UG) minimum acceptable offer (MAO) was higher. Similarly, groups with higher minimum UG MAOs failed to complete more rounds. Specifications 1–4 were fit using logistic regression; specifications 5 and 6 were fit using ordinary least squares regression.

Coefficients are standardized and group-clustered standard errors are shown in parentheses.
*p < 0.1; **p < 0.05; ***p < 0.01.
Thus, our Microloan Game results demonstrate that the positive relationship between UG MAO and microcredit defaults shown in the cross-cultural data extends to the much more controlled environment of a laboratory game using just American participants and applies at the level of individual psychology (rather than, for example, just tracking some other group-level cultural trait in the cross-cultural dataset). That is, although there are clear identification issues with the model we fit to the cross-cultural data in the previous section, the fact that we observe the same pattern in the lab at the individual level supports our theoretical claim regarding inequity aversion and microloan default.
While the results from this individual-level experiment are what we expected based on our inequity-aversion model of the microloan interaction, there are limitations of the experiments that are important to acknowledge. We noted above that we stripped away some important features of solidarity group lending in an effort to isolate the role of inequity aversion in the microloan interaction. In particular, we did not allow participants to track the behavior of specific individuals (which would have made negative reciprocity possible) and we did not allow communication. By removing these features from the interaction, we were able to isolate the role of inequity aversion, but removing such features also has the potential to reduce the external validity of the experiment. Furthermore, our main goal in this experiment (and in the model described above) was to compare the behavior of money maximizers and those who are inequity averse, but other motivators are likely to also play a role (e.g., altruism). Moreover, the subjects used in our experiment (Americans on Mechanical Turk) are quite different in many ways from typical participants in microloans. Future work should explore how inequity aversion interacts with reciprocity and communication in microloans, the role of other motivations for default and the generalizability of results beyond our particular subject pool.
We would also like to note some other limitations of this work raised during the review process. For example, because the MIX does not contain loan methodology, our microfinance outcomes come from banks that use a variety of loan types, some of which do not use joint liability. While this should only make our estimates of the relationship between inequity aversion and default more conservative, it is worth noting nonetheless. It is also the case that many of the variables we pulled from the World Values Survey include responses from demographics that are not the target for microloans; namely, the rural and working poor. Similarly, while our measure of default (Portfolio at Risk at 30 Days [PAR 30]) is a useful proxy, having a longer-term at-risk measure would be helpful in order to test the longevity of inequity aversion (i.e., given sufficient time, do inequity-averse individuals cool off and eventually pitch in?).
Discussion
Here, we have provided evidence that a key determinant of the success of solidarity group lending – the predominant model of microlending – is people's willingness to overcome inequity aversion and pitch in when other group members fail to make their payments. As such, we find that variation in inequity aversion (as measured by UG rejections) and not variation in cooperativeness (captured by a variety of measures) is strongly predictive of default rates across countries. In addition, this relationship is also evident in the psychology of individuals: in a laboratory model of microcredit, groups with individuals having higher UG MAOs (i.e., more inequity averse) are more likely to default.
Our observation that the psychology of inequity aversion plays such an important role in driving default rates has important policy implications. With this perspective, it becomes possible to leverage the large body of work in behavioral economics regarding the motivations of UG rejection to design default-reduction interventions.
For example, there is considerable evidence that ‘cool-off’ periods, in which responders are asked to wait for several minutes or overnight before responding to offers, dramatically reduce rejections in the UG (Grimm & Mengel, Reference Grimm and Mengel2011; Wang et al., Reference Wang2011; Neo et al., Reference Neo2013; Oechssler et al., Reference Oechssler, Roider and Schmitz2013, Reference Oechssler, Roider and Schmitz2015). Instituting an analogous cool-off period for borrowers at risk of defaulting would be easy to do and free to implement: in the event that a borrower cannot make his or her payment, either during the course of repayment or at the end of the loan period, the loan officer would leave and return the next day once the group has had a chance to cool off and consider the consequences of not pitching in. If such an intervention were to be successful in reducing avoidable defaults, MFIs would stand a better chance of becoming self-sustaining.
Secondly, it has been shown that reputation concerns can provide a rationale for rejecting in the UG, in order to induce others to offer more in the future (Fehr & Fischbacher, Reference Fehr and Fischbacher2003). Thus, it may be advantageous for MFIs to minimize the opportunity for such incentives. For example, to the extent that borrowers who refuse to pitch in do so because they do not want to be seen as the kind of person who can be taken advantage of (Thaler, Reference Thaler1988), allowing borrowers to pitch in for others’ loans anonymously would allow those who want to help others to do so without any reputational repercussions. In general, any procedural change that removes cues to reputation for the pitching in phase (but not the initial contribution phase) should retain the feature necessary for avoiding free-riding while reducing the motivation to hold out when pitching in is possible.
In the decades since the solidarity group model of microlending came into existence, it has spread to many millions of borrowers in most of the world's developing nations. But this spreading did not take into account the psychological variation across societies, and the one-size-fits-all approach to microlending has run into sustainability issues (Hermes & Lensink, Reference Hermes and Lensink2011). MFIs, and therefore their borrowers, stand to benefit from a deeper understanding of the psychology that makes microcredit work where it works and fail where it fails.
Human subjects approval
These studies complied with all ethical regulations for the use of human subjects, and approval for the study was provided by the Human Subject Committee at Yale University.
Supplementary material
To view supplementary material for this article, please visit https://doi.org/10.1017/bpp.2019.29.